Nexus Repository Telemetry
Sonatype Nexus Repository's in-product analytics feature helps improve Nexus Repository, guiding the areas on which we focus our efforts.
Required Base Telemetry
Nexus Repository sends required base telemetry to provide expected daily usage metrics for entitlement review.
Note
SAGE deployments are excluded from the required base telemetry described on this page. Customers using SAGE are not expected to transmit this telemetry to Sonatype.
Expected daily usage metrics include request and component usage data, such as daily repository request counts and current component totals. These values can help Sonatype review usage over time, including total requests in a calendar month and peak components observed in a calendar month.
If expected daily metrics are not received, a grace period may apply.
Note
Community Edition has no supported telemetry exemption or configuration option that bypasses required base telemetry. For Community Edition help, use the Sonatype Community or the Support Knowledge Base. If you use Community Edition and need a disconnected deployment, contact Sonatype to discuss eligible commercial options, including SAGE.
If your organization has an applicable Nexus Repository commercial support entitlement and your instance starts frequently, runs for short periods, cannot send required base telemetry during normal operation, or requires disconnected operation, contact Sonatype Support to review the options available for your entitlement.
Acknowledge Required Base Telemetry
Starting in Nexus Repository 3.97.0, an administrator must acknowledge the required base telemetry requirement during onboarding. The acknowledgement appears for both new self-hosted installations and instances upgraded to Nexus Repository 3.97.0 or later.
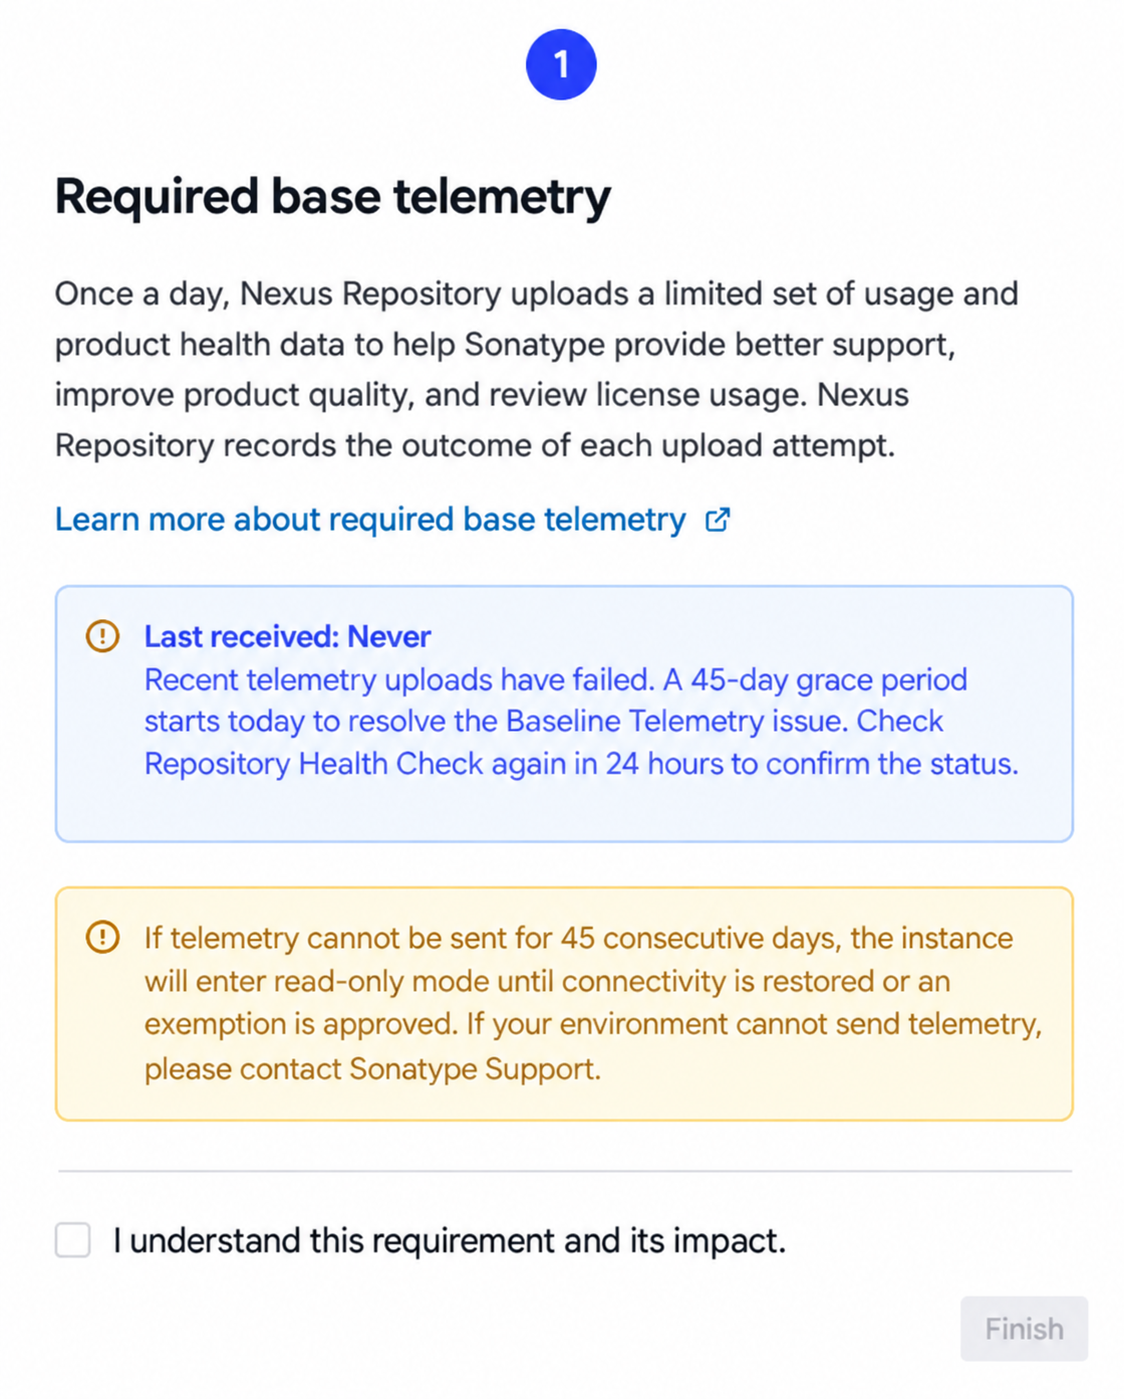
The acknowledgement records that an administrator understands the telemetry requirement and the effect of unsuccessful telemetry delivery. Acknowledgement is recorded once for the Nexus Repository instance. After it is recorded, administrators are not prompted to acknowledge the requirement again.
Required Base Telemetry Grace Period
Nexus Repository monitors required base telemetry delivery and provides a grace period when telemetry cannot be successfully uploaded. The grace period depends on the Nexus Repository edition:
Edition | Grace Period |
|---|---|
Community Edition | 10 days for versions earlier than 3.98 30 days for versions 3.98 and later |
Pro Edition | 45 days |
Nexus Repository counts qualifying failures by the date of the telemetry report's collection period. Multiple failed attempts for the same reporting day, including attempts from different nodes in a high-availability deployment, count as one day. Only reporting days after the latest successful upload count toward the grace period. Retrying the same report does not consume an additional day.
During the grace period, Nexus Repository continues to operate normally. A Baseline Telemetry Upload Issue warning appears when upload failures require administrator attention and shows the remaining grace-period time.

To resolve a required base telemetry upload issue, take the following steps:
Verify that the Nexus Repository server can reach the required telemetry endpoints.
Run the Upload Retry task.
Review the Baseline Telemetry status under Settings → Status.
If telemetry still cannot be delivered,
Use Sonatype Community for Community Edition deployments. Contact Us to connect with a representative.
If you have an applicable Nexus Repository commercial support entitlement, contact Sonatype Support.
After Nexus Repository successfully uploads required base telemetry, the telemetry warning is cleared.
Note
This grace period applies to telemetry delivery and not to the usage limits of Community Edition's separate usage-limit grace period is unchanged, and CE still has no supported telemetry exemption or configuration bypass.
Monitor Required Base Telemetry
Use GET /service/rest/v1/status/check to monitor required base telemetry. The endpoint requires authentication and the nexus:metrics:read permission. The endpoint returns all registered health checks.
Use the following command to retrieve the Baseline Telemetry result:
curl -u '<username>:<password>' \
  'https://<nexus-host>/service/rest/v1/status/check' \
  | jq '."Baseline Telemetry"'
Example Response 1:
"Baseline Telemetry": {
  "healthy": true,
  "message": "Baseline Telemetry status: Active. Last successful upload: 2026-10-20T03:15:42.123456-04:00.",
  "error": null,
  "details": null,
  "duration": 4,
  "timestamp": "2026-10-21T09:12:01.512Z"
}
Example Response 2:
"Baseline Telemetry": {
  "healthy": false,
  "message": "Baseline Telemetry status: Not acknowledged. Mandatory telemetry acknowledgement was not received.",
  "error": null,
  "details": null,
  "duration": 1,
  "timestamp": "2026-10-21T09:12:01.490Z"
}
Review healthy and message fields to identify the telemetry state and required action. The following table describes the possible states and the action to take for each.
|
| Description |
|---|---|---|
|
| Fewer than three qualifying failed reporting days have accumulated. Review the last successful upload and any upload error reported in |
|
| The installed license includes the telemetry opt-out feature. |
|
| An administrator must acknowledge the required base telemetry notice. This state takes priority over upload status in the check. |
|
| At least three qualifying failed reporting days have accumulated, but telemetry-related read-only restrictions have not started. Investigate the reported upload issue, resolve it, and retry the upload. |
|
| The number of qualifying failed reporting days has reached the applicable grace-period limit. Restore telemetry delivery and run the Upload Retry task to restore normal operation.. |
Caution
Activedoes not guarantee that the latest upload succeeded. The message can include a recent upload error while healthy remains true.Configure your monitor to alert when the
Baseline Telemetrycheck'shealthyvalue isfalse. The endpoint can return HTTP200even when a check is unhealthy. Handle authentication failures, missing check results, and request failures separately. Reviewmessagefor the telemetry status and any reported upload error.
Acknowledge Required Base Telemetry Through REST API
You can query or record the required base telemetry acknowledgement through the Nexus Repository REST API.
Method | Purpose |
|---|---|
| Returns whether required base telemetry has been acknowledged. |
| Records the required base telemetry acknowledgement. |
Both operations require authentication and the nexus:* permission. The endpoint is:
/service/rest/v1/system/mandatory-telemetry-acknowledgement
Status | Meaning |
|---|---|
| The |
| The acknowledgement was recorded successfully. |
| The |
| The authenticated user does not have the required permission. |
GET Example:
curl -u <username>:<password> \
  -X GET \
  https://<nexus-host>/service/rest/v1/system/mandatory-telemetry-acknowledgement
POST Example:
curl -u <username>:<password> \
  -X POST \
  -H "Content-Type: application/json" \
  -d '{"acknowledgement":true}' \
  https://<nexus-host>/service/rest/v1/system/mandatory-telemetry-acknowledgement
Refer to Nexus Repository API Reference page for more details.
Read Only Mode
Nexus Repository enters telemetry-related read-only mode when the number of qualifying failed reporting days reaches the grace period limit for your edition and version.
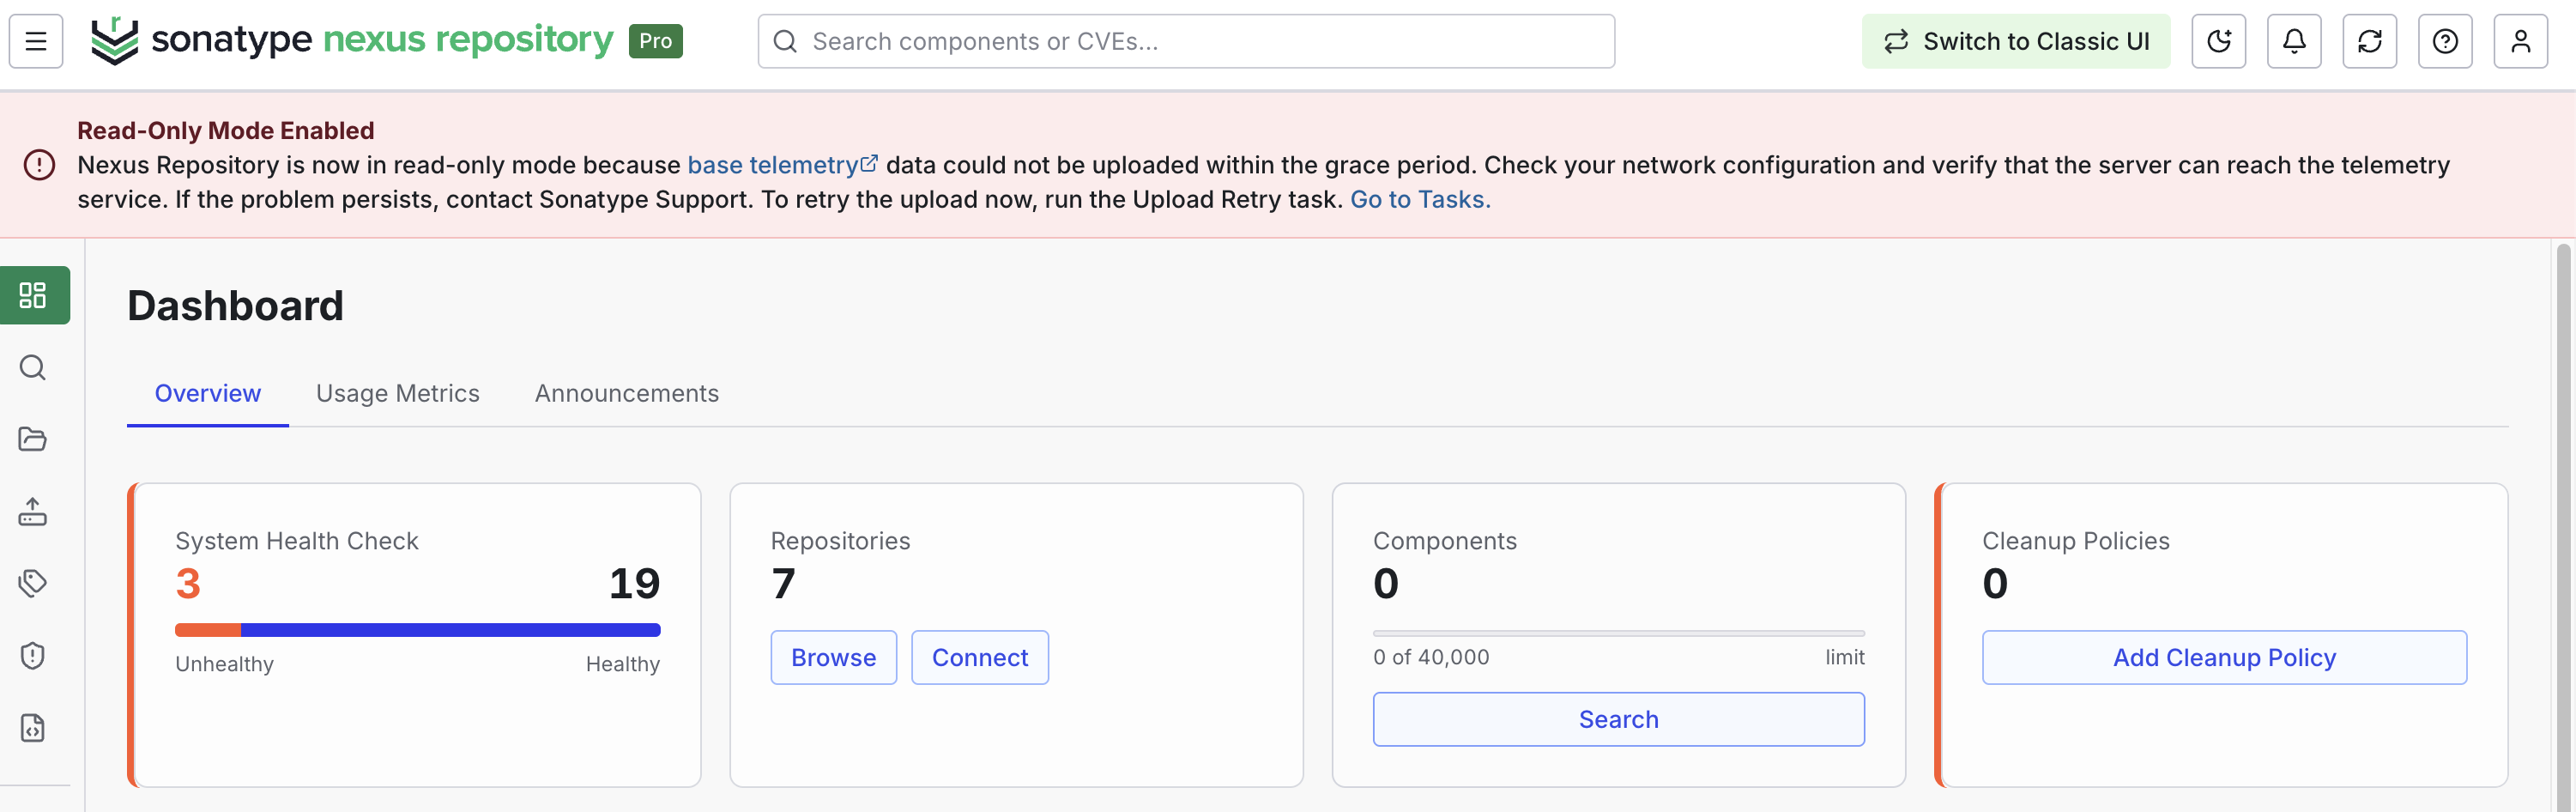
To restore normal operation, resolve the telemetry connectivity issue and successfully send required base telemetry. Run the Upload Retry task after restoring connectivity if you want to retry the upload immediately. To know the general procedure to create and configure a task, see Tasks.
Note
Exceeding licensed usage limits or a discrepancy in reported usage does not trigger this telemetry-related read-only mode. License usage and reporting discrepancies are handled separately from telemetry delivery.
Configure a TLS-Intercepting Proxy
If your network uses a TLS-intercepting proxy, configure Nexus Repository to use the proxy and add the proxy’s certificate to the Nexus Repository trust store. Telemetry requests use the Nexus Repository trust store. Configuring the proxy without trusting its certificate can prevent telemetry uploads. These failures count toward the required telemetry grace period. If the failures continue through the grace period, Nexus Repository enters read-only mode.
Take the following steps to configure the proxy and certificate:
Configure the HTTP and HTTPS proxy settings.
Go to Settings → HTTP. Enable and configure the HTTP and HTTPS proxy settings for your environment. For more details, see HTTP Request and Proxy Settings.
Add the proxy's certificate to the Nexus Repository trust store.
Go to Settings → SSL Certificates, and add the certificate. You can load the certificate from a server or paste a PEM-encoded certificate. Review Configuring SSL for details.
Verify that the imported certificate is valid and includes the required certificate chain. Renew and replace it before it expires.
Confirm that Nexus Repository can upload telemetry. Review the telemetry status and logs for upload failures. If the failure continues, check the certificate chain, expiration date, hostname and confirm that both HTTP and HTTPS proxy settings are correct.
What Gets Sent?
This feature will collect anonymous, non-sensitive information on the general use of Nexus Repository.
Anonymous
We do not collect information that identifies specific users: no usernames, passwords, emails, hostnames, or URLs of any kind.
Non-Sensitive
This feature doesn’t collect identifying information on which you or your teams are working. We don’t collect repository names, component names, coordinates or paths, the names or content of content selectors or routing rules, or paths of any kind—anything that might inadvertently contain information about your organization’s projects or the components you’re using.
Configuration
We collect high-level configuration choices, feature usage rates, internal error frequency, and performance information. Are you using the S3 blob store support? Is it working well? Is it fast enough? Have you switched to NuGet v3, or is v2 still everywhere?
Environmental Details
We collect a limited amount of environmental information to help us understand nuts-and-bolts details like memory and thread pool efficiency. This also helps us understand how organizations are adopting cloud environments and when to expand support for the platforms where you deploy Nexus Repository.
Inspect Telemetry Data
You can inspect telemetry data captured by your Nexus Repository instance through the metrics endpoint or the metrics.json file in a support ZIP.
The metrics endpoint requires authentication and the nexus:metrics:read permission. The endpoint depends on your Nexus Repository version:
Nexus Repository Version 3.81.0 and later -
/service/rest/metrics/dataNexus Repository earlier than 3.81.0 -
/service/metrics/data
Review the metric names and values in the JSON response. For definitions of usage-related fields, see Service Metrics Data API.
To inspect the data through a support ZIP, sign in as an administrator and generate an archive that includes metrics. Extract the archive, locate metrics.json and open it to review the captured metric names and values. See Support Features for instructions on generating a support ZIP. Use the Baseline Telemetry health check to monitor telemetry upload status.
Endpoints to Whitelist
Whitelist the following endpoints to ensure that your Nexus Repository instance can successfully send telemetry:
Edition | Endpoint | Purpose |
|---|---|---|
Community Edition |
| Telemetry upload |
Community Edition |
| Telemetry upload |
Nexus Repository Licensed Edition |
| Telemetry upload |
Nexus Repository Licensed Edition |
| Telemetry upload |
Nexus Repository Licensed Edition |
| Checks whether the installed license authorizes telemetry submission |
Example Success and Error Logs
The samples below provide an example of what you can expect to see in the logs when telemetry is successfully sent or when it fails to send:
Success
Telemetry upload successfully with valid signature
Issues Validating Telemetry Payload Signature
Telemetry upload failed (signature verification). Status: {}, URL: {}Issues with Telemetry Content
Telemetry upload failed (client error). Status: {}, URL: {}, Response: {}Issues with Required Base Telemetry
This instance of Nexus Repository has been unable to upload required base telemetry data for the past {} days. This is a warning only. Your instance will continue to operate normally. Check that your server can reach the Sonatype telemetry service, then run the Upload Retry task. If your environment cannot send telemetry or the issue persists, contact Sonatype Support.Required Base Telemetry Not Acknowledged
Mandatory telemetry acknowledgement was not received. An administrator must acknowledge the mandatory telemetry notice from the Nexus Repository UI.
Feedback
While automated data is useful, we continue to rely on feedback from developers and DevOps professionals like you to truly understand how you’re using Nexus Repository and how well it meets your needs.
If you have questions or feedback about this program or any other aspect of Nexus Repository, please let us know in the Nexus Repository Manager category.