Success Metrics
About the Data
Data Refresh Frequency: Updated daily at around 13:45 UTC. New scan and violation data can take up to 24–36 hours to appear.
Displays Data for: For new installations, data will be visible after a week of scanning with version 184.
Minimum Requirements: Applications must be scanned at least once after upgrade to version 184. The dashboard currently shows data related to violations and remediations that are discovered after upgrade to version 184.
Note
For improved usability, performance, and new enhancements, the Success Metrics dashboard has been split into the following dashboards:
Success Metrics: Program Health Dashboard
Success Metrics: Remediation Ops Dashboard
The split dashboards are available for Lifecycle version 204 or higher.
Overview
Sonatype Lifecycle collaborates with your teams to keep help mitigate the security, compliance, and quality threats to your DevSecOps pipelines. By utilizing the policy violation workflows, your teams can evaluate applications, remediate vulnerabilities or apply waivers to effectively prioritize and optimize and streamline development process. This approach ensures the delivery of secure and compliant releases within a reasonable time-frame.
The Success Metrics dashboard helps pinpoint areas of improvement within your DevSecOps teams, fostering greater synergy with Sonatype Lifecycle.
The Success Metrics dashboard provides:
Remediation overview for policy violations
Application onboarding and scan activity
Number of policy violations detected
Risk Ratio trends
Policy violations grouped by policy type and threat level
Detailed information about affected components and applications
The Success Metrics dashboard can help identify areas of improvement within your devSecOps teams leading to greater synergy with Sonatype Lifecycle.
Get to Know Your Success Metrics Dashboard
The interactive dashboard provides multiple filter options to view the success metrics for your organization. You can filter dashboard results by Date Range, Organization, Sub Orgs, Application, Application Category, Policy Threat Level, Policy Type (Security, Quality, License, and Other), Stage, Component type, Remediation Status (fixed, open and waived) and Violation Type.
The selected filters are applied across all dashboard visualizations and tables.
Use the available filters to narrow dashboard results based on selected applications, policy types, threat levels, scan stages, and violation types.
Stages available for filtering are release, stage-release, build, compliance and source. The build stage is selected by default.
Note
When you select an Organization, the Sub Orgs filter displays only the sub-organizations associated with that organization. If the selected organization has no sub-organizations, the Sub Orgs field displays no_sub_org.

Note
The proxy stage may appear in Success Metrics when Firewall for Docker/container image evaluation is configured and the proxy-stage data is associated with an application registered in IQ Server.
The develop stage is explicitly excluded from Success Metrics telemetry and does not appear in reports.
For the compliance stage, legacy telemetry events (such as
TIME_TO_LEGACY_VIOLATION) are not sent. Other telemetry data, including policy violation, waiver, and remediation events, continues to be collected and reported.
NOTE: Lifecycle instances with over thousand applications may take longer to load.
Downloading Dashboard and Table Data
You can download dashboard and table data using the dashboard export options.
For instructions on exporting dashboards, tables, and scheduling deliveries, see Exporting Dashboards and Table Data .
Saved Filters:
The Enterprise Reporting Sonatype Default filter set is always available and cannot be changed or removed. To adjust filters, save your selections as a new saved filter set. Any saved sets you create can be edited or deleted as needed. Scheduled deliveries that reference a saved set use the values that were saved at the time of scheduling and will not update automatically if the saved set is edited later.
Saved Filters capture a named set of the dashboard’s current filter selections so you can quickly reopen the dashboard scoped to that view. Use the following steps below to create, apply, edit, set a default, delete, and schedule saved filter sets.
Apply the filters you want for the view (Date Range, Organization, Sub Orgs, Application, Application Category, Policy Threat Level, Policy Type, Stage, Violation Type, etc.).
Open Saved Filters and choose Save As to create a named saved set; the UI validates the name as you type.
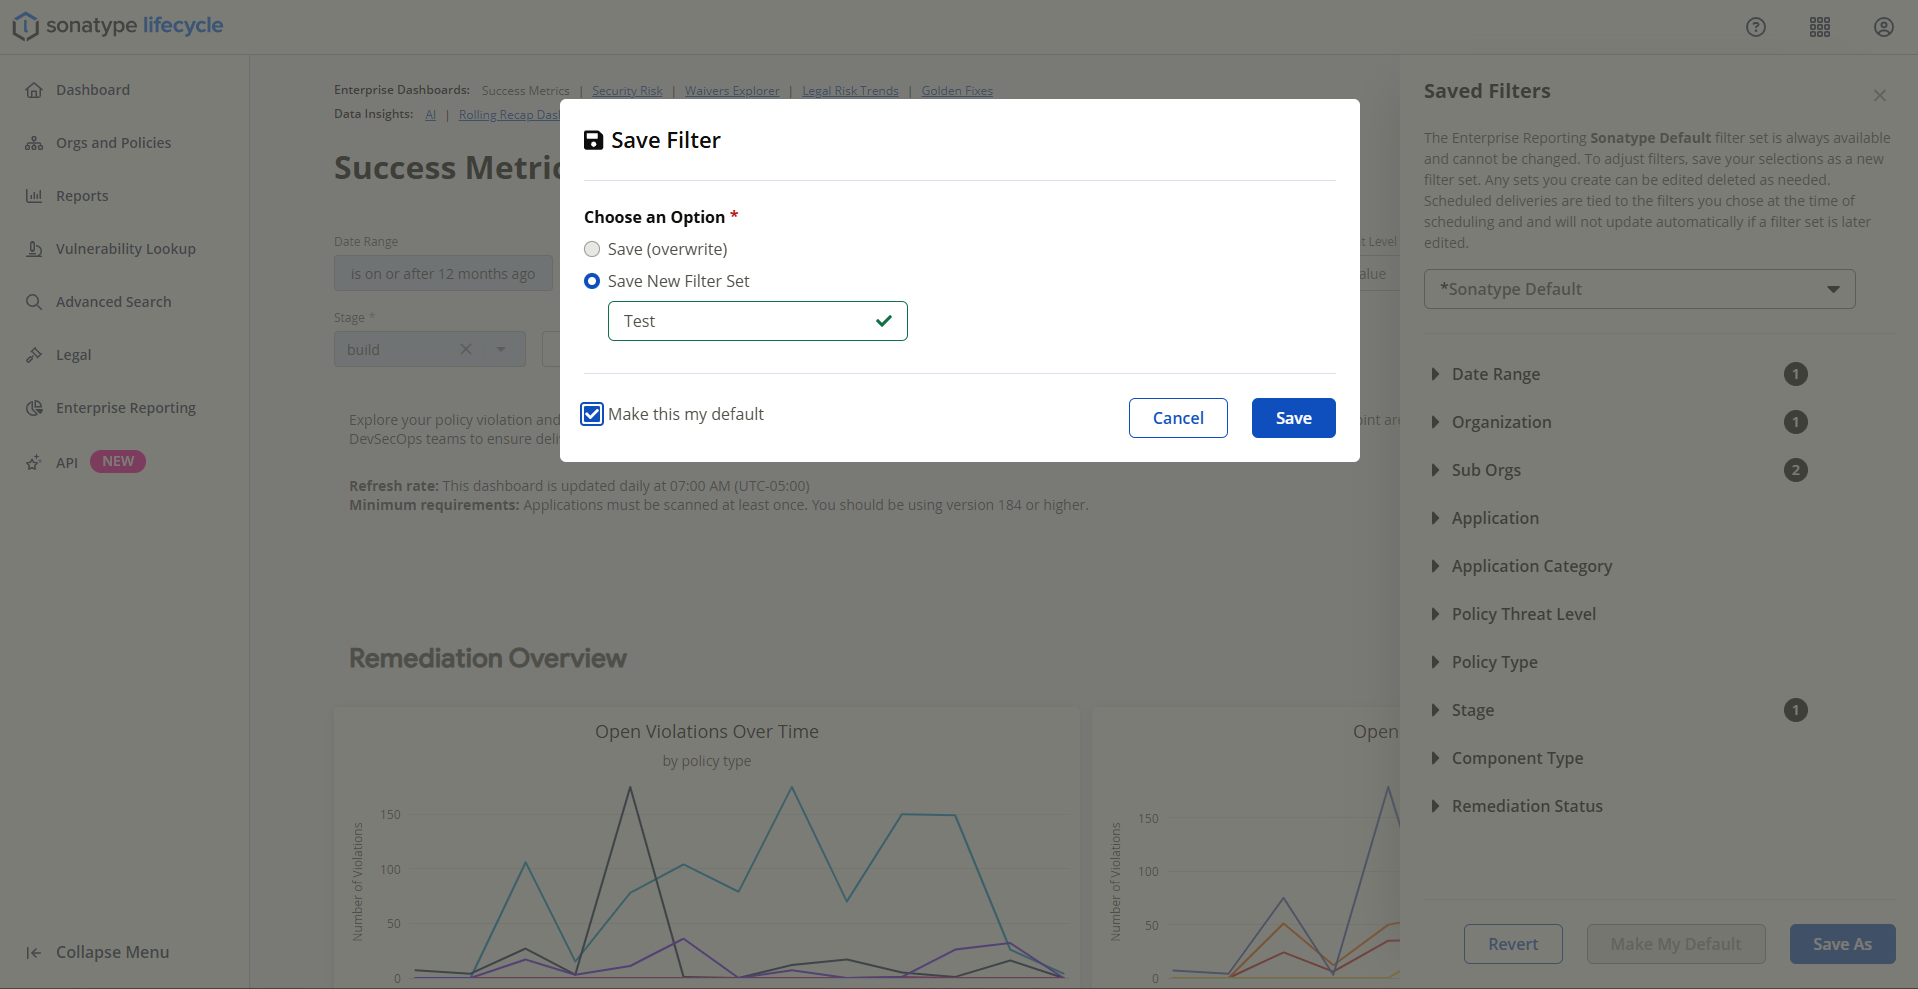
To update a set, apply it and choose Save to overwrite, or Save As to create a variation. An asterisk in the filter name indicates unsaved changes.
Make any saved set your personal default with Make My Default. Sonatype Default is always available and protected; deleting a personal default reverts to Sonatype Default.
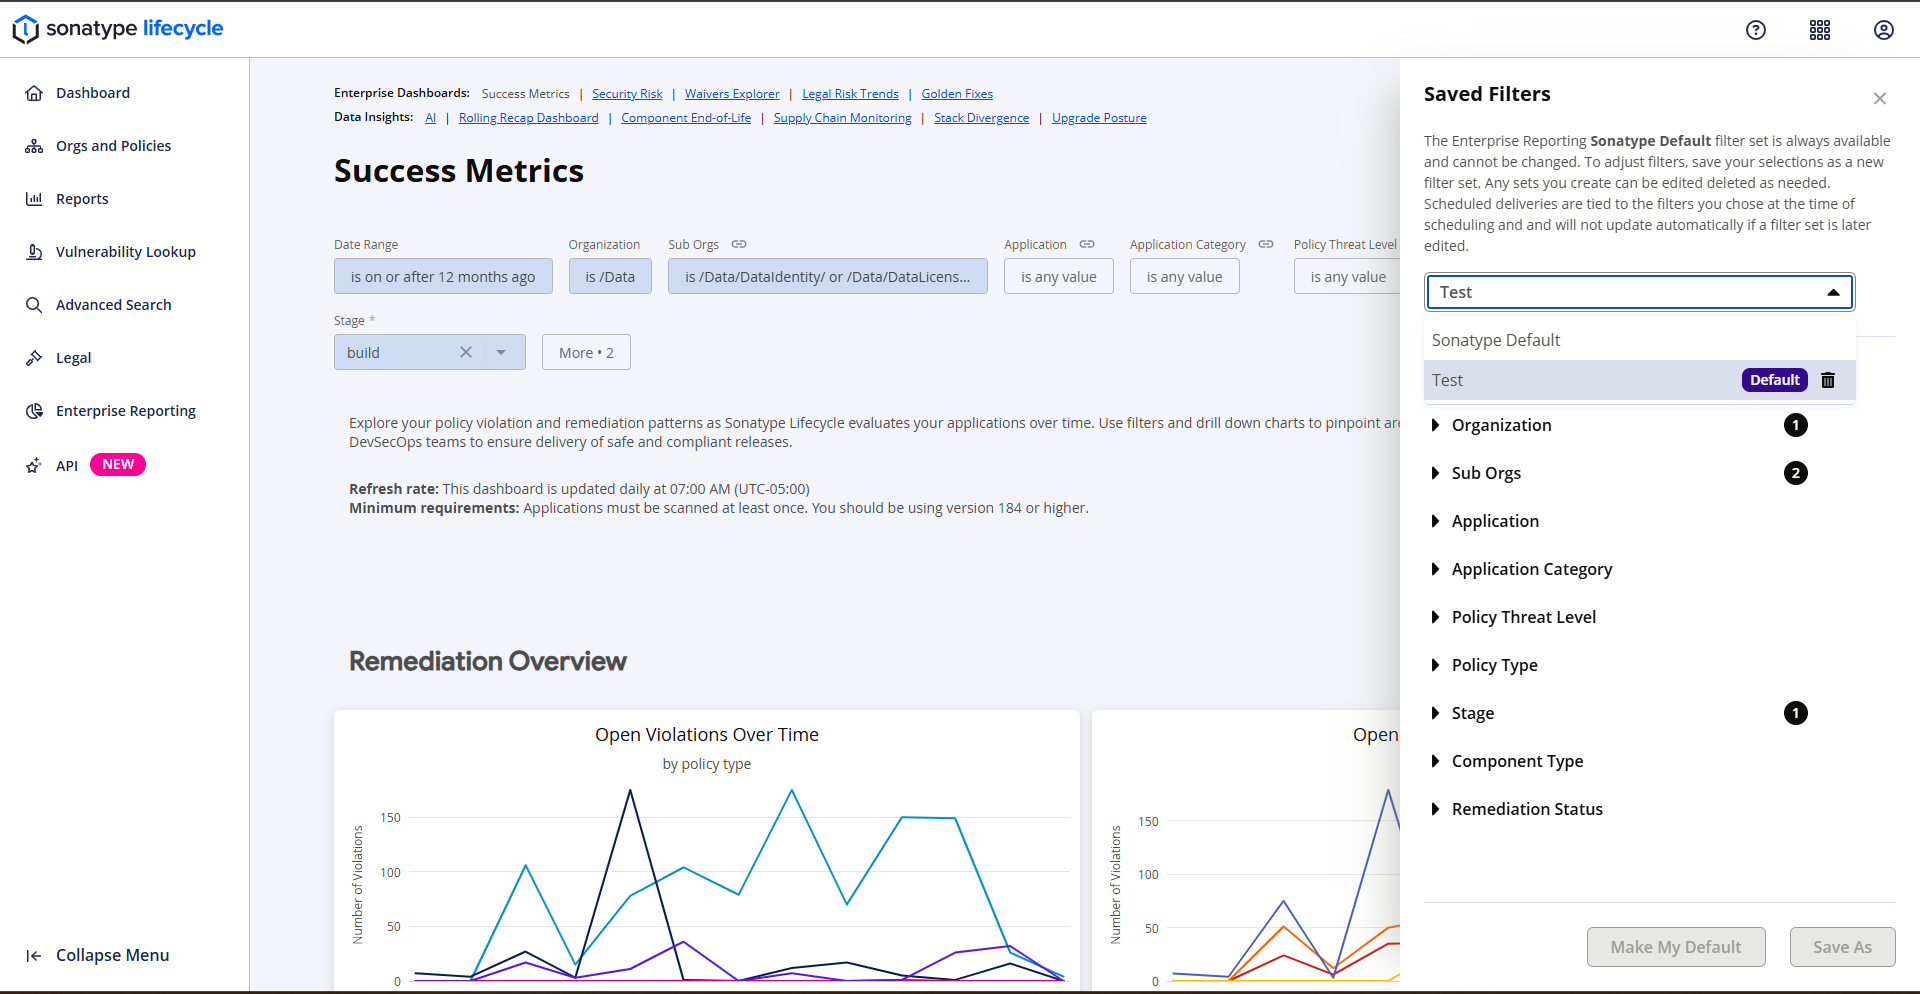
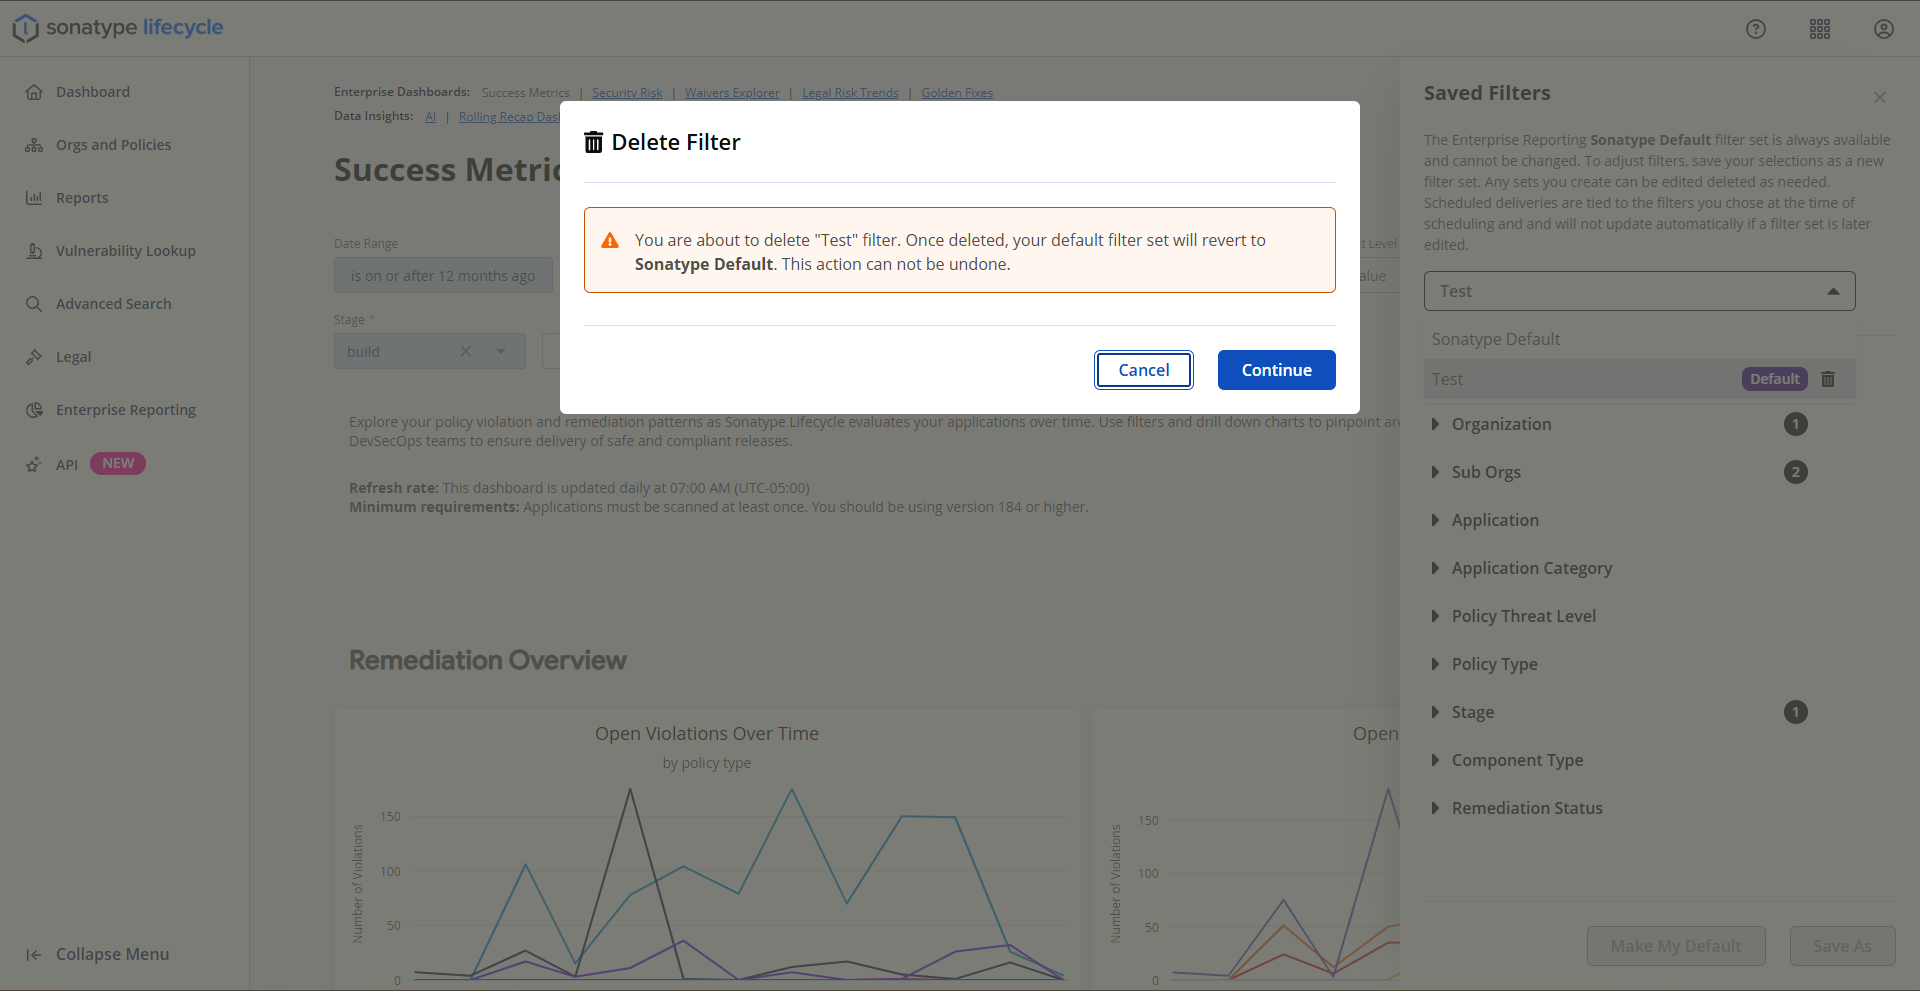
To delete a saved set, select it and confirm. Deletion removes the set from your account only and, if it was your default, resets the default to Sonatype Default.
A saved set stores only filters that exist on the dashboard where it was created. Applying it to another dashboard uses only matching filters; unsupported filters are ignored. Use Save As to preserve every selection across dashboards.
Scheduled exports or deliveries that reference a saved set use the values saved at schedule time; editing the saved set later does not change existing scheduled deliveries.
Note
Filter set names are validated as you type. Filter set name must be 1–35 characters and may not include special characters such as ^, &, %, or >. The UI shows an inline error for invalid characters or length violations and prevents saving until validation passes.
Remediation Overview
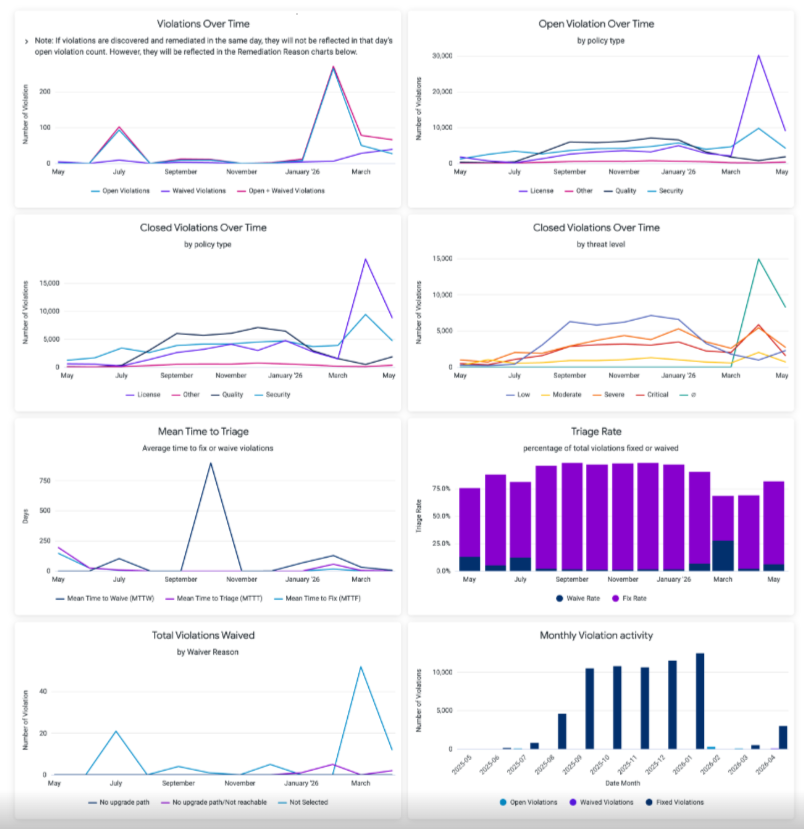
The Remediation Overview chart displays trends related to open violations, closed violations, remediation activity, Mean Time to Waive (MTTW), Mean Time to Triage (MTTT), and Mean Time to Fix (MTTF) across policy types and threat levels.
The policy types displayed here include Security, Quality, License and Other. Click on the policy type labels (below the X-axis) to select/de-select the corresponding trend line on the chart.
The threat levels displayed here include Low (0-3), Moderate (4-6), Severe (7-8), and Critical (9-10). Click on the threat level labels to select/de-select the corresponding trend line on the chart.
The Mean Time charts display the average number of days taken to waive, triage, or fix violations within the selected filter range.
The Triage Rate chart displays the percentage of total violations fixed or waived during the selected time period. Fixing violations includes upgrading, downgrading, removing components, or fixing vulnerabilities.
Higher triage rates may indicate that violations are being resolved or waived more consistently over time.
The Total Violations Waived chart displays waived violations grouped by waiver reason.
The Monthly Violation activity chart displays monthly counts of open, waived, and fixed violations within the selected filter context.
Note
If violations are discovered and remediated on the same day, they will not be reflected in that day's open violation count. However, they will be reflected in remediation-related charts.
Examples:
A violation that is discovered and remains open continues to appear in open violation charts until it is fixed or waived.
A violation that is fixed or waived during the selected time period is reflected in remediation and triage-related charts.
Violations discovered and remediated on the same day are not reflected in that day's open violation count but are included in remediation-related charts.
Drill Down for a Deeper Analysis
Click on any point on the trend lines to drill-down by a week-wise or day-wise chart.
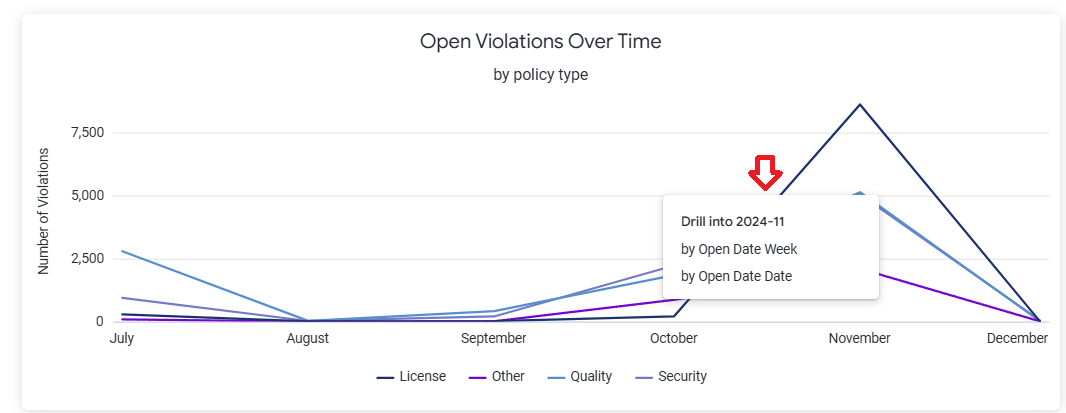
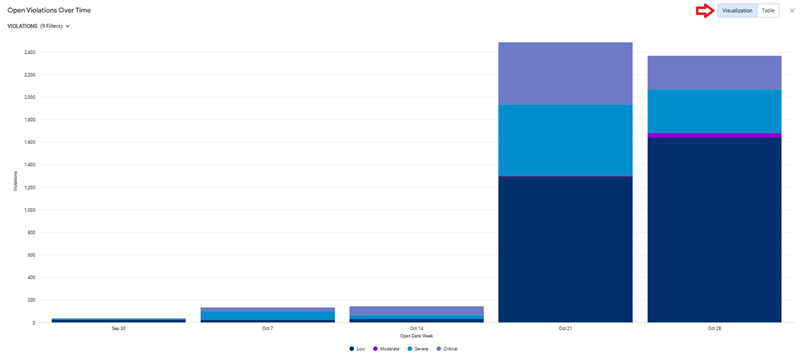
The drill-down view offers a deeper analysis of open violations over the selected time period, for each threat level as shown below. You can select Table from the top to view the results in a tabular format, instead of the chart.
Apps & Scans
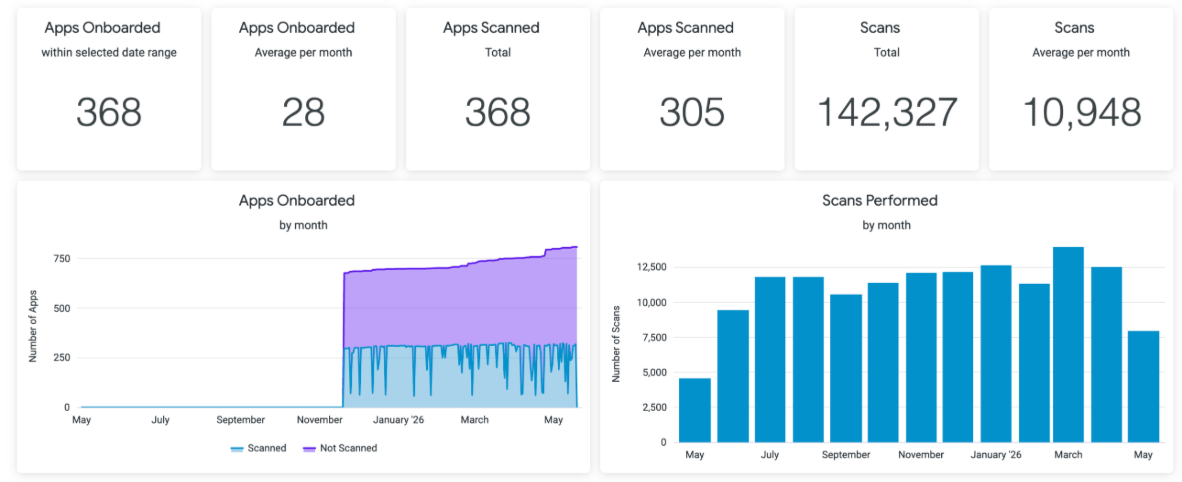
The Apps & Scans section displays onboarding and scanning activity for applications within the selected filter range.
The metric cards display:
Total onboarded applications
Average onboarded applications per month
Total scanned applications
Average scanned applications per month
Total scans performed
Average scans performed per month
The Apps Onboarded and Scans Performed charts display onboarding and scanning activity trends over time within the selected filter range.
The Component filter does not apply to the visualizations in the Apps and Scans section.
Use the Stage filter to review application scanning activity across different scan stages.
Are Your Applications Being Scanned at Required Stages?
By selecting a specific stage in the Stage filter, you can ensure that most of your applications are being scanned at that stage.
Violations Overview
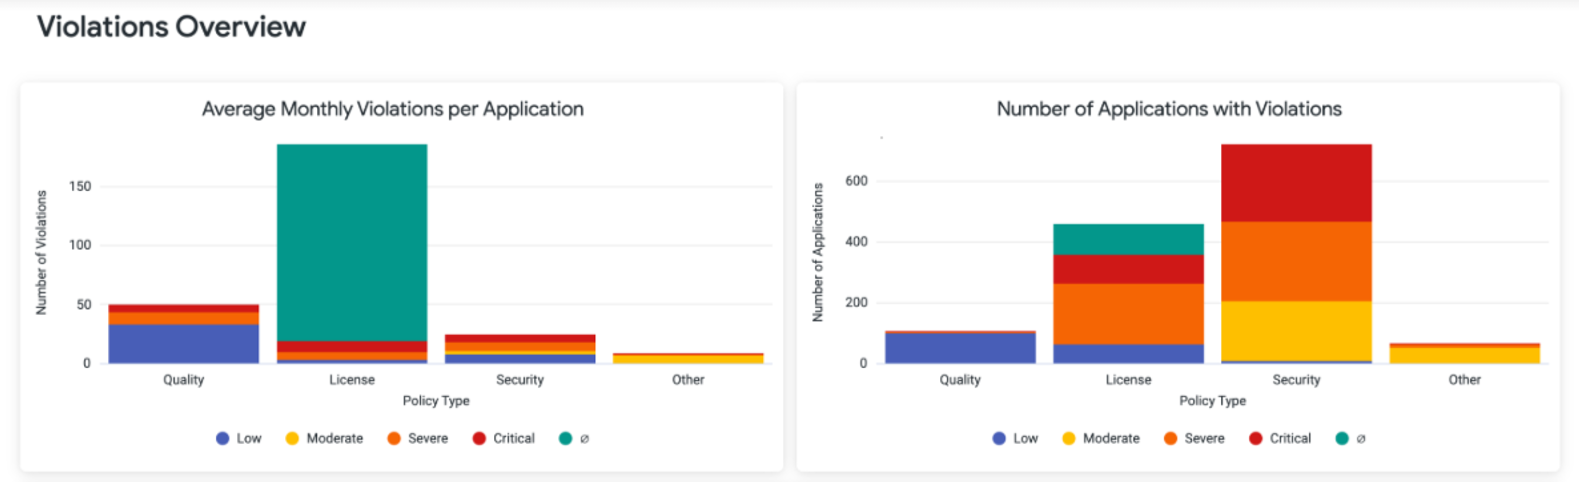
This section displays policy violations aggregated at the application level.
The charts display:
Average monthly violations per application grouped by policy type
Number of applications with violations grouped by policy type and threat level
The policy types displayed include Security, Quality, License, and Other.
The threat levels displayed include Low, Moderate, Severe, and Critical.
Applications can appear across multiple threat levels when violations of different severities are detected within the same application.
Risk Ratio
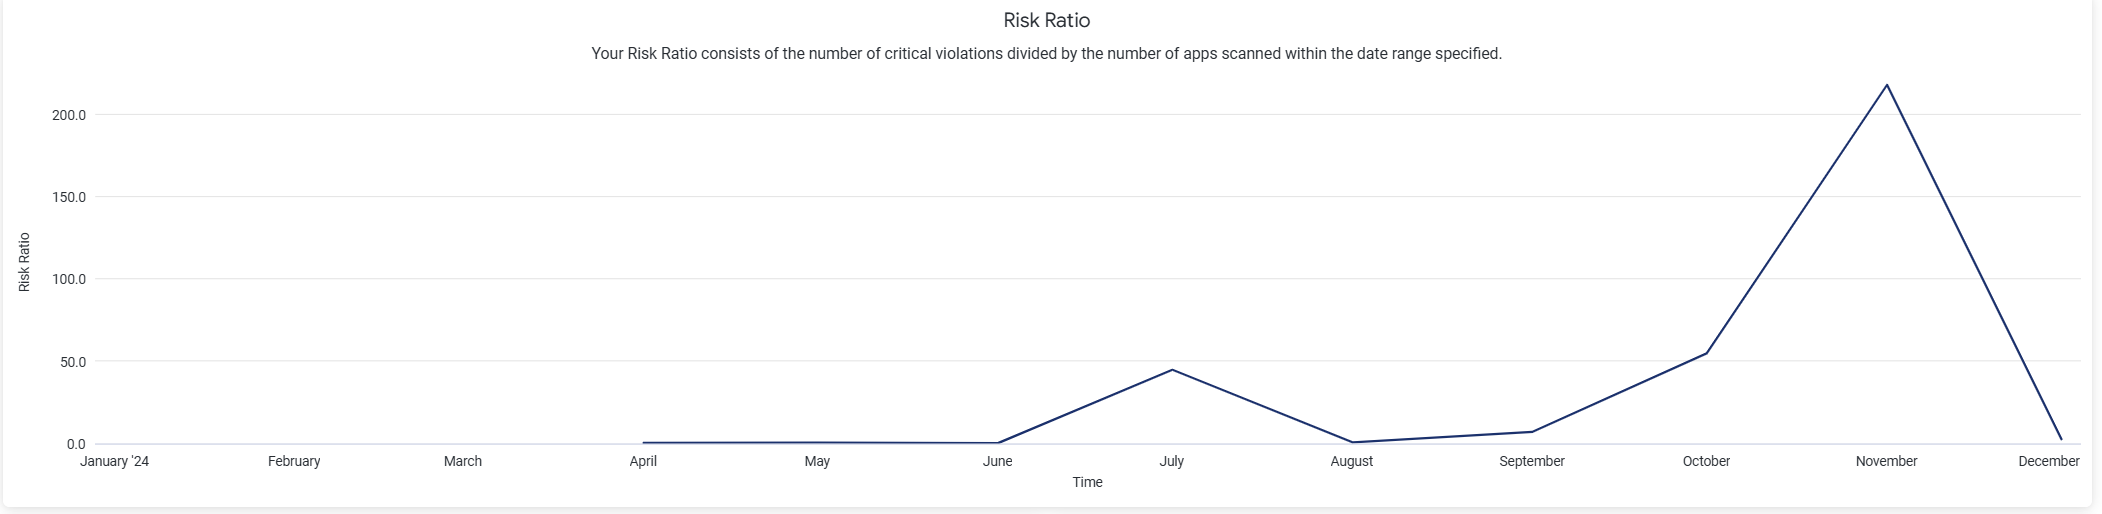
The Risk Ratio is a ratio of the number of critical violations to the number of applications scanned in the date range selected in the filter.
Example: If 10 applications are scanned within the selected date range and 5 critical violations are detected, the Risk Ratio is 0.5.
Is Risk Ratio High?
A prolonged high risk ratio is not a good indicator of your security posture and may need intensive remediation efforts. However, a spike may just be an indicator that a critical violation that could have occurred due to a specific component, was fixed promptly by your team.
Drill Down for a Deeper Analysis
Click on any point on the trend lines to drill-down by a week-wise or day-wise chart.
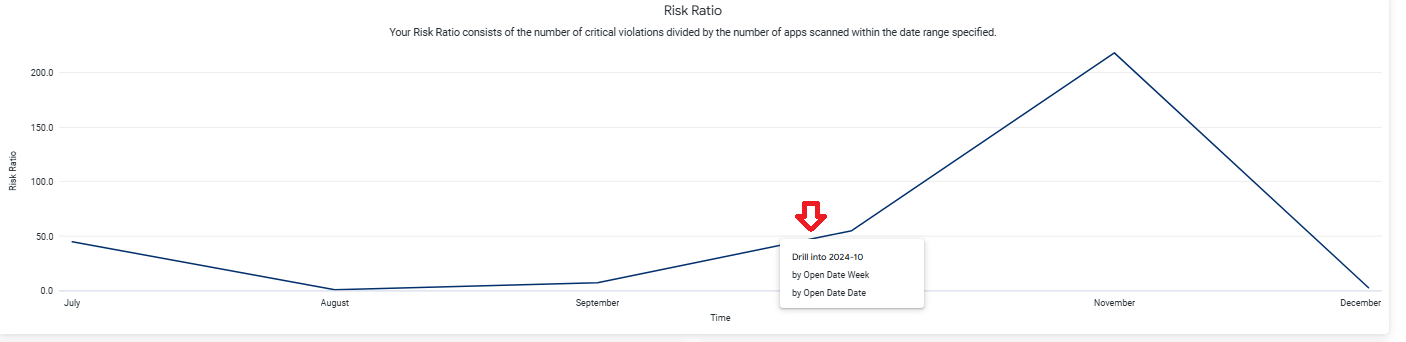
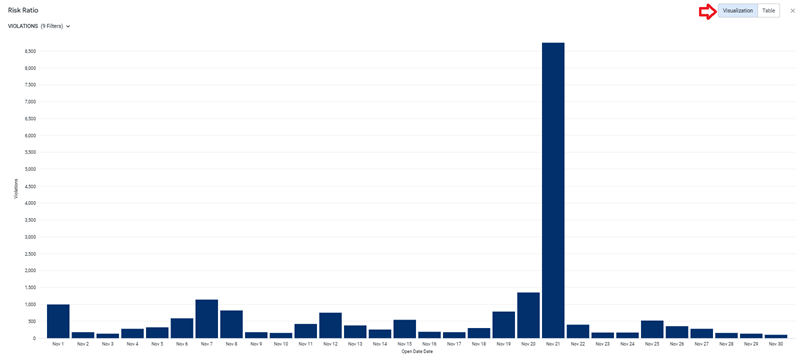
The drill-down view offers a deeper analysis of the risk ratio over the selected time period, for each threat level as shown below. You can select Table from the top to view the results in a tabular format, instead of the chart.
Violations Discovered

This section shows all discovered violations that match the criteria specified in the filter.
The charts show violations aggregated by policy types (Security, Quality, License and Other) and threat levels (Critical, Severe, Moderate, and Low).
Components
The Component Information Table
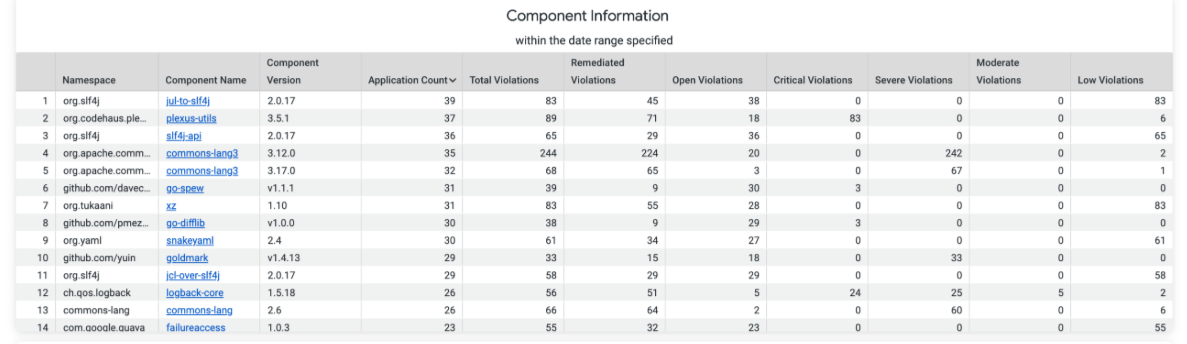
The component information table contains all components that have been implicated with a violation during the application scans that match the criteria specified in the filter.
Table column | Description |
|---|---|
Namespace | The namespace to which the component belongs |
Component Name | Name of the component causing the violation |
Component Version | Version of the component |
Application Count | Number of applications impacted |
Total Violations | Total number of violations associated with the component |
Remediated violations | Number of violations remediated for the component |
Open Violation | Number of violations not remediated for the component |
Critical Violations | Number of violations with threat level "critical" (9-10) |
Severe Violations | Number of violations with threat level "severe" (7-8) |
Moderate Violations | Number of violations with threat level "moderate" (4-6) |
Low Violations | Number of violations with threat level "low" (0-3) |
The Application Information Table
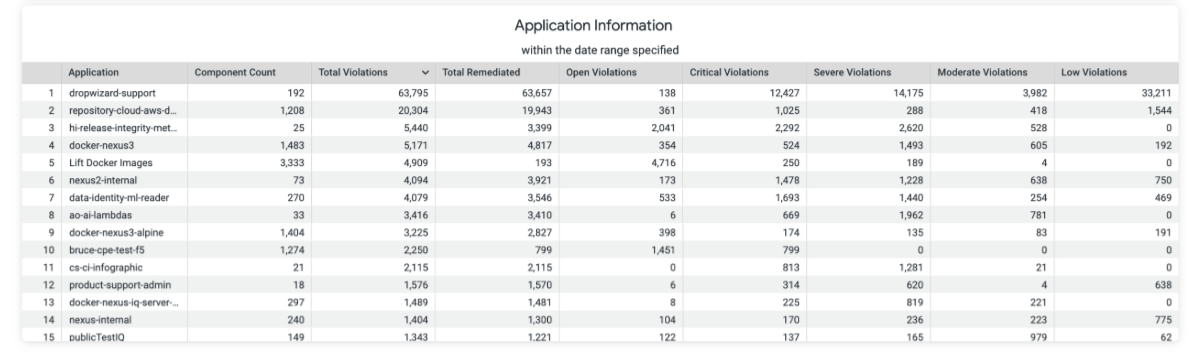
The Application Information table contains applications associated with policy violations matching the selected filter criteria.
Table column | Description |
|---|---|
Application | Name of the application containing the policy violation |
Component Count | Total number of components found in the application |
Total Violation | Total number of violations found in the application |
Total Remediated | Number of violations in the application that are remediated |
Open Violations | Number of components pending remediation in the application |
Critical Violations | Number of violations in the application with threat level "critical" (9-10) |
Severe violations | Number of violations in the application with threat level "severe" (7-8) |
Moderate violations | Number of violations in the application with threat level "moderate" (4-6) |
Low violations | Number of violations in the application with threat level "low" (0-3) |
Troubleshooting
Problem
Clicking on the browser Refresh button may give you the following error:

Solution
Click the Back button on your browser, from the page where you see this error, to go back to the Landing page Enterprise Reporting. Select the dashboard you want to view, to reload the visualizations.
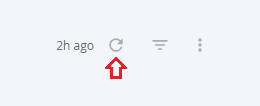
To refresh the page, click on the refresh icon on the top right, instead of the Refresh button on your browser.
Problem
No data visible on the dashboard or any other issues with the dashboard.
Solution
Click on Copy to Support Info to Clipboard button and contact support with this information.