Security Risk Breakdown
About the Data
Data Refresh Frequency: Updated daily at 1:00 pm UTC
Displays Data for: All open violations after January 1, 2022 and resolved violations (waived/fixed) on or after January 1, 2024. For new installations, data will be visible within a week after the first scan.
For versions 184 through 187, the dashboard shows data generated from the time of upgrade (to 184) to present. To view all historical data, upgrade to version 188 or later.
Minimum Requirements: Applications must be scanned at least once, after upgrade to version 184. The dashboard currently shows data related to violations and remediations that are discovered after upgrade to version 184.
Overview
The Security Risk Breakdown dashboard provides insights into the distribution of vulnerabilities along with the associated severity, within each application. It enables developing a targeted remediation approach and defining a plan that maintains a low-risk security risk profile and assists in passing compliance checks that strictly restrict critical vulnerabilities for your applications.
You can use the Security Risk Breakdown dashboard to reveal applications with most risk and prioritize remediation of the vulnerabilities based on the threat level, stage, application category and type of violations (legacy/non-legacy violations.)
By analyzing the The Top 10 Violations Fixed, you can assess the effectiveness of your remediation strategy over the selected time period. By prioritizing remediation of the most common vulnerabilities and CWEs, you can mitigate the security risks faster.
The Security Risk Breakdown simplifies the identification of policy violations by grouping them under the Top 5 categories of:
Get to Know Your Security Risk-Breakdown Dashboard
The interactive dashboard provides multiple filter options to view the security risks in your applications. You can filter on date range, organization, application, application category, policy threat level, stage, violation type, security policy name, component type and remediation status.
The breakdown offers insights into the change in state (from open to waived/fixed) of a violation, over a period of time. For example, for a selected date range covering April 2 to April 10, you can view:
a violation that was first detected or had a state "open" in January and was "fixed" in May.
a violation that was first detected or had a state "open" in February, was "waived" on April 5 and fixed in May.
a violation that was first detected or had a state "open" in April 3 and was "fixed" on April 9.
Violation Types available for filtering are Legacy Violations and Non-Legacy Violations.
Remediation Statuses available for filtering are fixed, open and waived.
Stages available for filtering are release, stage-release, build, compliance and source. The build stage is selected by default.

Top Ten Violations Fixed
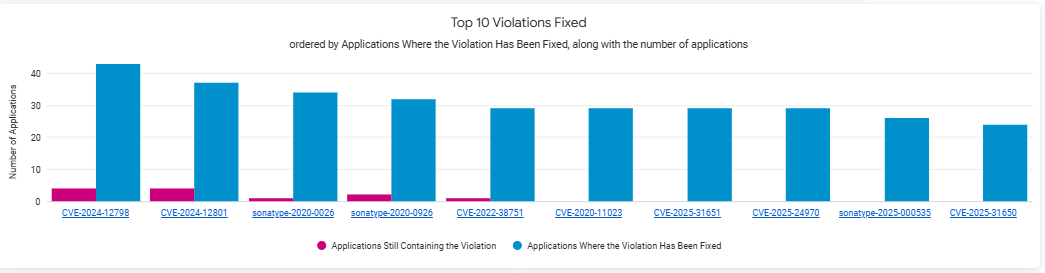
The chart displays the number of applications containing the fixed and pending violations for the top ten most frequently occurring vulnerabilities (X-axis) found in your applications.
The distribution of the top ten violations that were fixed in the various applications gives an insight into the existing security risk. Since these Top 10 vulnerabilities occur in many applications, remediating them has high impact. This chart shows how complete those remediation efforts are. The blue bars show the count of successfully remediated vulnerability instances and the pink bars show the remediation work remaining.
Click on the CVEs on the X-axis to view the detailed description of the vulnerability. Ensure that the base url is configured for your instance of IQ Server to view the vulnerability details. You may observe a change in the severity for a given CVE. This is due to the change in the CVSS score that associated with the CVE, over the course of time.
Top 5: Applications with Most Risk
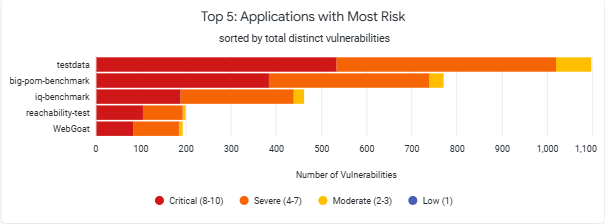
The chart displays the number of vulnerabilities and the associated threat levels for the 5 applications that have the most total risk. Any business critical applications on this list are good targets for focused risk reduction efforts.”
The top 5 ranking of the Applications with Most Risk is determined by the combination of the threat levels and the number of vulnerabilities. There could be scenarios where the number of vulnerabilities are higher, but the application is not shown at a higher risk, in the the Top 5 rankings. This is because of the lower threat levels associated with the vulnerabilities.
Top 5: Most Common Vulnerabilities
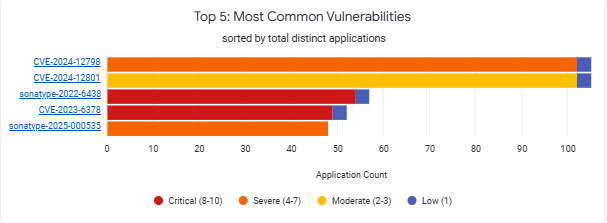
The chart displays the vulnerabilities in your applications and is color coded by threat level. By determining the most commonly occurring vulnerabilities across your applications, you can direct your remediation efforts towards these vulnerabilities and reduce the risk efficiently. The number of applications displayed here shows the distinct count of the applications containing the vulnerability.
The top 5 ranking of the Most Common Vulnerabilities is determined by the combination of the number of vulnerabilities and impacts on the number of applications. There could be scenarios where the number of applications are higher, but the vulnerability is not shown higher in the the Top 5 rankings. This can happen if the vulnerability occurs in many applications but some of those occurrences have lower-severity impact.
Click on the CVEs on the Y-axis to view the detailed description of the vulnerability. Ensure that the base url is configured for your instance of IQ Server to view the vulnerability details.
Top 5: Components with Most Risk
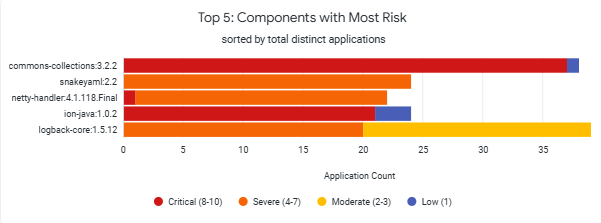
The chart displays the 5 most commonly implicated components along with the associated threat levels. You can target remediation of "critical" and "severe" threat levels to optimize the remediation or risk reduction tasks.
The top 5 ranking of the Components with Most Risk is determined by the combination of the number of vulnerabilities and impacts on the number of applications. There could be scenarios where the number of applications are higher, but the component is not shown higher in the the Top 5 rankings. This is because the chart shows the number of applications that have been impacted by all threat levels that were associated due to changes of CVSS over the time period.
Top 5: CWEs
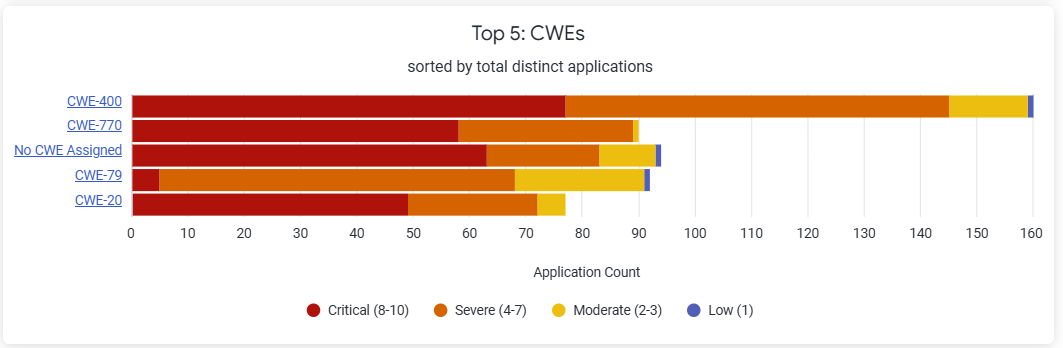
The chart displays the 5 most commonly found cataloged CWEs and the number of affected applications. You can remediate risks based on the weakness taxonomy, and the number of applications affected, by crafting a targeted approach that focuses on certain weakness types.
The top 5 ranking of the CWEs is determined by the combination of the number of CWEs and impacts on the number of applications. There could be scenarios where the number of applications are higher, but the vulnerability is not shown higher in the the Top 5 rankings. This can happen if the vulnerability occurs in many applications but some of those occurrences have lower-severity impact.
Click on the CWEs on the Y-axis to view the detailed description on cwe.mitre.org
NOTE: "No CWE Assigned" indicates that no CWE has been officially assigned to the vulnerability because it is new or uncategorized.
Vulnerabilities
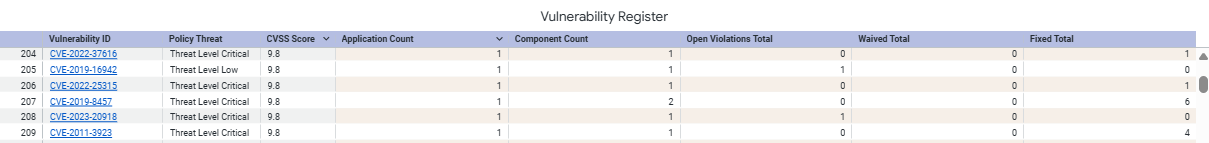
This table shows a list of all vulnerabilities found in the latest application scans.
Analyze the security risk breakdown of a CVE/Sonatype Vulnerability
Click on a vulnerability ID from a row in the Vulnerabilities table to select a vulnerability ID. The Violation Status table below will display all applications, the name of the implicated component, the threat level and remediation status.
The other charts on the dashboard will reflect visualizations for data corresponding to the selected vulnerability ID.
Click on a Vulnerability ID to view data corresponding to this vulnerability ID in other visualizations on the dashboard. The Violation Status table will display the application names, implicated component name, threat level and remediation status for the selected vulnerability ID.
NOTE: Due to limitations of the data visualization platform, this table can show 5,000 rows only. This also applies to the exported data.
Table column | Description |
|---|---|
Vulnerability ID | Published vulnerability identifier Links to Vulnerabilties Details in Lifecycle if base url is configured for your instance. |
Threat Level | Assigned threat level |
Application Count | Number of applications impacted |
Component Count | Number of components implicated by the vulnerability |
Open Violation Total | Total number of open violations (which are not remediated) due to the vulnerability |
Waived Violation Total | Total number of violations due to the vulnerability that are waived |
Fixed Total
| Total number of component fixes (upgrade/downgrade/removal) implemented to remediate the vulnerability. |
Violation Status
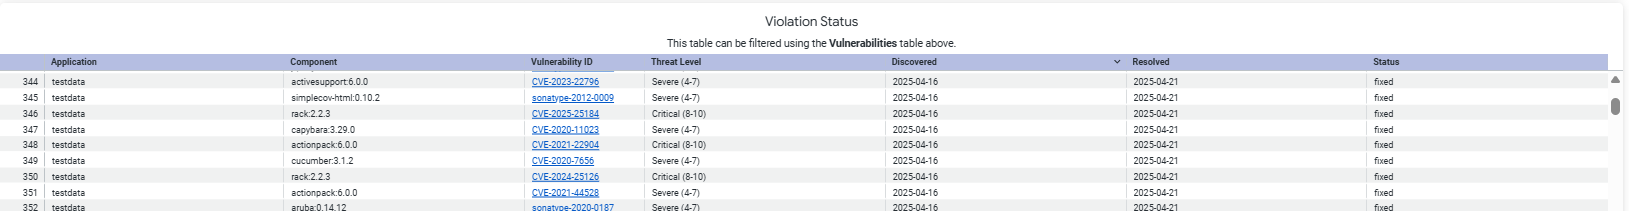
This table shows the violation status including discovered dates, resolved dates and current fix status for the implicated component and the corresponding application in which the violation occurs.
NOTE: Due to limitations of the data visualization platform, this table can show 5,000 rows only. This also applies to the exported data.
Table column | Description |
|---|---|
Application | Name of the application containing the vulnerability |
Component | Name of the implicated component |
Vulnerability ID | Published vulnerability identifier Links to Vulnerabilties Details in Lifecycle if base url is configured for your instance. |
Threat Level | Most recent threat level assigned to the vulnerability If the threat level of a vulnerability was previously categorized as "Critical" but later downgraded to "Severe", the threat level will display "Severe". |
Discovered | Date when the violation was first detected during application scans |
Resolved | Date when the violation was either fixed or waived |
Status | Current status of the violation (open/fixed/waived) |
Troubleshooting
Problem
Clicking on the browser Refresh button may give you the following error:
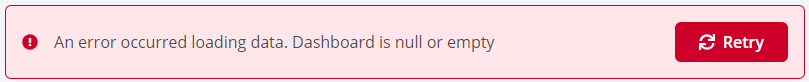
Solution
Click the Back button on your browser, from the page where you see this error, to go back to the Landing page Enterprise Reporting. Select the dashboard you want to view, to reload the visualizations.
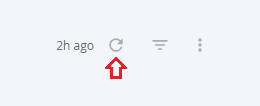
To refresh the page, click on the refresh icon on the top right, instead of the Refresh button on your browser.
Problem
No data visible on the dashboard or any other issues with the dashboard.
Solution
Click on Copy to Support Info to Clipboard button and contact support support with this information.