Machine Learning AI
About the Data
Data Refresh Frequency: At 08:00 PM (UTC-05:00 Central Time (US and Canada) daily
Displays Data for: Last 60 days
Minimum Requirements: None
Overview
This interactive dashboard allows you to view all open-source Machine Learning (ML) and Artificial Intelligence (AI) components that have been integrated with your applications in Lifecycle. You can sort or filter the AI/ML components based on the type of the algorithm they are based on. This will be helpful in understanding the existing AI/ML adoption patterns in specific business areas and predict future adoption based on the current trends.
Note
This dashboard is currently in an experimental stage.
Currently supported formats/ecosystems: PyPI, NuGet & CRAN.
This dashboard can currently detect the following categories of AI/ML algorithms or frameworks:
Framework/Algorithm Type | Definition |
|---|---|
Computer Vision | Type of AI that enables computers or systems to understand and interpret visual information from images or videos. |
Deep Learning | Subset of machine learning employing neural networks with multiple layers to learn patterns from data |
Generative AI | AI to create new, human-like content such as images, text, or code |
Machine Learning | Enabling computers to learn from existing data and make predictions or decisions without explicit programming intervention |
Model Deployment & Operations | Management and deployment of machine learning models in real-world applications |
Natural Language Processing | AI to enable machines to understand and generate natural human language |
Get to Know Your ML/AI Dashboard
Built-in Filters
AI Type: You can filter the dashboard results to narrow down on the specific type or category of the AI/ML components using the buttons in the top panel.
 |
Example: Select Generative AI to view results related to components that are based on Generative AI frameworks or tools only.
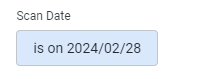
Scan Date: You can select any one of the different option available in the drop down to view results for the selected date.
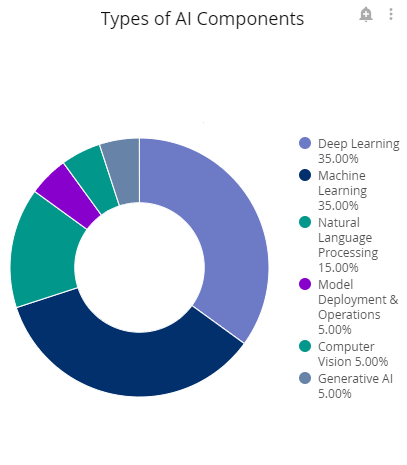
Types of AI Components
This section shows a distribution of the different types of AI components detected during Lifecycle scans.
You will be able to view the AI/ML components that are found in applications you have access to.
 |
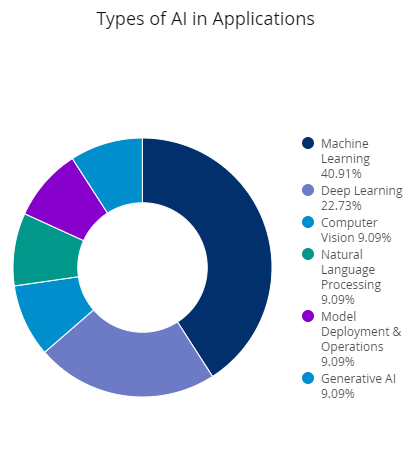
Types of AI in Applications
This section shows a distribution of the different types of AI that are in use by applications in Lifecycle.
You will be able to view the distribution based on the AI/ML components that are found in applications you have access to.
 |
Top 35 AI Components in Your Applications
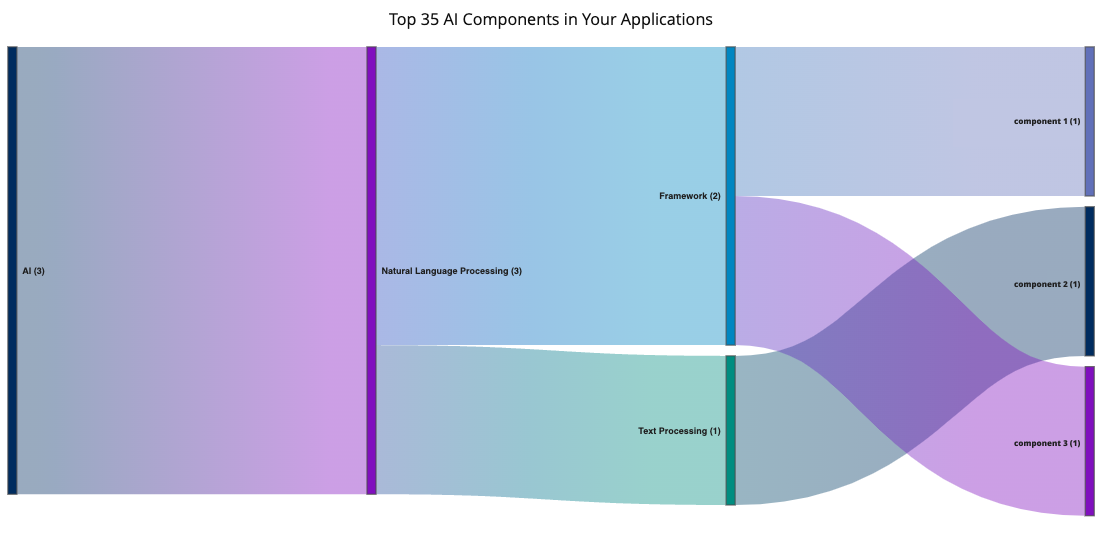
The embedded interactive Sankey chart allows you to hover over each node to view co-related details, starting from the type of the AI/ML framework to the exact name and no. of occurrences of the component being used in applications.
The chart data is based on the AI/ML components that are found in applications you have access to.
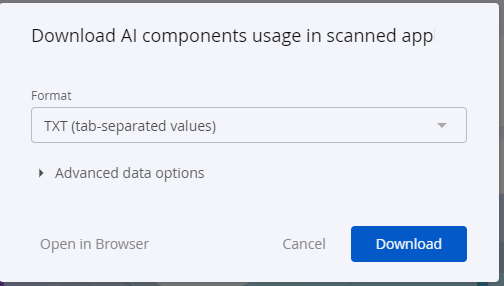
Click on the kebab (3 vertical dots) icon on right top of the Sankey chart to download the data in your preferred format. Supported formats include TXT (tab-separated values), excel (2007 or later), csv, JSON, HTML, markdown or PNG.
 |
Top 20 Functions of AI in your Applications
This section categorizes the AI components in your applications by the function they are used for. In the example below, there are 3 components implementing the Decision Trees function by your applications.
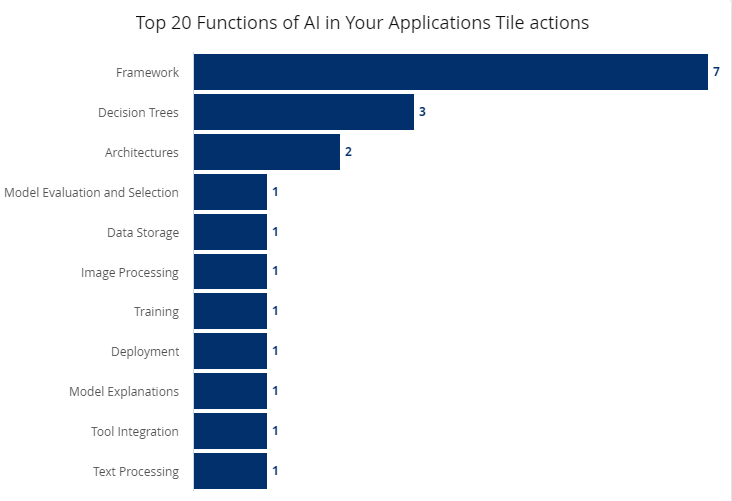 |
You will be able to view the AI/ML components that are found in applications you have access to.
The function of AI determines the behavior of the AI component. Based on the function, you can determine strategies for observability and governance as your applications move from research to production environments. This information also helps with troubleshooting, if needed.
AI components in use by each Application
This section provides a list of application names that use AI components.
You will be able to view the AI/ML components that are found in applications you have access to.
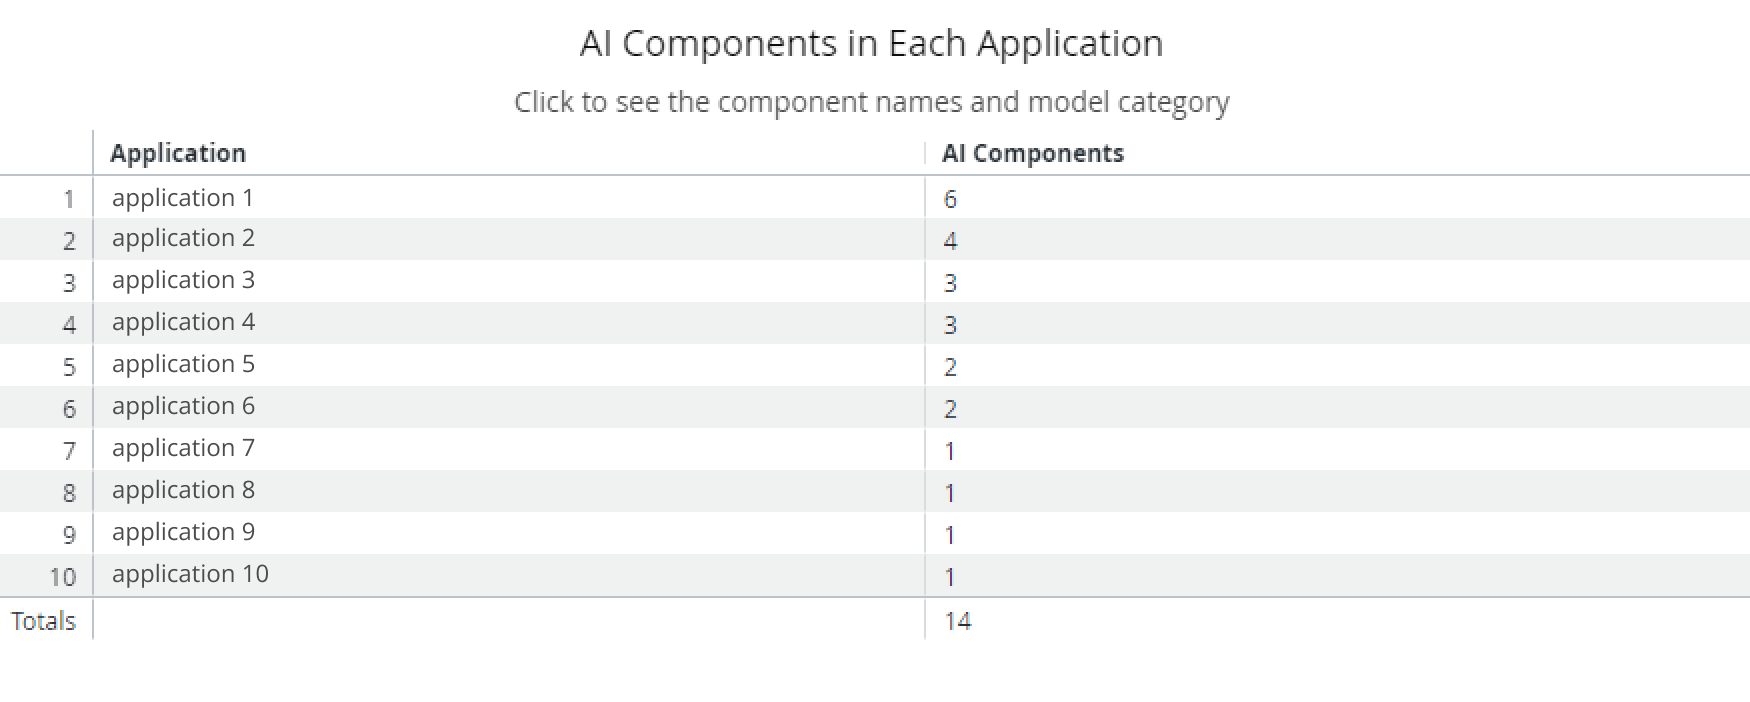
Select an application name from the list. The dashboard will refresh to display the AI component data corresponding to the selected application i.e. type of the AI/ML component, model category of the component, name of the AI components and no. of usage occurrences in the selected application.
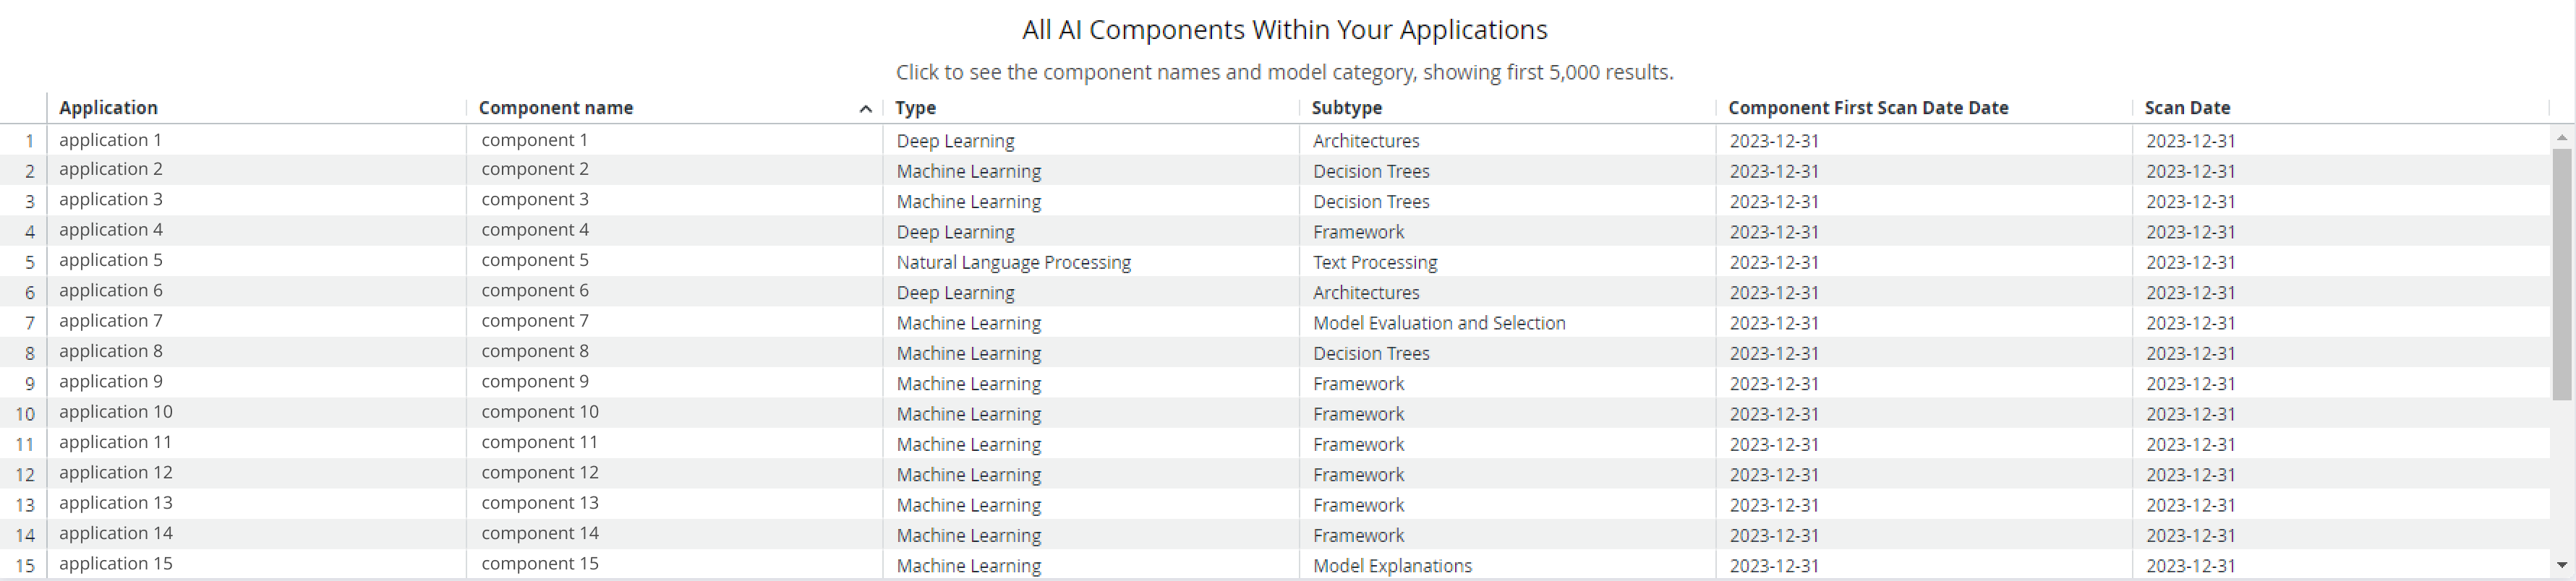
All AI Components in your Application
This section contains a detailed listing of all applications, the name of the AI component used, its type and subtype (indicating its function.)
You will be able to view the AI/ML components that are found in applications you have access to.
Additional Supported Operations
You can download the underlying data by clicking on the kebab (3 vertical dots) icon on right top corner of this dashboard.

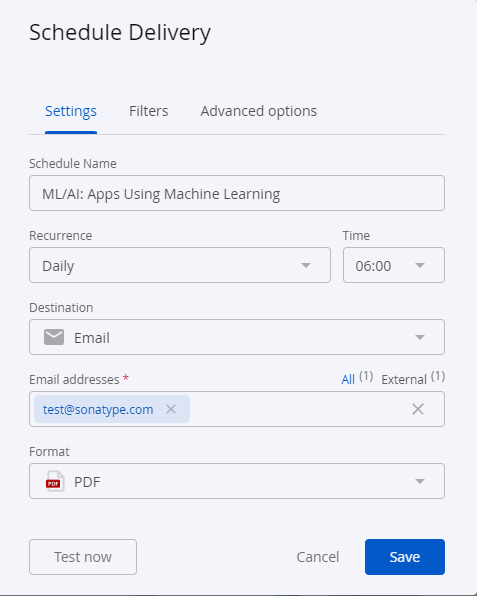
Using the option, Schedule Delivery as shown below, you can send the dashboard data to multiple email addresses in the preferred format. Supported formats include PDF, CSV or a PNG zip file. Use the Recurrence and time field to set the timing of your data delivery options.
 |
Troubleshooting
Problem
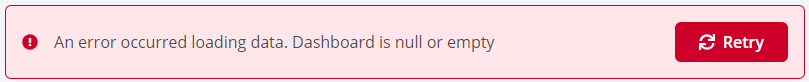
Clicking on the browser Refresh button may give you the following error:
Solution
Click the Back button on your browser, from the page where you see this error, to go back to the Landing page Enterprise Reporting. Select the dashboard you want to view, to reload the visualizations.
To refresh the page, click on the refresh icon on the top right, instead of the Refresh button on your browser.

Problem
No data visible on the dashboard or any other issues with the dashboard.
Solution
Click on Copy to Support Info to Clipboard button and contact support with this information.