Success Metrics
Sonatype Lifecycle automatically tracks statistics about its usage called Success Metrics. These statistics reflect policy evaluation, violation, and remediation, which are aggregated monthly or weekly. By following the trends in policy evaluation data, you can monitor progress toward your organization’s goals with Lifecycle. For example, an organization using Lifecycle to select safer open-source components can measure its success with the newly discovered violations' statistics. Success Metrics are available in the Lifecycle UI and through the API. The data in the UI provides visualizations out of the box while the API allows you to use your own tools to analyze data or automate data collection.
The Success Metrics data is designed to demonstrate progress toward your organization’s goal with Lifecycle. This is not designed to audit the health of an application or organization. As a result, it only includes aggregated counts of violations and general risk categories for violation counts.
Calculating Success Metrics
Success Metrics are aggregated from historical data across all stages. Sonatype Lifecycle can tell if a violation was previously identified in an earlier scan, even if that scan was in a different stage. For example, if a violation appears in both the Build stage and Release stage, Success Metrics will only count that violation one time.
The REST API returns these aggregated counts for each application over a specified time period. Sonatype Lifecycle tracks exactly when each violation is first found and when it is resolved. This is used to calculate how long the violation was opened. An average of all violation resolution times is returned as the Mean Time To Resolution (MTTR). Like with other tallies, this statistic is aggregated across all stages.
The Success Metrics UI can display data for multiple applications. To handle this, Lifecycle will total or average statistics across all applications as appropriate.
Note that as of version 189, a user must have CONFIGURE_SYSTEM permissions to create and view success metrics reports.
Risk Categories
Success Metrics groups violations into categories corresponding to their Threat Level, a subjective value placed on the perceived risk of a policy violation.
Category | Level |
|---|---|
Low | 1 |
Moderate | 2, 3 |
Severe | 4, 5, 6, 7 |
Critical | 8, 9, 10 |
Additionally, the API groups violations into several categories. These categories are defined below.
Violation Type | Definition |
|---|---|
Security | These violations are related to the Security Vulnerability Severity Score. |
License | Policy violations based on the License or License threat group for a component. |
Quality | Quality violations are based on the component's age or popularity. |
Other | These are any policy violations that do not fit into any of the other categories. |
Success Metrics in the UI
Sonatype Lifecycle can generate Success Metrics reports through the user interface. These reports are standardized and provide visualizations and derived metrics based on the Success Metrics Data. The data charts and graphs in these reports are designed to show trends in application policy violations over time allowing you to monitor progress toward your goals. The reports created through the UI can be customized to show specific applications or all organizations.
Notes on Success Metrics Reports
Success Metrics reports are generated on a per-user basis. A report created by one user is not visible to another.
Large data sets can take significant time to load the first time a report is accessed. If the report includes the most recent evaluations, every load might take time.
Administrators can turn off Success Metrics in the System Preferences menu.
Generating the Report
 |
Navigate to the Lifecycle UI.
Select Success Metrics from the navigation.
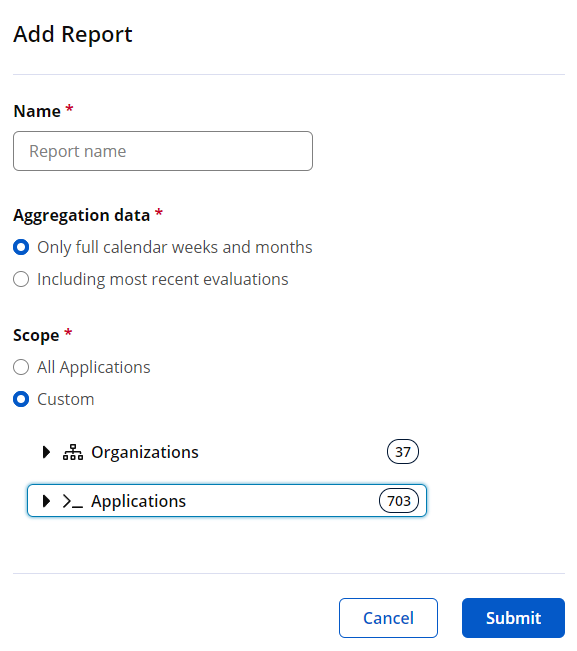
Click+ Add Report in the upper right corner of the screen.
Name the report and select options. The “Aggregation data” section allows you to specify whether to include the most recent evaluations in the report. By default, only full calendar weeks and months are included. The “Scope” section allows you to specify which applications and organizations to include in your report. By default, all applications to which you have access are included. Alternatively, you can specify a custom set of organizations and applications. Clicking on Custom will display a list of organizations and applications to which you have access.
View the report from the Success Metrics page.
Reviewing the Report
Note
Success Metrics Reports are defined on a per-user basis. A report created by one user will not be visible to others.
The resulting report has six sections, each presenting a visualization for application data.
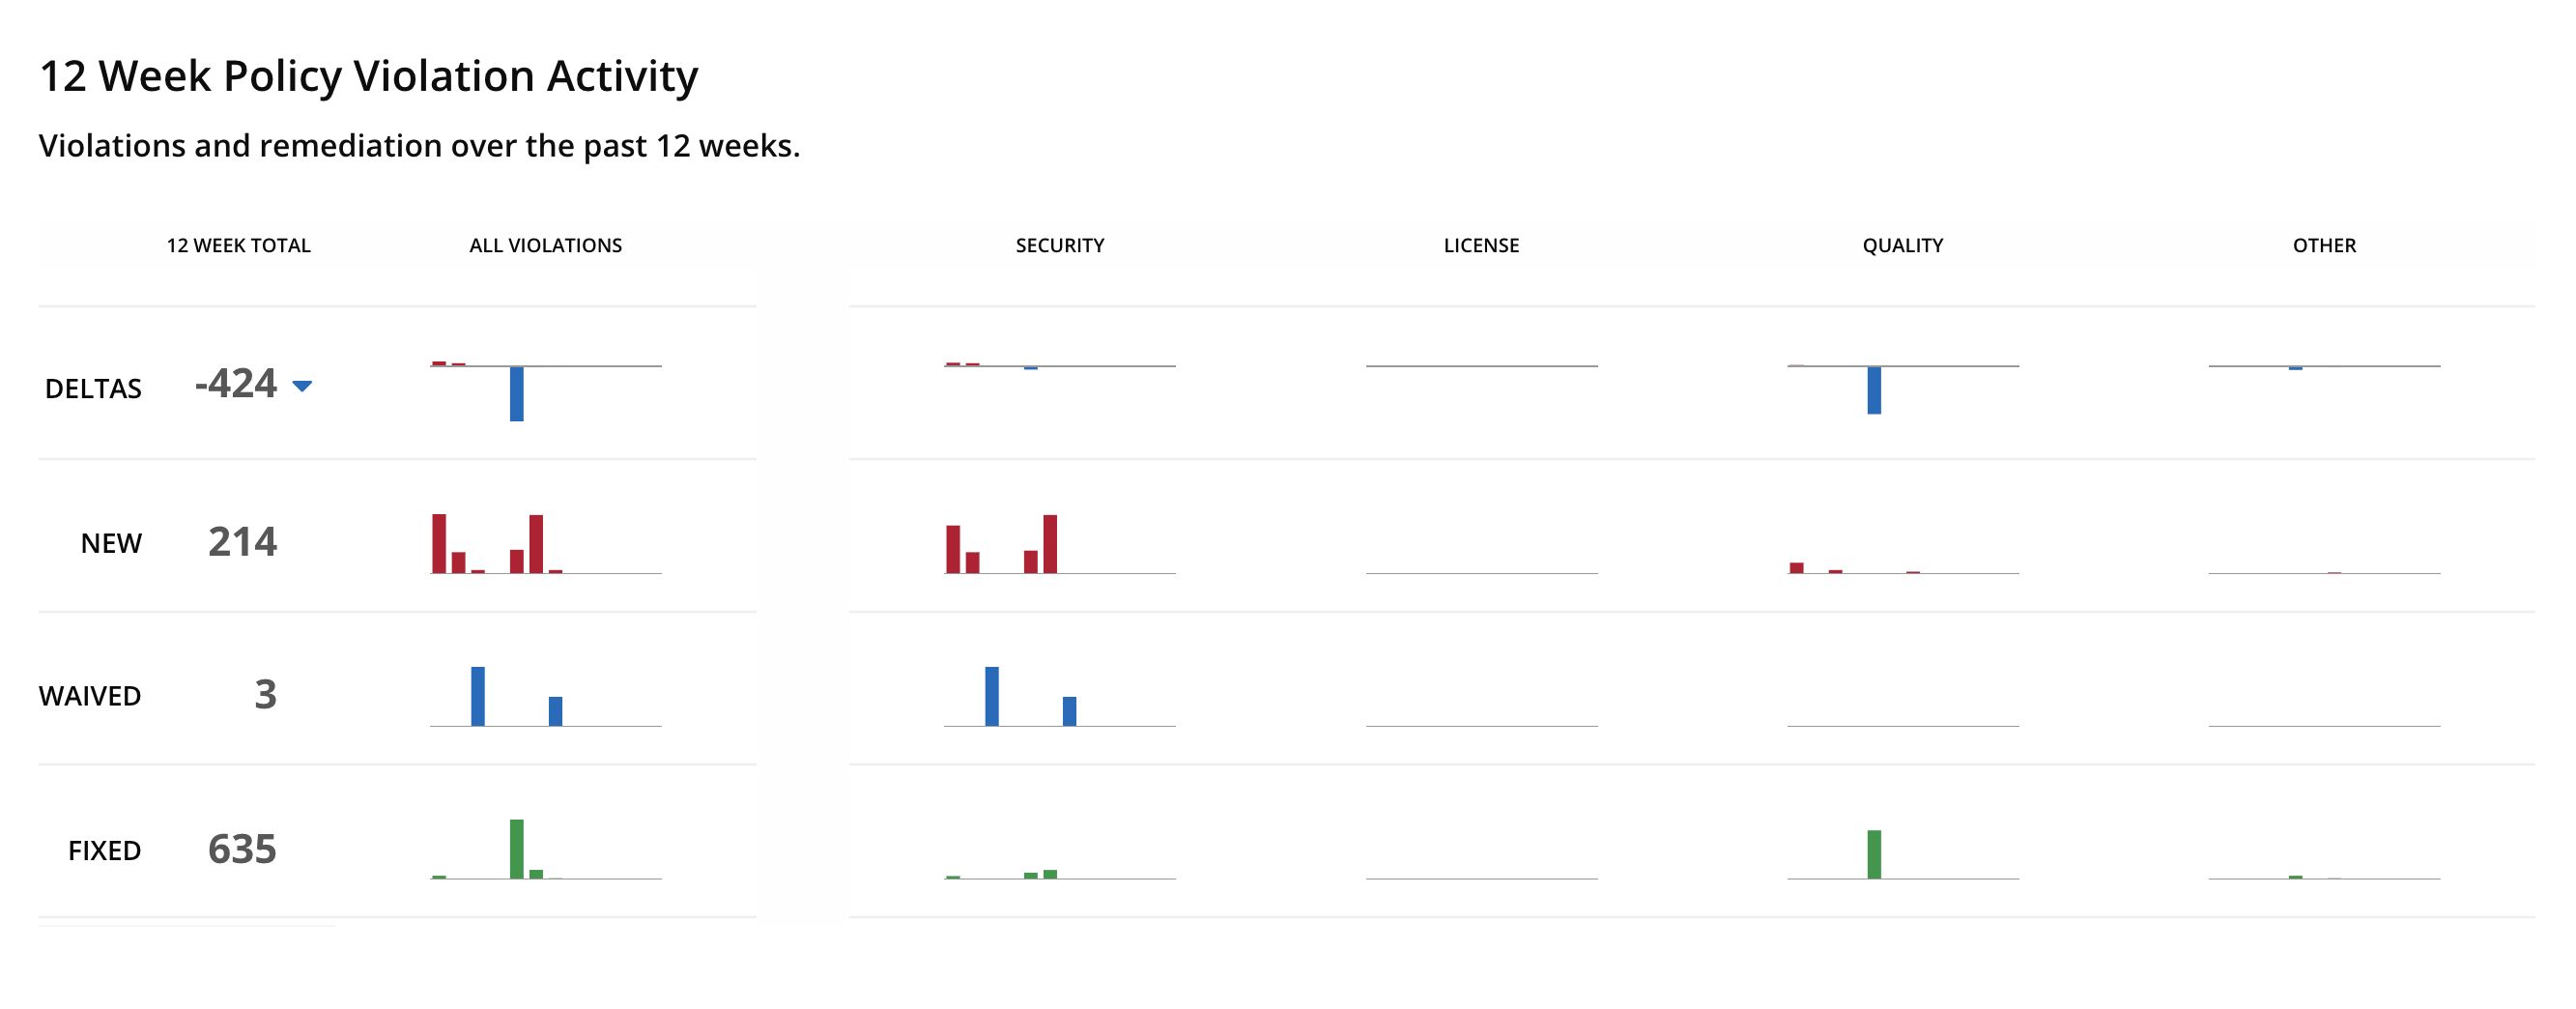
12-Week Policy Violation Activity
The 12-Week Policy Violation section shows a collection of graphs that represent all violation discovery and remediation information for the past 12 weeks. Each bar in the graph represents activity for a week. If a violation is discovered and fixed in the same week, the violation will appear in the totals for both discovered and remediated violations.
 |
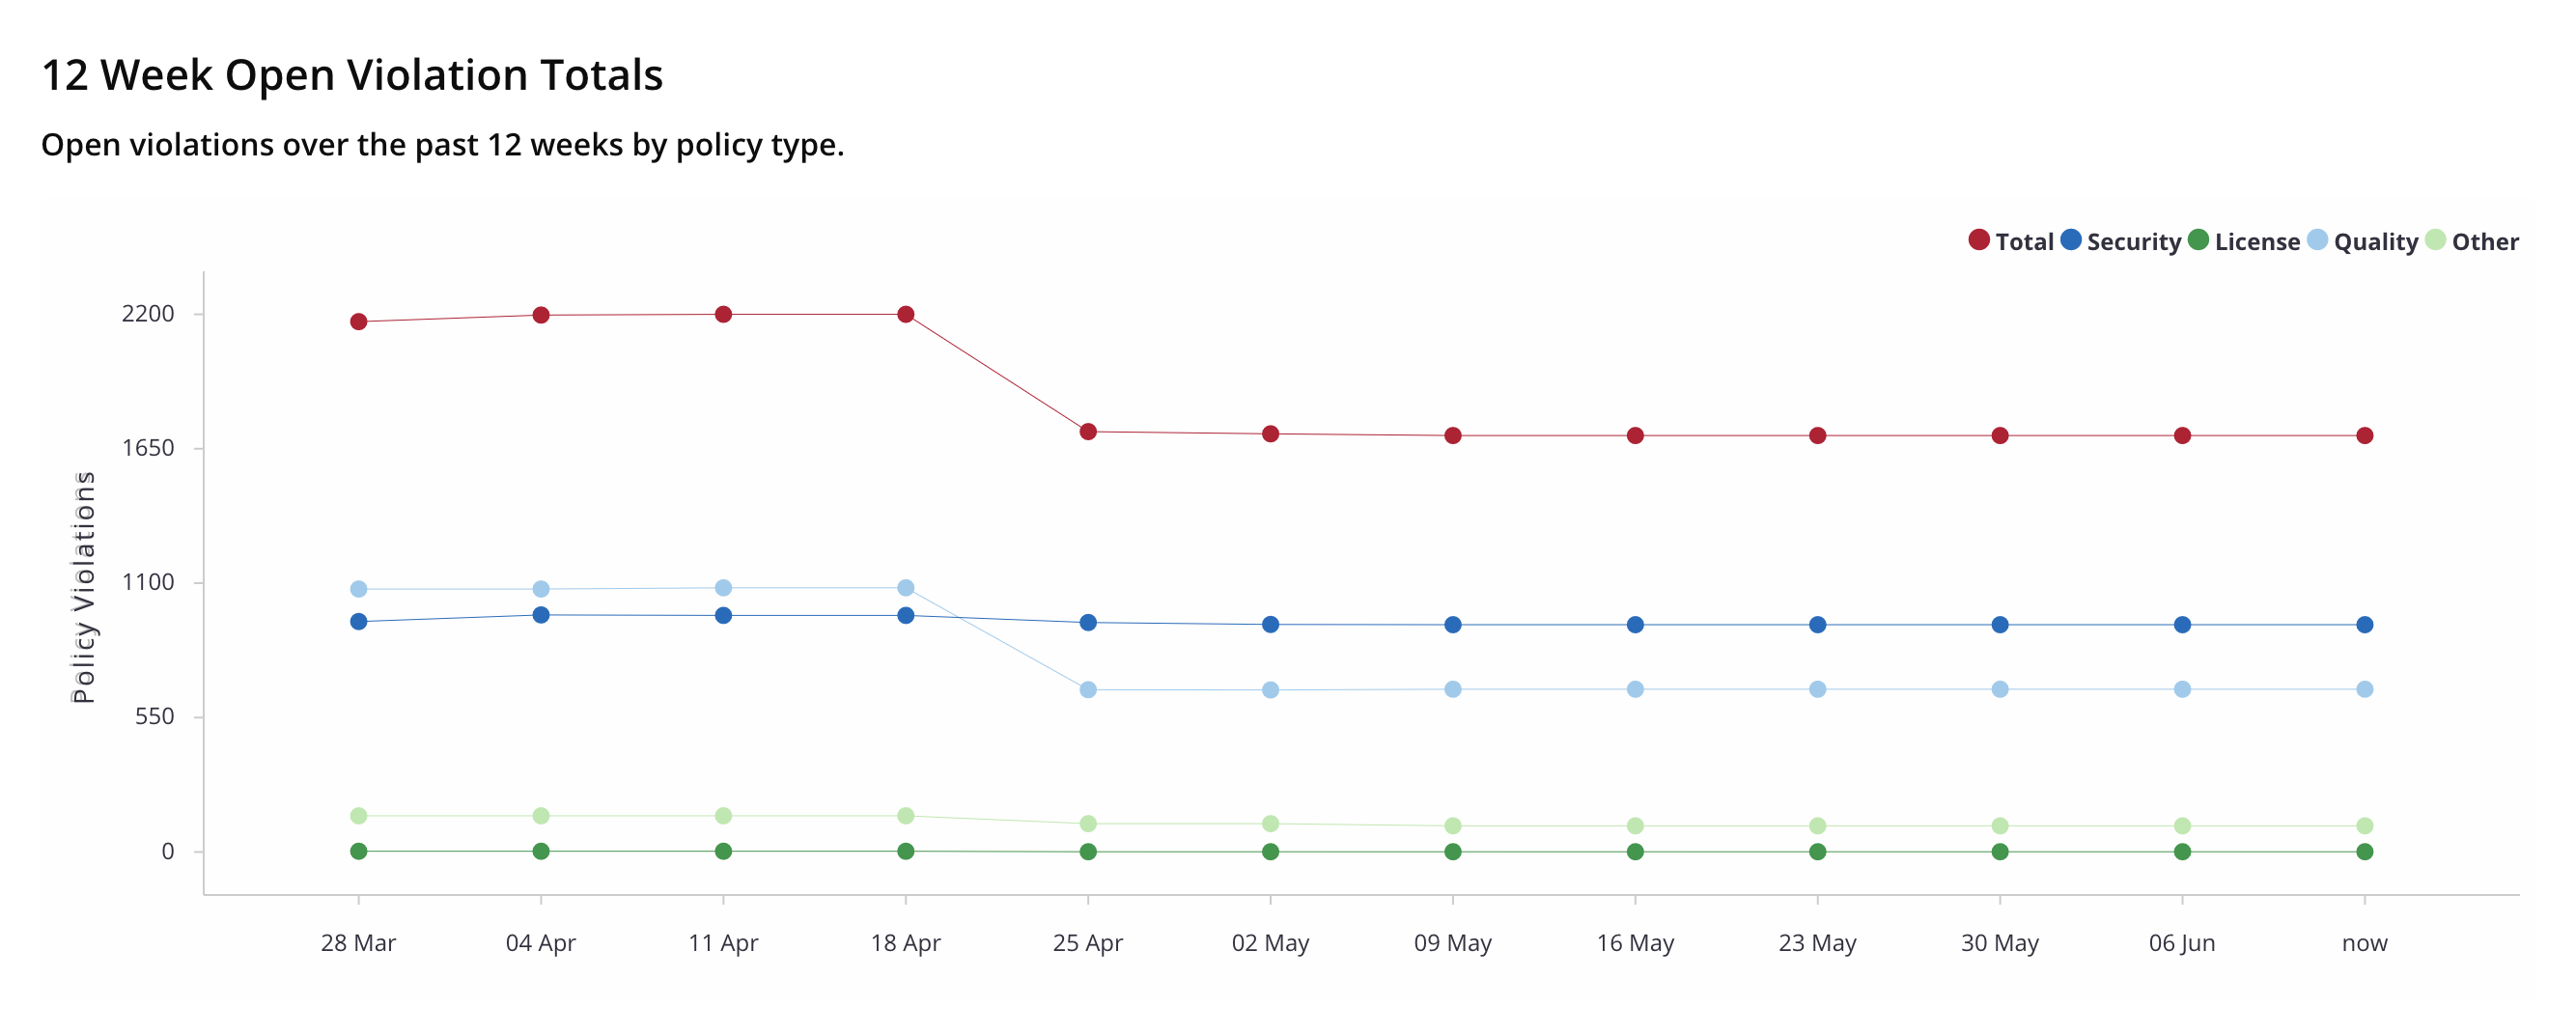
12-Week Open Violation Totals
The 12-week Open Violation Totals panel charts the number of unresolved violations for each policy type.
 |
Averages
The Averages panel displays the average number of evaluations performed each month and the average number of violations per application. The chart separates critical violations and violations by policy type. The information in this panel covers the past year.
 |
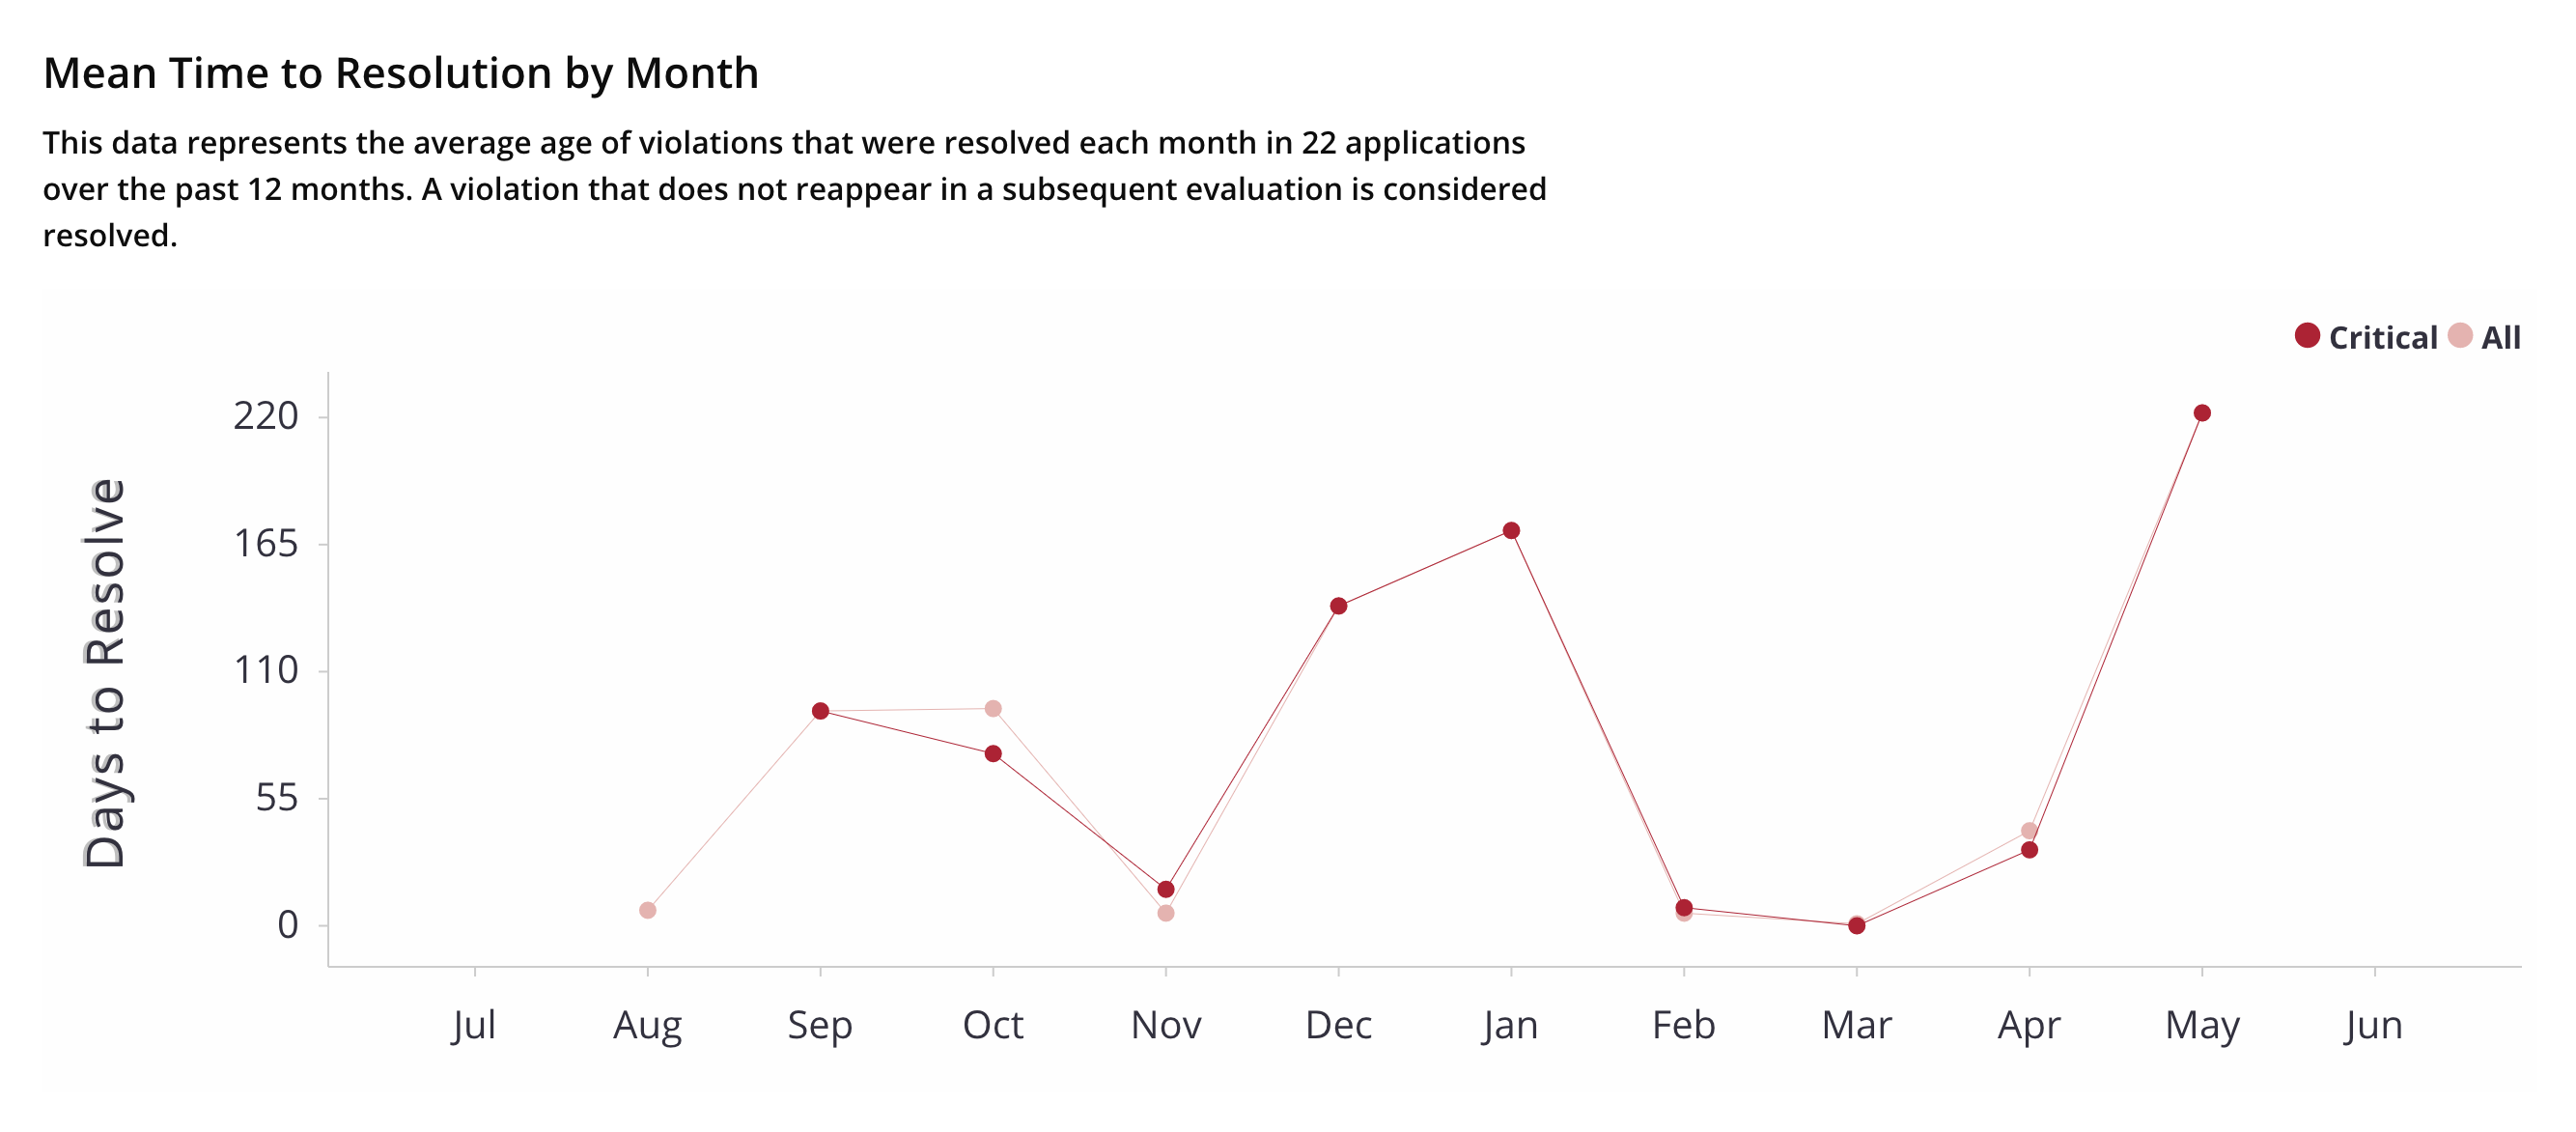
Mean Time To Resolution (MTTR) by Month
Mean Time To Resolution by Month plots the average time to resolve or waive a violation for the last year. Like the other panels, this information is broken down by policy type.
 |
Applications
The Applications panel provides statistics about the average number of violations present in each application and how many of those violations are critical. Again, this data is separated by policy type.
 |
Components
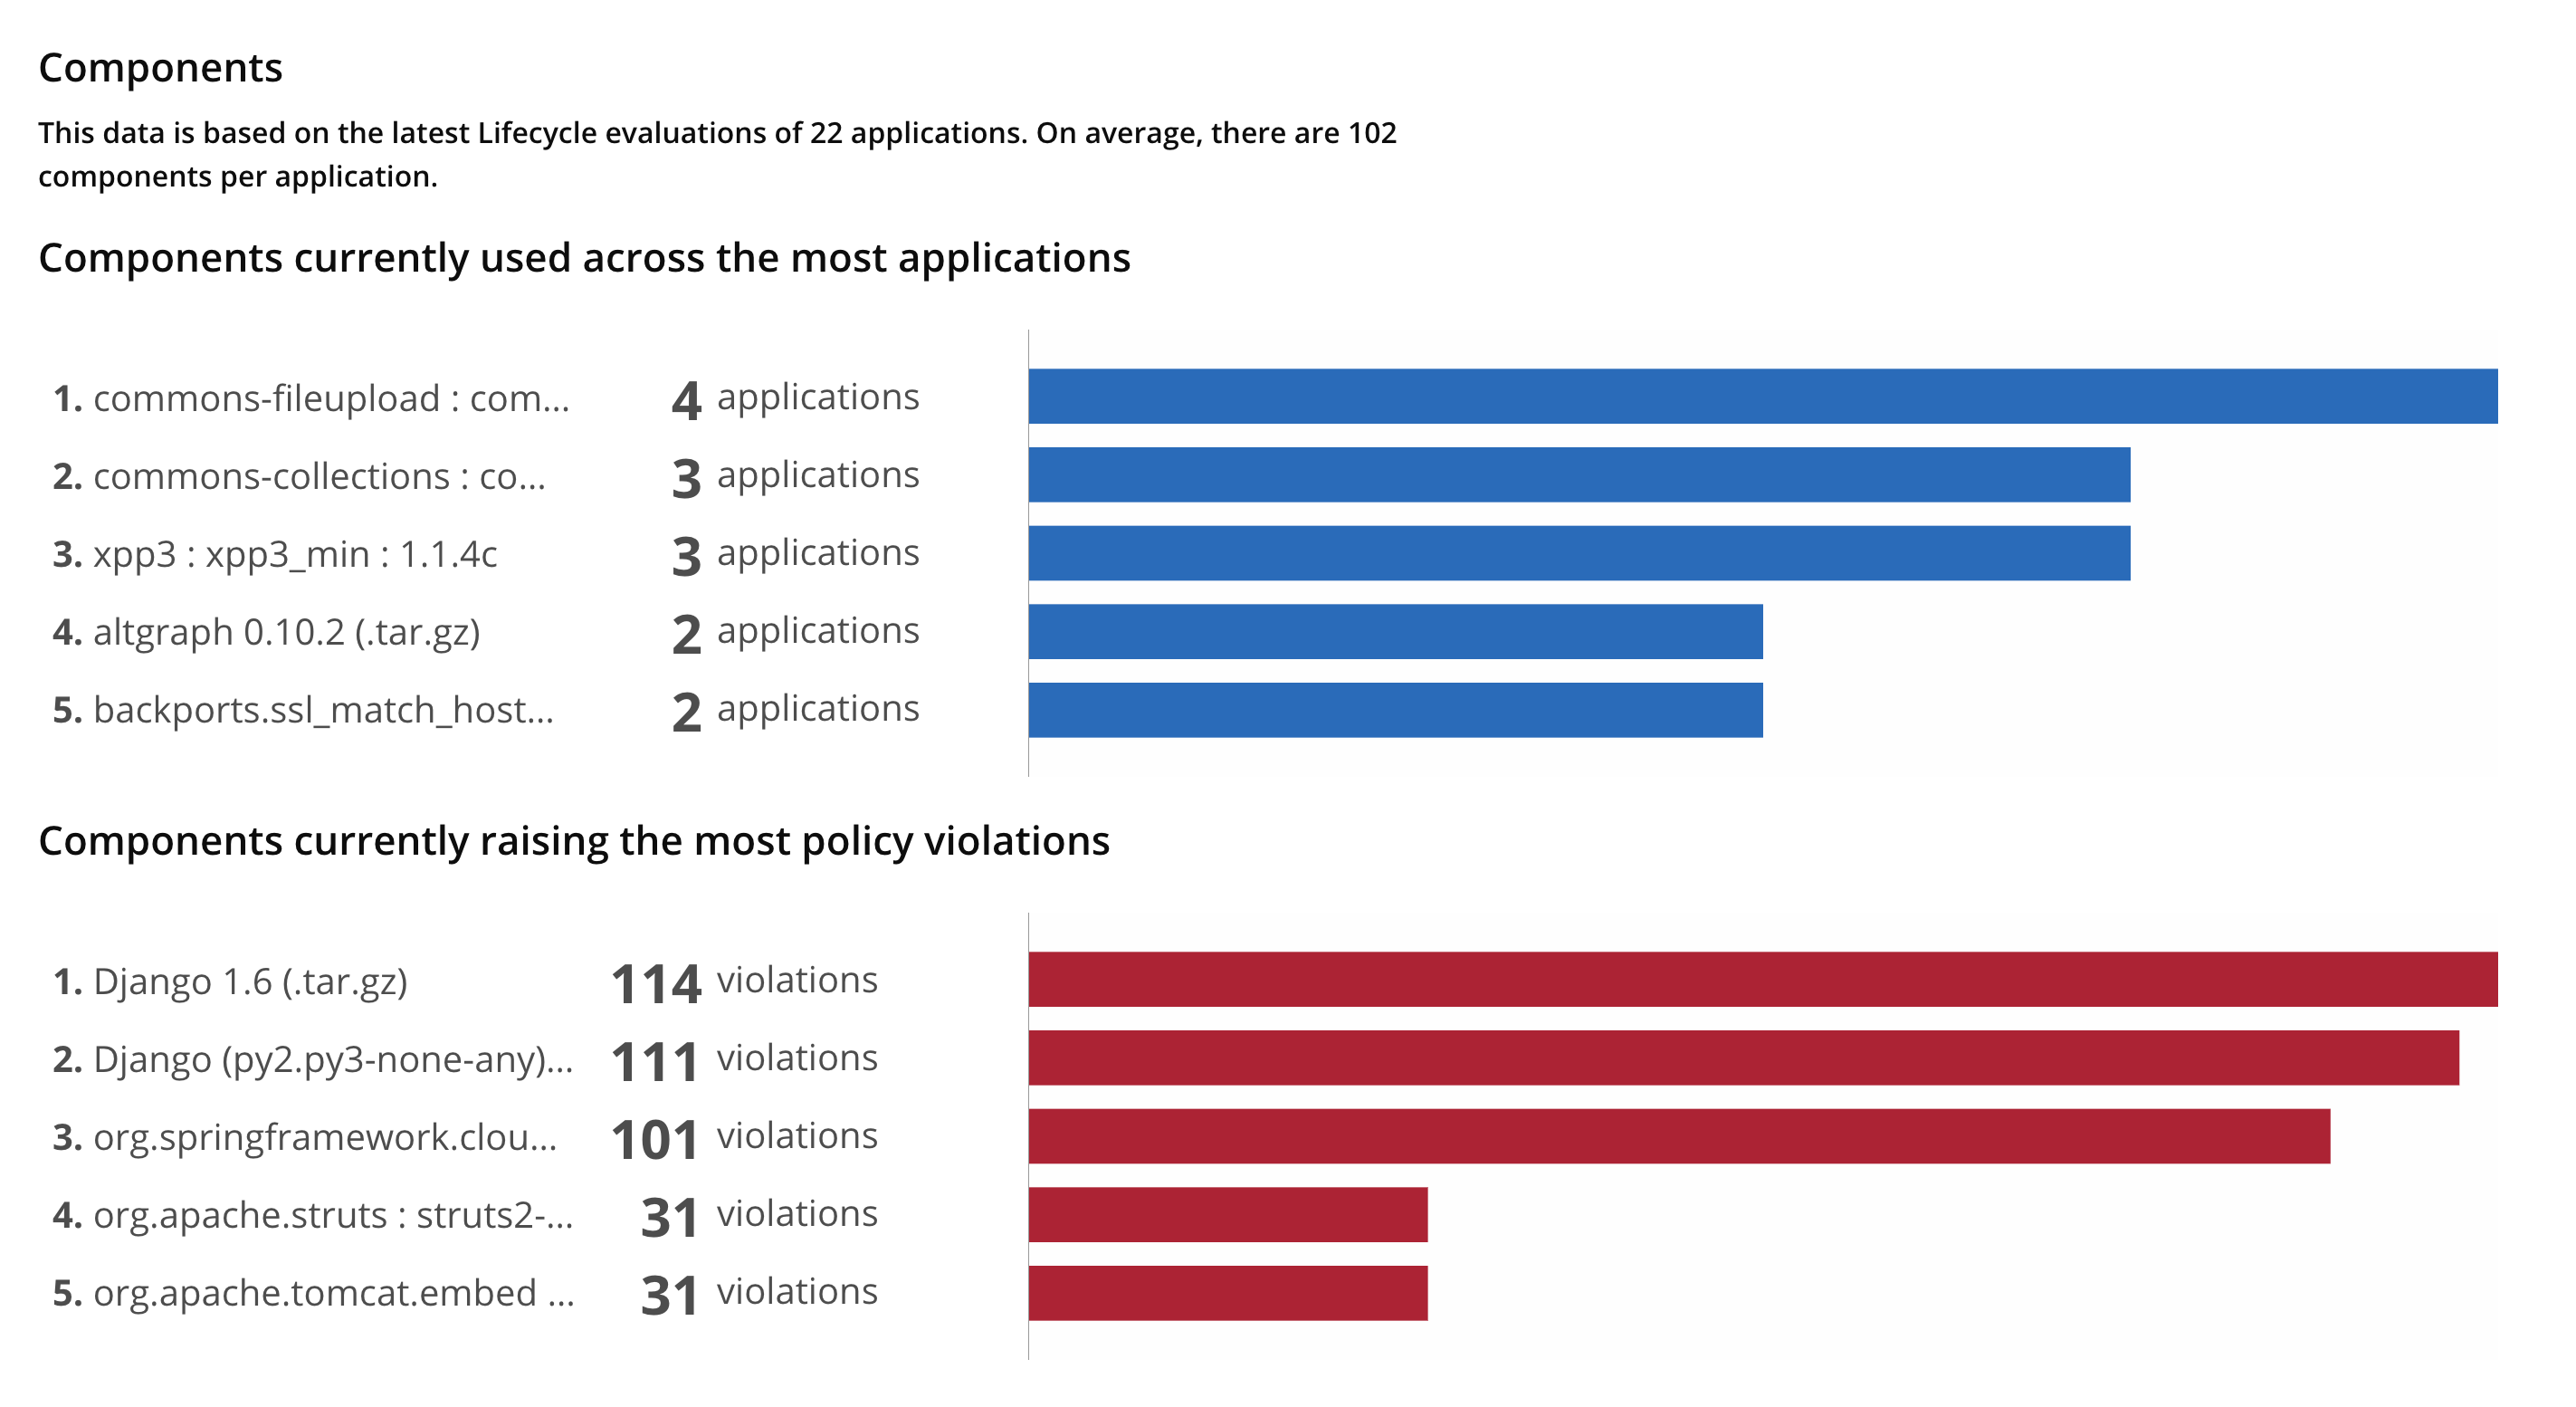
The Components panel provides statistics about the components used in each application. The chart highlights the top five most common components across all applications and the five components with the most policy violations.
 |
Success Metrics via API
Sonatype Lifecycle also provides data through a REST API. The Success Metrics API lets you retrieve data about your applications. Using the returned data, you can create custom reports or data visualizations to better measure your organization’s use of Lifecycle. The API allows you to automate data collection and quickly receive Lifecycle data. This is the same raw data used in the UI and can be fetched as either a JSON or CSV format.
Making an API Request
The Success Metrics Data API can be accessed using a POST request. The API can return data as either a JSON or CSV. The returned format is specified in the request headers along with authentication information and time period. The start and stop dates for the request accept the ISO 8601 format. In this format, the first week of the year is the week with the first Thursday in January. The annotated API request below has information about the specific values the Success Metrics API accepts.
Annotated API Request
The following is an annotated example API request using the cURL tool. An explanation of the options and values for the request is in the comment lines, indicated with a // .
Sample code for API request
curl \
    // username and password
    -u admin:admin123 \
    // Success Metrics API uses the POST method
    -X POST \
    // The content type can either be application/json or text/csv
    -H "Content-Type: application/json" \
    -d '{
    // Time period can be either "MONTH" or "WEEK"
    "timePeriod":"MONTH",
    // For MONTH requests firstTimePeriod accepts an ISO 8601 year and month without a timezone
    // For WEEK requests firstTimePeriod accepts an ISO 8601 week year and week (eg "2009-W01")
    "firstTimePeriod": "2021-01",
    // lastTimePeriod requires a date in the same format as firstTimePeriod.
    // lastTimePeriod cannot be before first time period
    // Omitting lastTimePeriod will return all successive data including partial data for current time period
    "lastTimePeriod": "2021-03",
    // applicationIds accepts an array of internal, Lifecycleassigned, IDs
    // leaving these blank will return data for all applications available to the user
    "applicationIds": [],
    "organizationIds": []
}' \
'http://localhost:8070/api/v2/reports/metrics'
API Value Reference
The tables below define the individual values returned by the Success Metrics API. The values are grouped into categories based on the kind of data returned.
Application Data
The Success Metrics API returns data for each application the user has permission to view. The following fields provide information to identify each application and its parent organization.
Field | Data Description | Data Type |
|---|---|---|
applicationId | The unique ID for each application. This is assigned by Lifecycle. | string |
applicationPublicId | The customer-assigned application ID. | string |
applicationName | The customer-assigned application name. | string |
organizationId | The unique ID for the application's parent organization. This is assigned by Lifecycle. | string |
organizationName | The customer-assigned name of the organization. | string |
timePeriodStart | This date is the beginning of the data-collection period. The returned data is aggregated weekly or monthly as specified in the API request. | ISO 8601 date |
evaluationCount | The total number of scans (evaluations) for the application during the returned timeframe. | integer |
Time to Resolution Data
The mean time to resolution statistics (MTTR) tracks the average time it took to resolve or waive a violation after it was detected. MTTR reflects the average time interval between when a violation is identified and when it is waived or remediated (upgraded, removed, etc.) The time is listed in milliseconds.
Field | Data Description | Data Type |
|---|---|---|
mttrLowThreat | Mean time to resolution for level 1 threats in milliseconds. | integer |
mttrModerateThreat | Mean time to resolution for levels 2 and 3 threats in milliseconds. | integer |
mttrSevereThreat | Mean time to resolution for levels 4-7 threats in milliseconds. | integer |
mttrCriticalThreat | Mean time to resolution for levels 8-10 threats in milliseconds. | integer |
Threat Discovery Data
Field | Data Description | Data Type |
|---|---|---|
discoveredCountSecurityLow | The number of newly discovered low-level security threats in the time period. | integer |
discoveredCountSecurityModerate | The number of newly discovered moderate-level security threats in the time period. | integer |
discoveredCountSecuritySevere | The number of newly discovered severe-level security threats in the time period. | integer |
discoveredCountSecurityCritical | The number of newly discovered critical-level security threats in the time period. | integer |
discoveredCountLicenseLow | The number of newly discovered low-level license threats in the time period. | integer |
discoveredCountLicenseModerate | The number of newly discovered moderate-level license threats in the time period. | integer |
discoveredCountLicenseSevere | The number of newly discovered severe-level license threats in the time period. | integer |
discoveredCountLicenseCritical | The number of newly discovered critical-level license threats in the time period. | integer |
discoveredCountQualityLow | The number of newly discovered low-level quality threats in the time period. | integer |
discoveredCountQualityModerate | The number of newly discovered moderate-level quality threats in the time period. | integer |
discoveredCountQualitySevere | The number of newly discovered severe-level quality threats in the time period. | integer |
discoveredCountQualityCritical | The number of newly discovered critical-level quality threats in the time period. | integer |
discoveredCountOtherLow | The number of newly discovered low-level other threats in the time period. | integer |
discoveredCountOtherModerate | The number of newly discovered moderate-level other threats in the time period. | integer |
discoveredCountOtherSevere | The number of newly discovered severe-level other threats in the time period. | integer |
discoveredCountOtherCritical | The number of newly discovered critical-level other threats in the time period. | integer |
Policy Remediation Data
Field | Data Description | Data Type |
|---|---|---|
fixedCountSecurityLow | The number of low-level security violations fixed in the time period. | integer |
fixedCountSecurityModerate | The number of moderate-level security violations fixed in the time period. | integer |
fixedCountSecuritySevere | The number of severe-level security violations fixed in the time period. | integer |
fixedCountSecurityCritical | The number of critical-level security violations fixed in the time period. | integer |
fixedCountLicenseLow | The number of low-level license violations fixed in the time period. | integer |
fixedCountLicenseModerate | The number of moderate-level license violations fixed in the time period. | integer |
fixedCountLicenseSevere | The number of severe-level license violations fixed in the time period. | integer |
fixedCountLicenseCritical | The number of critical-level license violations fixed in the time period. | integer |
fixedCountQualityLow | The number of low-level quality violations fixed in the time period. | integer |
fixedCountQualityModerate | The number of moderate-level quality violations fixed in the time period. | integer |
fixedCountQualitySevere | The number of severe-level quality violations fixed in the time period. | integer |
fixedCountQualityCritical | The number of critical-level quality violations fixed in the time period. | integer |
fixedCountOtherLow | The number of low-level other violations fixed in the time period. | integer |
fixedCountOtherModerate | The number of moderate-level other violations fixed in the time period. | integer |
fixedCountOtherSevere | The number of severe-level other violations fixed in the time period. | integer |
fixedCountOtherCritical | The number of critical-level other violations fixed in the time period. | integer |
Waived Violation Data
Field | Data Description | Data Type |
|---|---|---|
waivedCountSecurityLow | The number of low-level security violations waived in the specified time period. | integer |
waivedCountSecurityModerate | The number of moderate-level security violations waived in the specified time period. | integer |
waivedCountSecuritySevere | The number of severe-level security violations waived in the specified time period. | integer |
waivedCountSecurityCritical | The number of critical-level security violations waived in the specified time period. | integer |
waivedCountLicenseLow | The number of low-level license violations waived in the specified time period. | integer |
waivedCountLicenseModerate | The number of moderate-level license violations waived in the specified time period. | integer |
waivedCountLicenseSevere | The number of severe-level license violations waived in the specified time period. | integer |
waivedCountLicenseCritical | The number of critical-level license violations waived in the specified time period. | integer |
waivedCountQualityLow | The number of low-level quality violations waived in the specified time period. | integer |
waivedCountQualityModerate | The number of moderate-level quality violations waived in the specified time period. | integer |
waivedCountQualitySevere | The number of severe-level quality violations waived in the specified time period. | integer |
waivedCountQualityCritical | The number of critical-level quality violations waived in the specified time period. | integer |
waivedCountOtherLow | The number of low-level other violations waived in the specified time period. | integer |
waivedCountOtherModerate | The number of moderate-level other violations waived in the specified time period. | integer |
waivedCountOtherSevere | The number of severe-level other violations waived in the specified time period. | integer |
waivedCountOtherCritical | The number of critical-level other violations waived in the specified time period. | integer |
Open Data
Note: Violations that are Legacy Violations or have been waived are not considered open violations and will not appear as the results of these API calls.
Field | Data Description | Data Type |
|---|---|---|
openCountAtTimePeriodEndSecurityLow | The number of unresolved low-level security threats at the end of the time period. | integer |
openCountAtTimePeriodEndSecurityModerate | The number of unresolved moderate-level security threats at the end of the time period. | integer |
openCountAtTimePeriodEndSecuritySevere | The number of unresolved severe-level security threats at the end of the time period. | integer |
openCountAtTimePeriodEndSecurityCritical | The number of unresolved critical-level security threats at the end of the time period. | integer |
openCountAtTimePeriodEndLicenseLow | The number of unresolved low-level license threats at the end of the time period. | integer |
openCountAtTimePeriodEndLicenseModerate | The number of unresolved moderate-level license threats at the end of the time period. | integer |
openCountAtTimePeriodEndLicenseSevere | The number of unresolved severe-level license threats at the end of the time period. | integer |
openCountAtTimePeriodEndLicenseCritical | The number of unresolved critical-level license threats at the end of the time period. | integer |
openCountAtTimePeriodEndQualityLow | The number of unresolved low-level quality threats at the end of the time period. | integer |
openCountAtTimePeriodEndQualityModerate | The number of unresolved moderate-level quality threats at the end of the time period. | integer |
openCountAtTimePeriodEndQualitySevere | The number of unresolved severe-level quality threats at the end of the time period. | integer |
openCountAtTimePeriodEndQualityCritical | The number of unresolved critical-level quality threats at the end of the time period. | integer |
openCountAtTimePeriodEndOtherLow | The number of unresolved low-level other threats at the end of the time period. | integer |
openCountAtTimePeriodEndOtherModerate | The number of unresolved moderate other-level threats at the end of the time period. | integer |
openCountAtTimePeriodEndOtherSevere | The number of unresolved severe-level other threats at the end of the time period. | integer |
openCountAtTimePeriodEndOtherCritical | The number of unresolved critical-level other threats at the end of the time period. | integer |
Limiting Success Metrics to a Stage
By default, the violation data for all eligible states is used to generate Success Metrics. You can limit Success Metrics to a single stage, by specifying the stageId.
Using the Configuration REST API, set the value of the property successMetricsStageId to the desired stage. Allowed stages are:
source
build
stage-release
release
operate
Success metrics data will be retrieved only for those stages which the IQ instance is licensed for.
Limiting the Success Metrics to a single stage will only apply to future aggregations, from the time the change was made. It will not be applicable for success metrics aggregations generated previously.
Disabling Success Metrics
Success Metrics can be disabled by an administrator in the Lifecycle UI:
Click on the System Preferences cog in the upper right part of the screen.
Select Success Metrics from the dropdown menu and toggle to either enable or disable them.
Click Update to save your changes.
 |
Additional Resources
Success Metrics is a powerful tool to track progress toward goals with Sonatype Lifecycle. The UI provides visualizations and reports while the API provides customizable data and allows you to retrieve data for use with your own tools.
Additionally, the Success Metrics Community Project provides a simple web application for viewing Success Metrics and creating PDF reports. This tool is not supported by Sonatype. The following are Sonatype resources for Success Metrics: