Rolling Recap Dashboard
About the Data
Data Refresh Frequency: At 12:00 AM UTC, on day 2 of the month
Displays Data for: Last 365 days
Minimum Requirements: Data for at least 30 days is required for meaningful metrics.
Overview
Rolling Recap offers intuitive graphical representations of the State of the Software Supply Chain for your organization. It unlocks trends and patterns by comparing your usage of Sonatype Lifecycle with the rest of the industry over the last 365 days.
This is where you can view the current vulnerability risk associated with your applications, the tech stack diversity showing the different components of varied ecosystems found and analyzed by Lifecycle and the efficiency of your teams in fixing the top vulnerabilities.
Get to Know Your Rolling Recap Dashboard
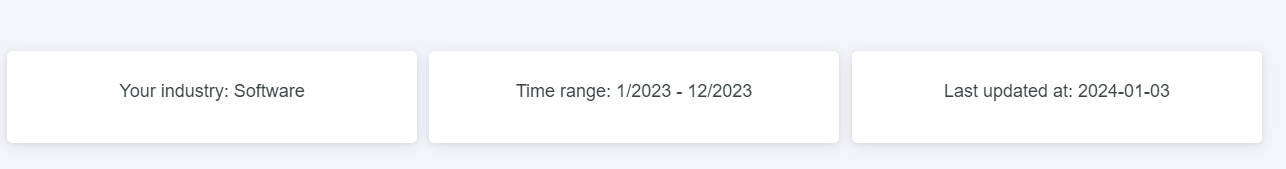
The dashboard indicates the time range and last updated date for the visualizations on this page. Data on this page is updated every month.
 |
The Overview section
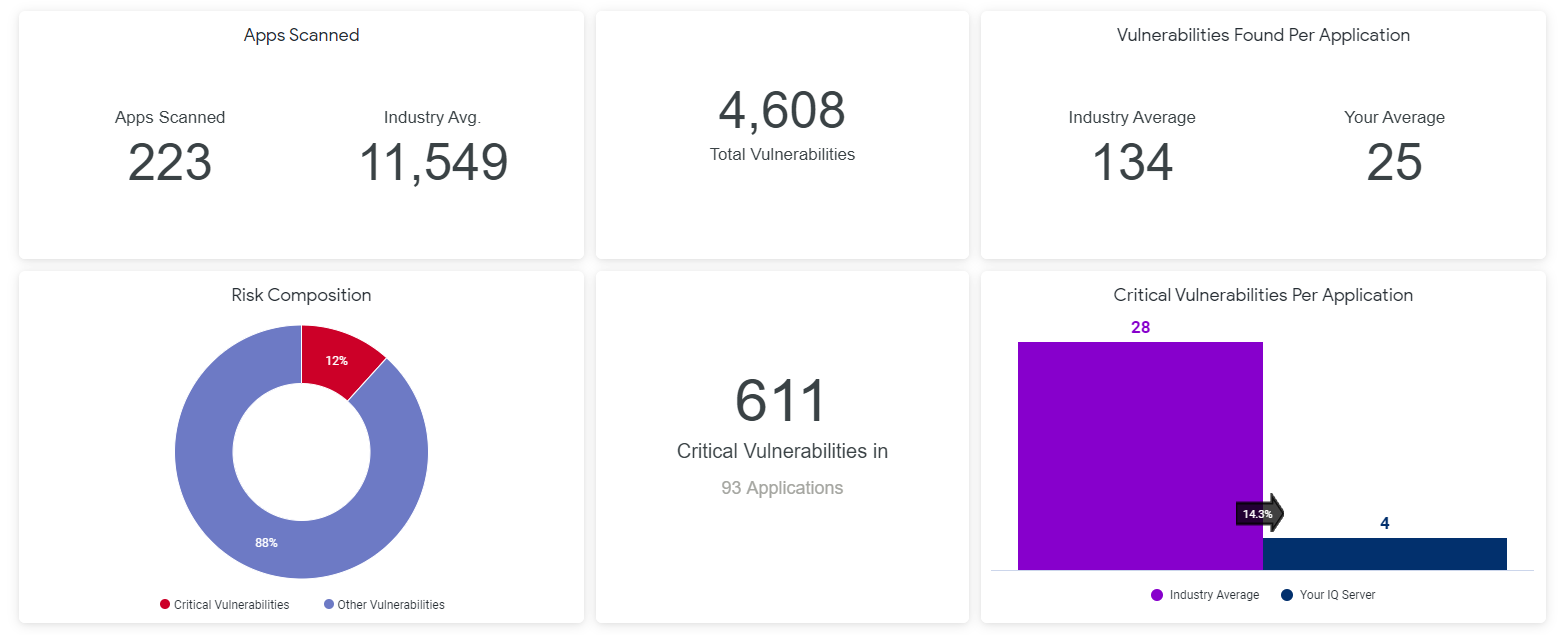 |
The Apps Scanned section shows the total number of applications scanned and the number of vulnerabilities detected by Sonatype Lifecycle during the year. You can view the total no. of vulnerabilities detected by Lifecycle and an average breakdown of vulnerabilities per application. The industry average comparison will give you an idea of your vulnerability profile as compared to your peers.
The Risk Composition chart highlights the volume of critical vulnerabilities (CVSS scores >=8) as compared to other vulnerabilities. This helps you plan or expedite efforts to remediate the critical vulnerabilities.
Environment section
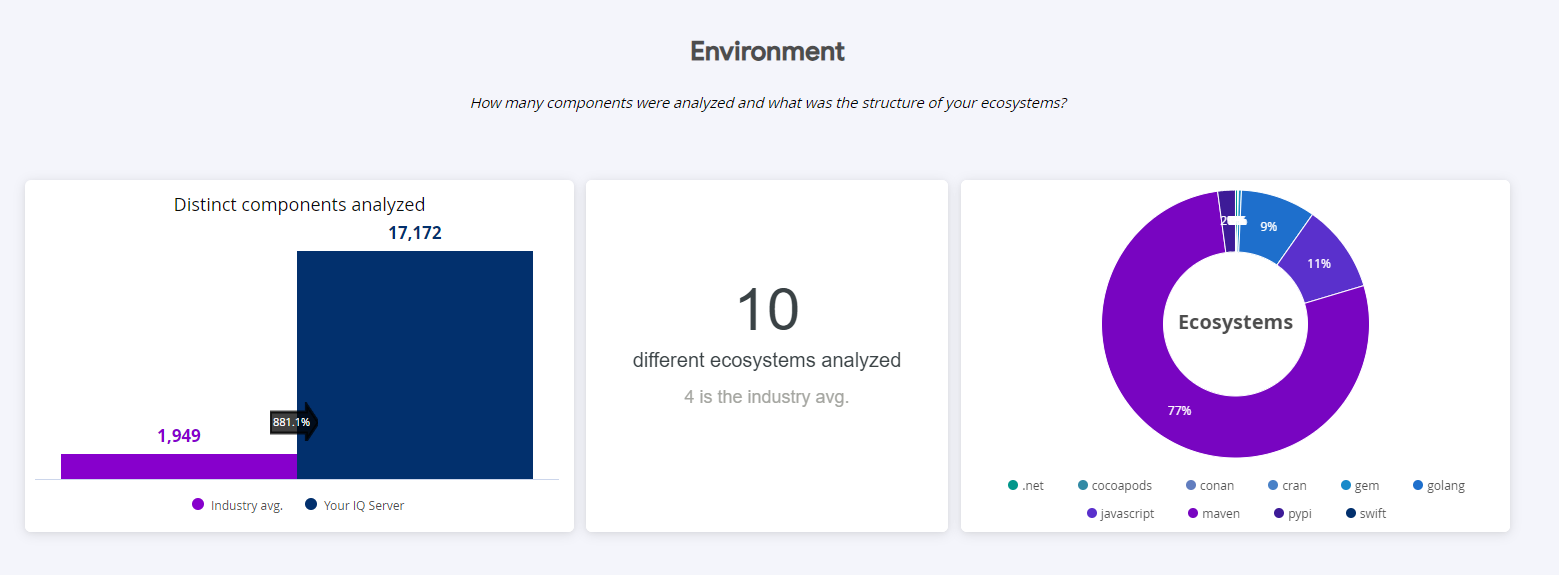 |
This section shows the volume and variety (ecosystems) of components analyzed in the last 365 days. It indicates the thoroughness of scans carried out by your installation of Sonatype Lifecycle. The industry comparison provides awareness of similar efforts by your peers.
Efficiency section
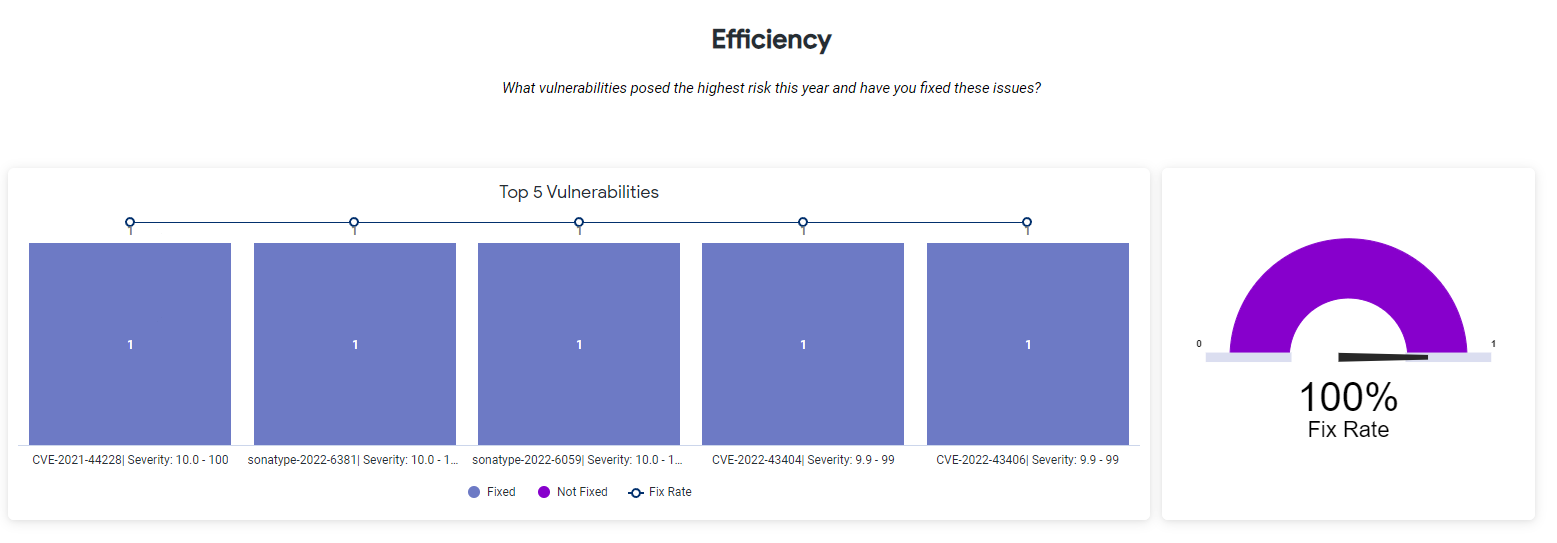 |
This section shows the top 5 CVEs (Common Vulnerabilities and Exposures) that were fixed. Vulnerabilities include publicly disclosed vulnerabilities in the NVD (National Vulnerability Database) and Sonatype-discovered vulnerabilities. The graph displayed in this section indicates the magnitude of impact Sonatype Lifecycle has on securing your DevSecOps pipelines.
Diversity section
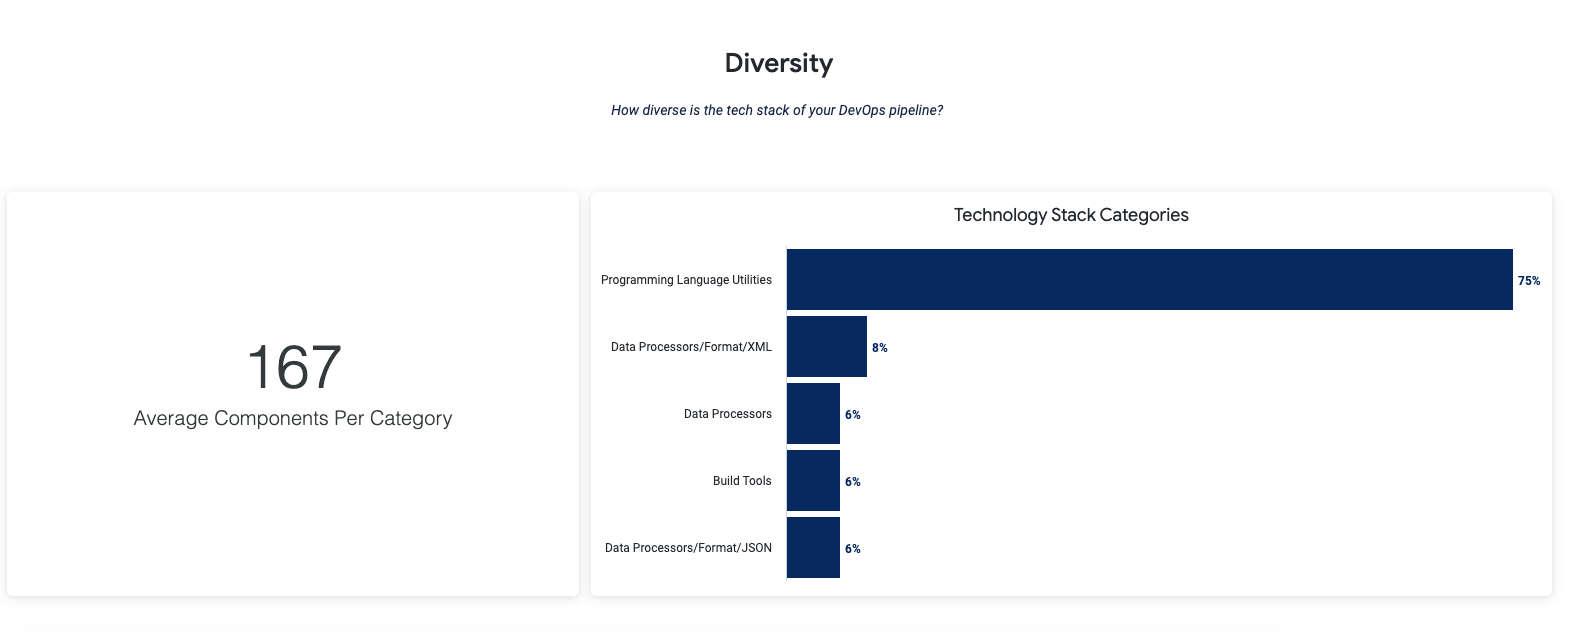 |
This displays the variety of programming languages, frameworks, databases, front-end tools, back-end tools, and applications connected by APIs, platforms, etc. that are currently used in your DevSecOps pipelines. The higher the tech stack diversity, the higher the security risk, dependency management, and integration efforts. Data presented here can be used to reduce these risks by standardizing your technology stack. A standardized technology stack is also conducive to more code reuse and collaboration across different teams in your organization.
Assumptions and Constraints
Assumptions and constraints for the data sets used for this analysis are listed below:
Policy waivers are not considered.
Vulnerabilities discovered and fixed on the same day are not included in the analysis, due to aggregation.
Applications must have been evaluated at least 3 times, from the same instance of Sonatype Lifecycle, to be included in the analysis. This eliminates duplicity in application counts due to container scans.
Vulnerabilities having a CVSS score >=8, are considered "critical" in the analysis.
Additional Supported Operations
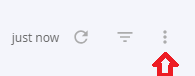
You can download the underlying data by clicking on the kebab (3 vertical dots) icon on right top corner of this dashboard.
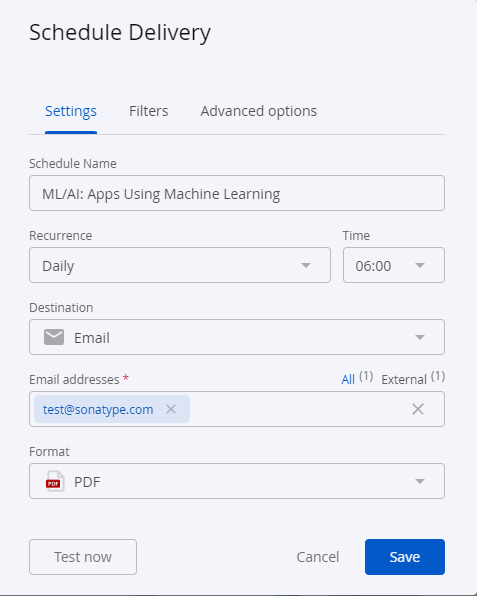
Using the option, Schedule Delivery as shown below, you can send the dashboard data to multiple email addresses in the preferred format. Supported formats include PDF, CSV or a PNG zip file. Use the Recurrence and time field to set the timing of your data delivery options.
 |
Troubleshooting
Problem
Clicking on the browser Refresh button may give you the following error:
Solution
Click the Back button on your browser, from the page where you see this error, to go back to the Landing page Enterprise Reporting. Select the dashboard you want to view, to reload the visualizations.
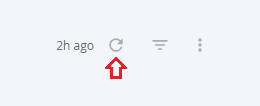
To refresh the page, click on the refresh icon on the top right, instead of the Refresh button on your browser.
Problem
No data visible on the dashboard or any other issues with the dashboard.
Solution
Click on Copy to Support Info to Clipboard button and contact support with this information.