Firewall Dashboard
The Firewall dashboard displays a summary of Firewall operations and the components in quarantine. These results are sorted by the most recently quarantined component and may be filtered using the summary metrics.
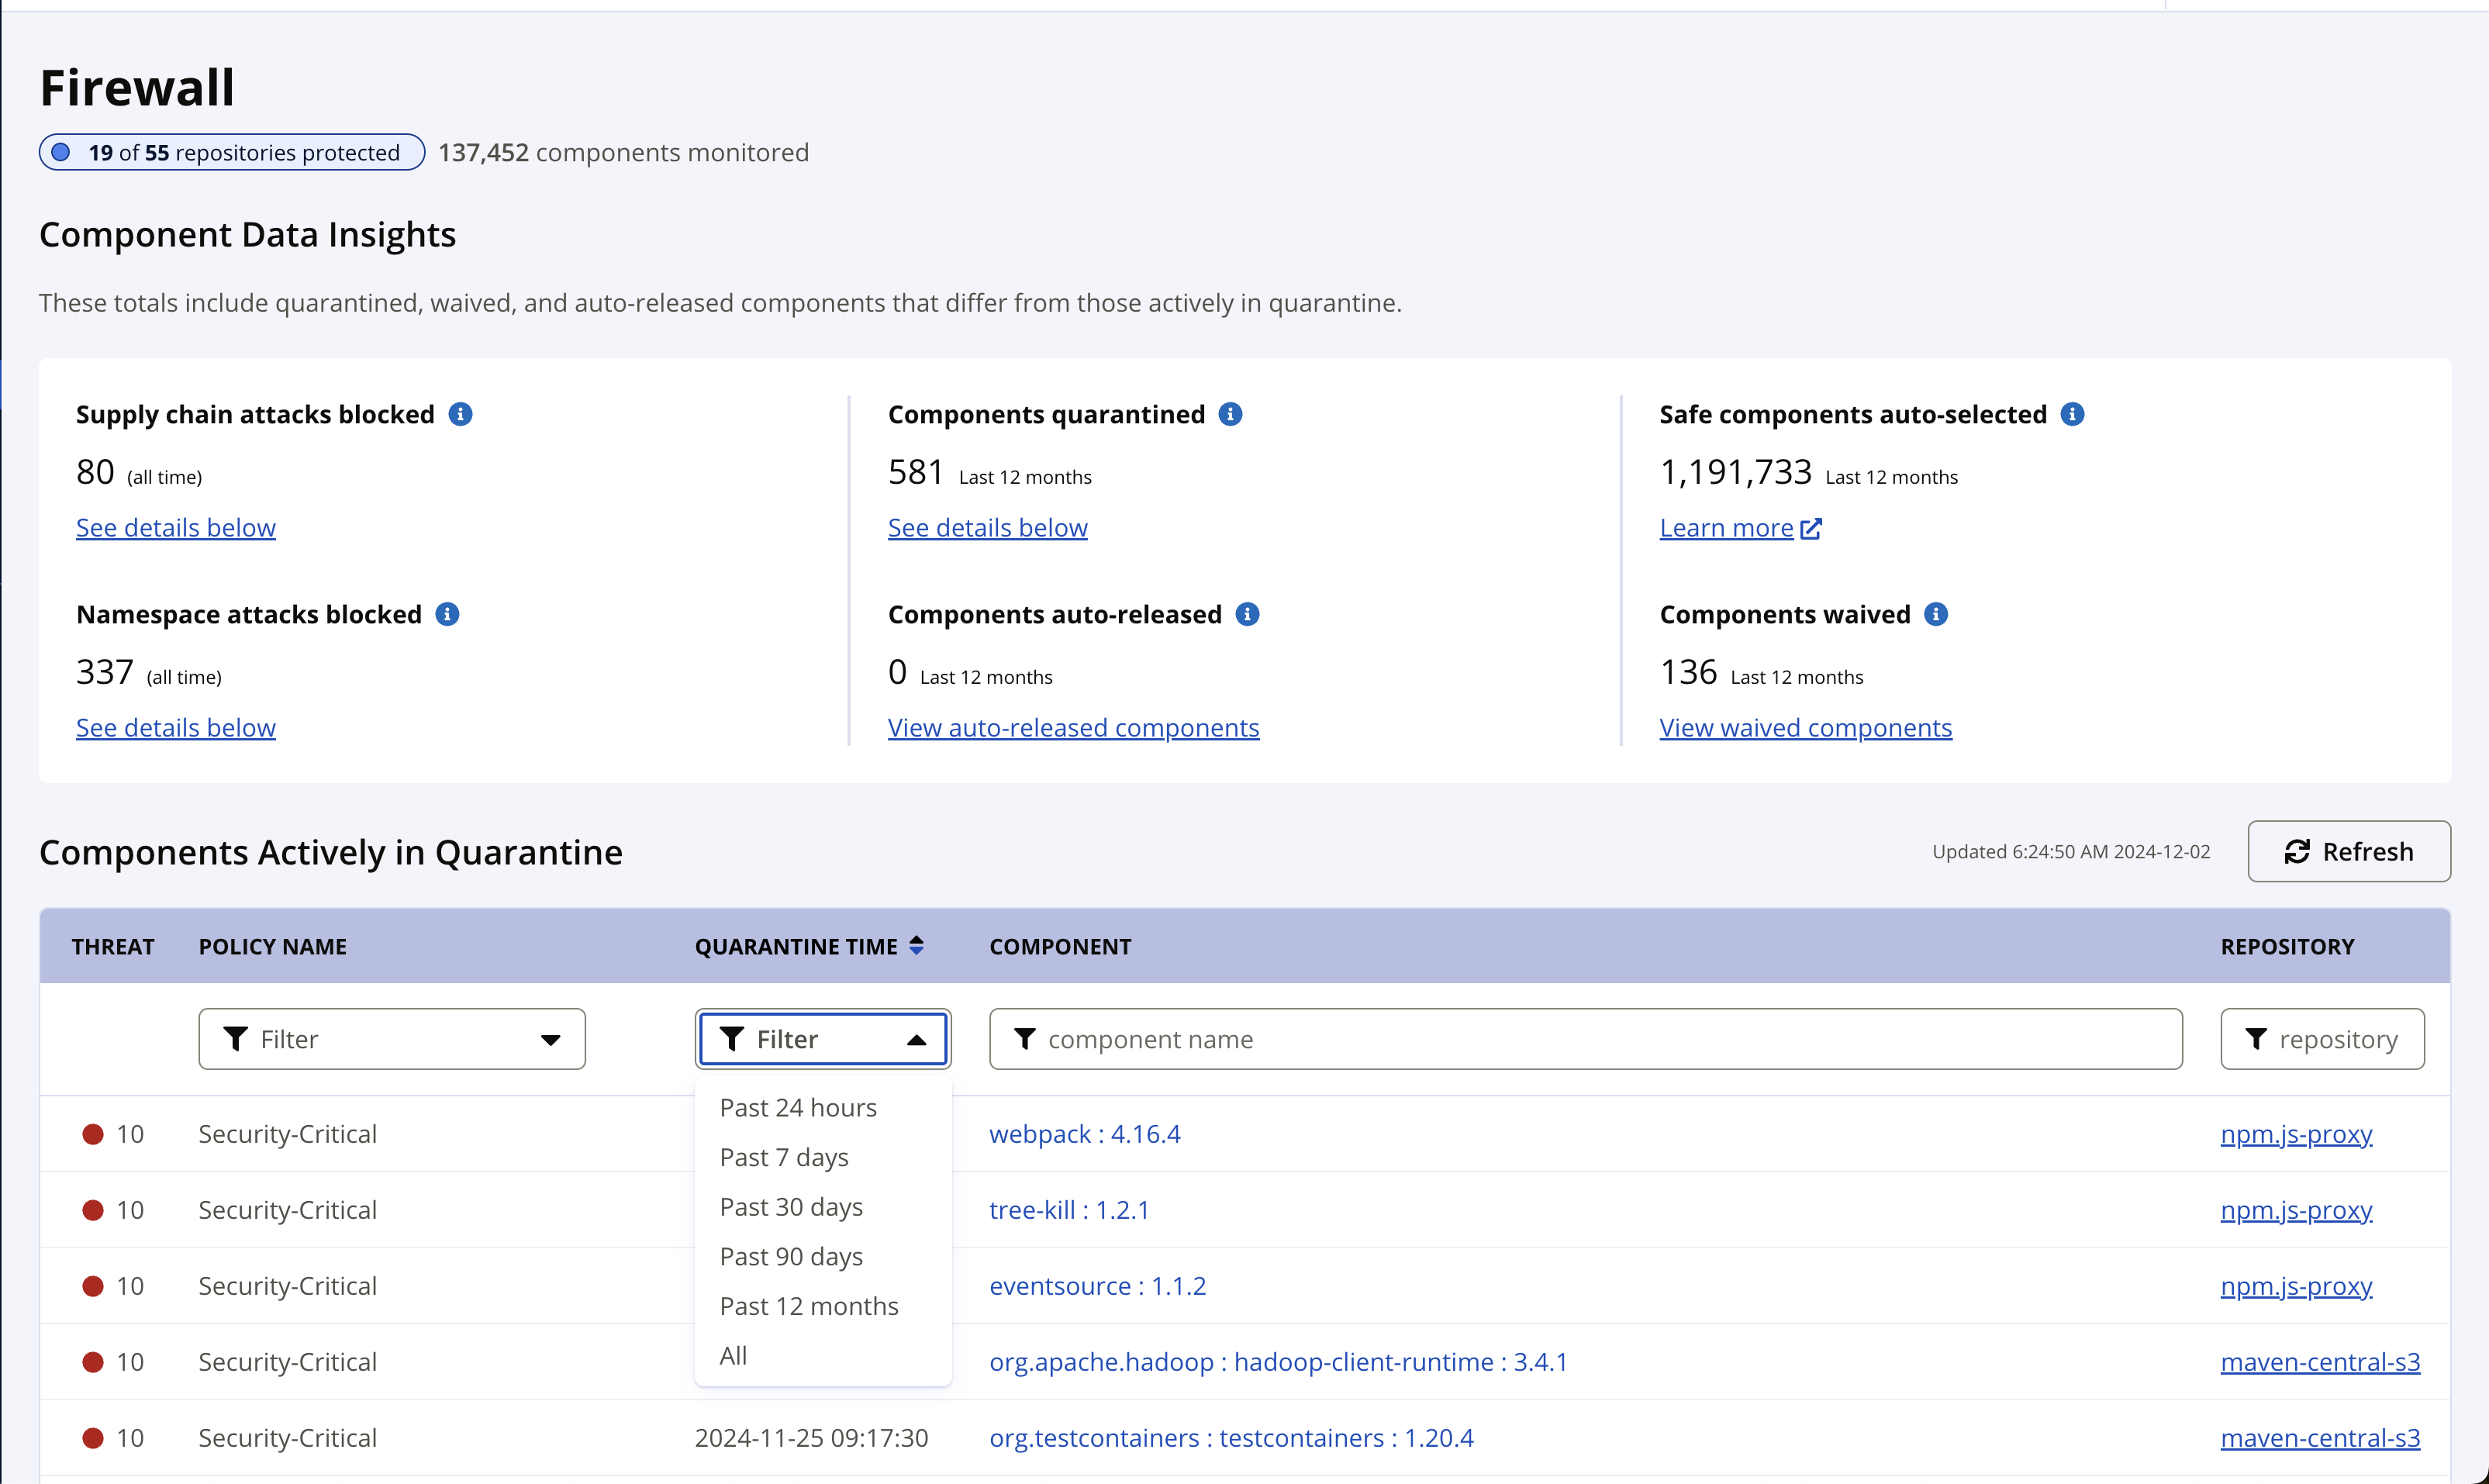
Summary Metrics
This display lists the number of components monitored in quarantine-enabled repositories.
Supply chain attacks blocked | Malicious components blocked from download |
|---|---|
Namespace attacks blocked | Components blocked from the public repositories with private namespaces |
Components quarantined | Components with failing policy violations |
Components auto-released | Components auto-released after violations have been resolved |
Safe components auto-selected | Auto-selected safe versions of these components |
Components waived | Components where the failing violations have been waived in the last 12 months |
Quarantined Components
The quarantine results contain components currently in quarantine across Firewall-enabled repositories.
Navigate the results using the filters or pagination controls. The list is sorted by the Quarantine Time, Threat Level, and Component by default.
Selecting the Quarantine Time, Policy, Component, or Repository columns header changes the sort order of the component list.
Threat | The threat level of the highest policy violation |
|---|---|
Policy Name | Policy name of the highest policy violation. Filter the list by selecting the relevant policies. |
Quarantine Time | The timestamp the component was quarantined. Filter the component list by the past 24 hours, 7 days, 30 days, 90 days, and 12 months. |
Component | The quarantined components. The filter may include any part of the component identifier in the below format. Include the spaces and colon when including more than one property. [namespace] : [project] : [version] |
Repository | The proxy repository the component was quarantined from. Use the filter by the repository name. The repository link navigates to the repository report view. |
Selecting a table row displays the Component Information Panel for that component.