Security Risk Trends
About the Data
Data Refresh Frequency: Updated daily at 1:00 pm UTC
Displays Data for: All open violations (regardless of the date they were opened) and resolved violations on or after January 1, 2024. For new installations, data will be visible within a week after the first scan.
To view historical data (generated before January 1, 2024) version 188 or higher is required.
Minimum Requirements: Applications must be scanned at least once, after upgrade to version 184. The dashboard currently shows data related to violations and remediations that are discovered after upgrade to version 184.
Overview
The Security Risk Trends dashboard is a valuable tool to monitor the health and security posture of your applications that rely on the open source software components. The trends displayed on this dashboard are based on the data collected during the policy violation detection and remediation activities performed by Sonatype Lifecycle for your on-boarded applications at multiple stages of development. By examining your organization’s risk remediation activities over time, you can establish benchmarks for Fix Rate and MTTR (mean time to remediate) for your teams to maintain a healthy security posture.
The dashboard provides visibility into the number of violations and the time it takes to remediate (MTTR) them in your applications. The threat levels of the policy violations in conjunction with the number of violations gives comprehensive insight into the overall security risk.
Based on this data (e.g. if MTTR is within acceptable limits,) you can set the policy actions for the related Lifecycle policies to Warn versus Fail, to prevent blocking production releases. You can assess the pending violations and the associated threat levels to prioritize your remediation strategy.
A deeper analysis into the MTTR can reveal the effectiveness of your remediation strategy. It can be used to gain an understanding of your response processes in addressing the highest risk against the most common vulnerabilities found in the open-source components used in your applications.
The Security Risk Trends dashboard displays the following metrics:
Get to Know Your Security Risk Trends Dashboard
The interactive dashboard provides multiple filter options to view the security risks in your applications. You can filter on date range, organization, application, application category, policy threat level, stage, violation type, security policy name, component type, remediation status and waiver reason.
Violation Types available for filtering are Legacy Violations and Non-Legacy Violations.
Remediation Statuses available for filtering are fixed, open and waived.
Waiver reasons available are acknowledged violation, mitigated externally, no upgrade path, not reachable, not exploitable, researching and other. Refer to Waiver Reasons for more information.
Stages available for filtering are release, stage-release, build, compliance and source. The build stage is selected by default.

Daily Open Violation Counts
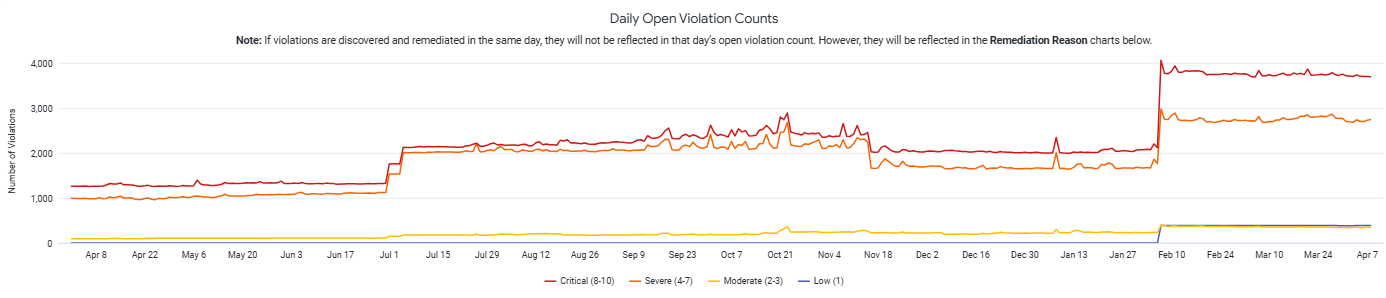
The Daily Open Violation Counts chart displays the number of non-waived violations present each day across all applications matching the selected filters. Open violations are broken out by threat level.
This chart does not include violations that are discovered and remediated on the same day. For example: A violation that was detected (open) on 30/11/2023 and fixed/remediated on the same day (30/11/2023), will not appear in the chart.
More Examples:
A violation that was detected (open) on 30/11/2024 and still has not been fixed/waived, will count as 1 during 30/11/2024 until now.
A violation that was detected (open) on 30/11/2023 and waived/remediated on 30/11/2024, will count as 1 between these dates.
A violation that was detected (open) on 30/11/2023, waived on 30/12/2023 and fixed on 30/01/2024, will count as 1 between 30/11/2023 and 30/12/2023.
How Quick Remediation Affects Daily Open Violation Counts
The Daily Open Violations Count chart shows the number of violations with status open at the end of 24 hour time period. If a violation is detected and has been remediated within the 24 hr time period, it will not be included in the Daily Open Violation Counts.
Daily Active Waivers
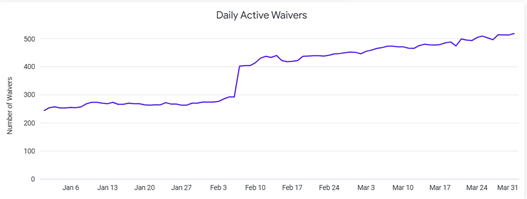
The Daily Active Waivers chart displays the count of waivers (manual and automatic) that are currently being applied to policy violations on that day. Since waivers can be scoped at different levels (root organization, organization, or application) and can have a Waiver Reason associated with them, adjust the filters at the top of the dashboard to retrieve the count of active waivers that applies to your specific area of interest.
More Waivers Means More Risk
The count of waivers on a given day indicates the number of policy violations that are being suppressed that day. Although waivers unblock development workflows, they also increase the exposure to vulnerabilities, waiting to be exploited.
Violations Over Time
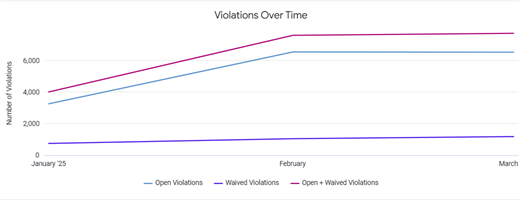
The Violations Over Time chart displays the number of violations (open, waived or both) as they exist on the last day of each month.
How Does Waiving and Fixing Violations affect the Monthly Count
The Violations Over Time chart shows the number of violations for each status i.e open, waived, open + waived at the end of each month. The examples below describe different scenarios:
If a violation was waived on Jan 20, 2024, and the corresponding waiver expired on Feb 20, 2024, and it was not fixed then it will be counted as 1 waived violation in January (it was waived as of Jan 31) and 1 open violation in February (it was open as of Feb 29.)
If a violation was waived on Jan 20, 2024, and was fixed on Feb 20, 2024, it will be counted as 1 waived violation in January (it was waived as of Jan 31.) and will not contribute to the counts for February.
If a violation was waived on Jan 20, 2024, and is still active (not fixed and waiver not expired), it will be counted as 1 waived violation for each month.
Monthly Violation Activity
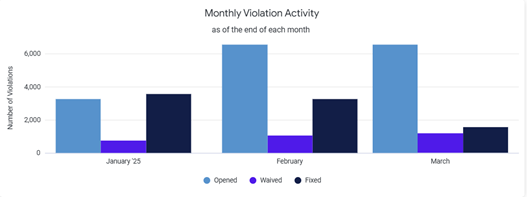
The Monthly Violation Activity chart displays a comparison of violation statuses (open, waived, fixed) of violation detected at the end of each month (or as of the last calendar day when this report is generated, for the current month.)
It displays the number of violations categorized into:
Opened: The total number of open violations existing in the given month.
Waived: The total number of waived violations existing in the given month.
Fixed: The number of violations that were remediated in that month.
The Monthly Violation Activity chart provides insights into your teams' efforts in staying ahead of remediating violations and maintaining a good security posture.
Mean Time to Triage
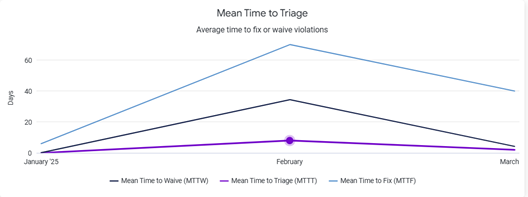
The Mean Time to Triage chart represents the average time taken to waive or fix the violation. The time taken to triage measured as the period between the time when the policy violation was first detected and the time when the policy violation was either fixed or waived.
If the policy violation was first waived and then fixed, then the Mean Time to Triage is considered as the difference in time when the policy violation was first detected and the time when the policy violation was waived. The fix time is not considered in such cases.
Triage Rate
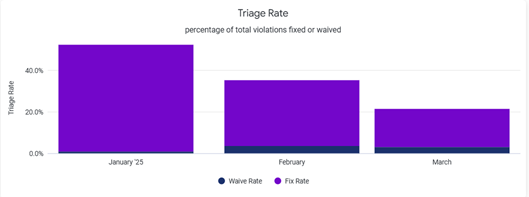
The Triage Rate chart represents the ratio of the number of policy violations that are waived/fixed to the total number of policy violations detected in a month.
Total Violations Waived
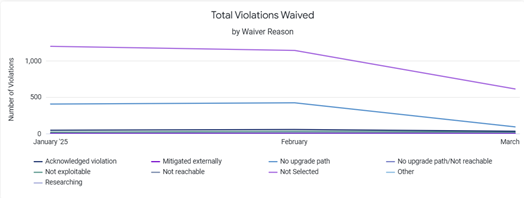
The Total Violations Waived chart shows the count of policy violations that were waived in a month.
Active Waivers by Waiver Reason
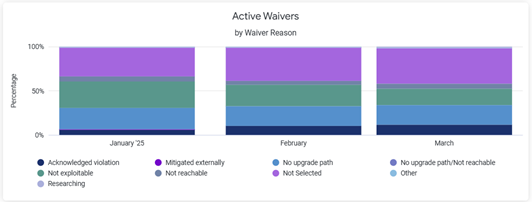
The Active Waivers by Waiver Reason chart shows a percentage wise breakdown each waiver reason for active waivers in a month. It can be used to gain insights into the rationale for applying waivers to policy violations and help uncover problem areas that are preventing a fix.
Not Selected waiver reason may include waivers that were applied using Lifecycle instances prior to when Waiver Reasons feature was released (release 183).
Troubleshooting
Problem
Clicking on the browser Refresh button may give you the following error:
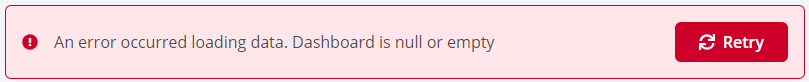
Solution
Click the Back button on your browser, from the page where you see this error, to go back to the Landing page Enterprise Reporting. Select the dashboard you want to view, to reload the visualizations.
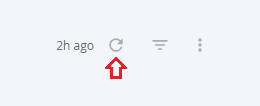
To refresh the page, click on the refresh icon on the top right, instead of the Refresh button on your browser.
Problem
No data visible on the dashboard or any other issues with the dashboard.
Solution
Click on Copy to Support Info to Clipboard button and contact support support with this information.