Waivers Explorer
About the Data
Data Refresh Frequency: Updated daily at 1:00 pm UTC
Displays Data for: All waived violations (regardless of the date they were opened) on or after January 1, 2024. For new installations, data will be visible within a week after the first scan.
To view historical data (generated before January 1, 2024) version 189 or higher is required.
Minimum Requirements: Applications must be scanned at least once, after upgrade to version 189. The dashboard currently shows data related to violations waived after upgrade to version 189.
Overview
Waivers are a powerful tool to optimize your vulnerability remediation process, by giving you the flexibility to prioritize key development deliverables over remediation efforts. Adjusting the expiration dates for waivers allows you to take calculated risks for known or less impactful policy violations in your development pipelines.
The Waivers Explorer dashboard provides a holistic view of the risk taken by your organization. It shows:
a breakdown of active waivers that are scoped to root organization, individual organizations and applications.
a summary of the volume of active waivers created, including manual and automated waivers.
a quick snapshot of upcoming expiration of active/existing waivers.
top five most frequently waived policy violations for components and applications.
Based on the analysis of the above indicators and your risk acceptance criteria, you can re-prioritize the remediation efforts.
Get to Know Your Waivers Explorer Dashboard
The interactive dashboard provides multiple filter options to view waivers. You can filter on date range, organization, application, application category, policy threat level, policy type, stage, component type, expiration date, waiver type (auto or manual), policy name, waiver duration, vulnerability (CVE or Sonatype Vulnerability ID), and waiver reasons.
Stages available for filtering are release, stage-release, build, and source. The build stage is selected by default.

Active Waivers
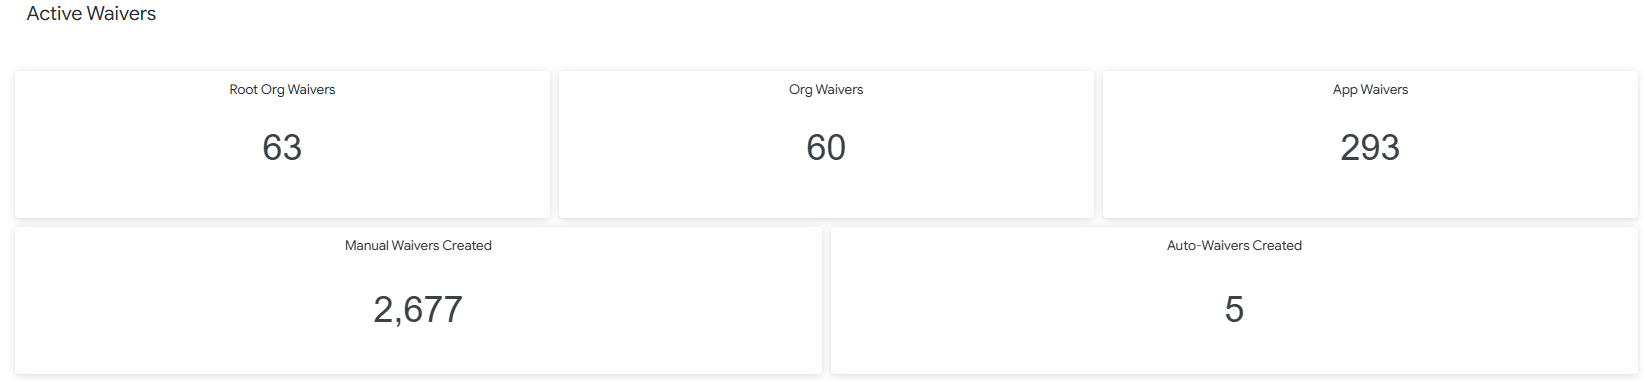
The Active Waivers section shows a categorization of waivers based on the scope defined at the time of waiver creation. It shows the total number of waivers that are scoped to each category, i.e. root organization, organizations and applications, for your instance of Lifecycle.
The includes a breakdown of the number of waivers created manually and automatically (if configured) within the selected date range. Learn more about Automated Waivers.
Waiver Activity
Waived Violations by Threat Level and Policy Type
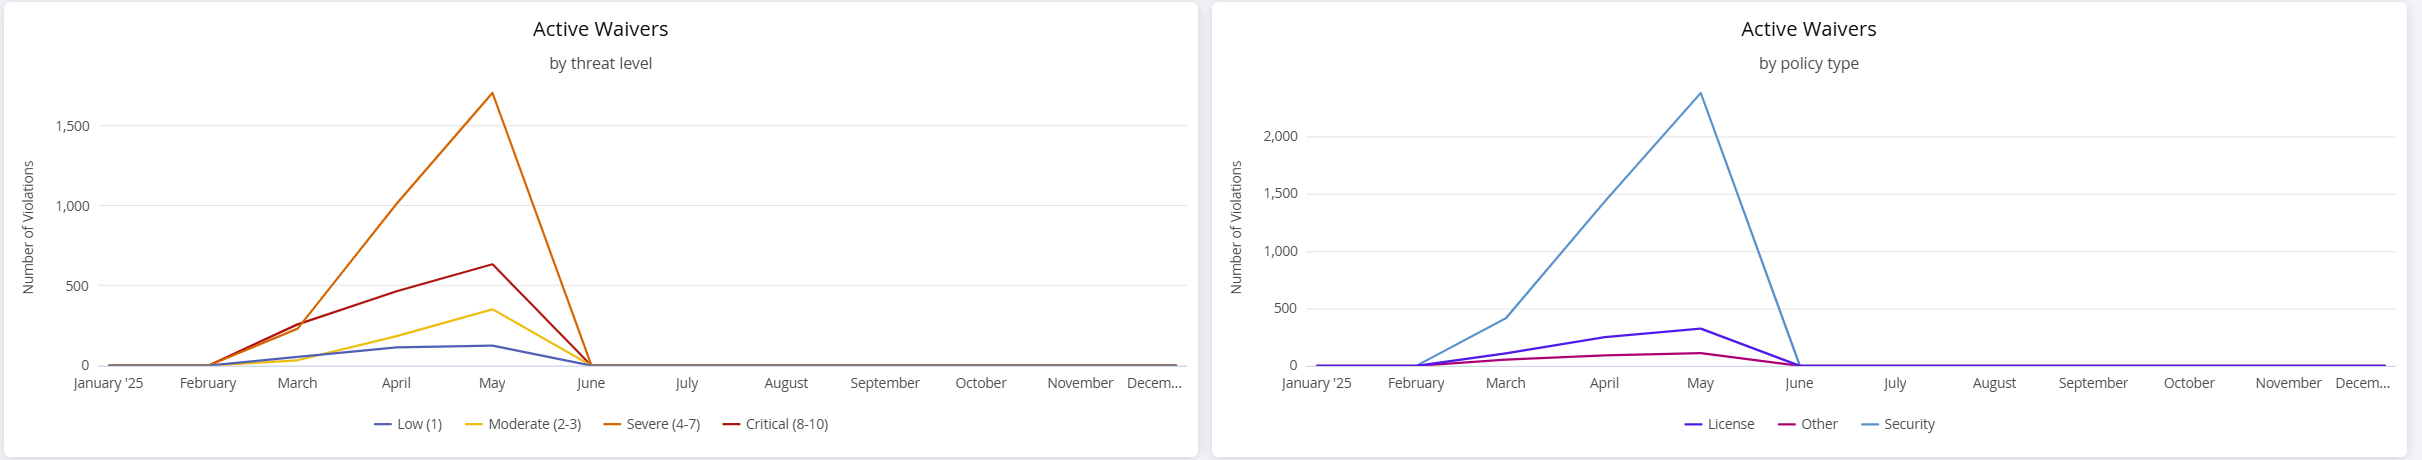
The Waived Violations by Threat Level chart shows the count of policy violations that are waived for each month, within the selected date range. The chart is aggregated by the violation threat levels low, moderate, severe and critical.
The Waived Violations by Policy Type chart shows the count of policy violations that are waived for each month, within the selected date range. The chart is aggregated by the policy types license, security or other.
Effect of Waiver Expiration Dates
A waiver created on a policy violation on January 15, with an expiration date of February 15 (waiver for 30 days) counts as one active waiver in January as well as February.
Count of Policy Violations
A policy violation is triggered by a violation of a condition and constraint set at the policy level. A policy can have multiple constraints, and constraints can have multiple conditions. A policy violation is created for each violation of these constraints.
Monthly Violations Waived by Waiver Reason
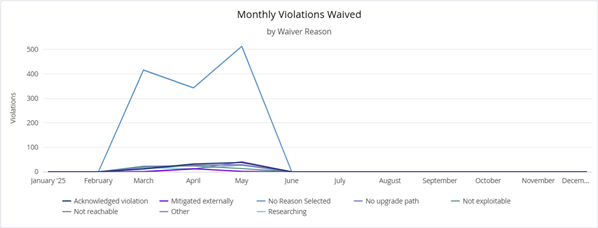
This chart displays the count of policy violations that are waived for each month within the selected date range, aggregated by the waiver reason. Waiver reasons are assigned to a waiver at the time of waiver creation. Waivers that are not assigned a reason, are categorized as "No Reason Selected."
Mean Time to Waive
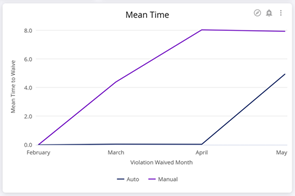
This chart displays the average time (in days) from the violation detected date to violation waived date, for the selected date range. It shows the average value of the number of violations waived for the specific month.
Example: In the image above, the mean time to manually waive policy violations in April was 8 days.
Manual Waivers and Auto-Waivers
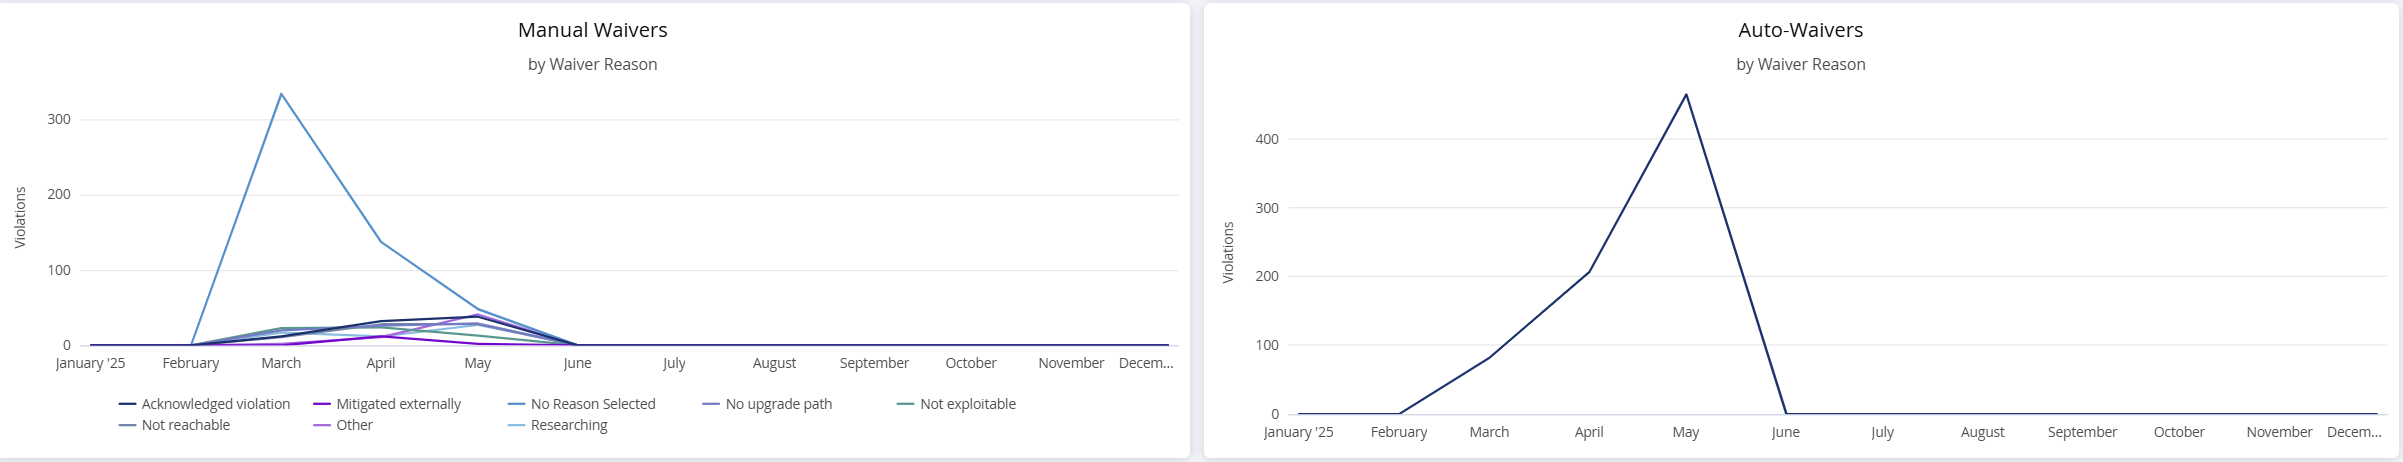
The Manual Waivers Created chart displays the count of policy violations that are waived manually and the corresponding waiver reason.
The Auto-Waivers Created chart displays the count of policy violations that are waived automatically and the corresponding waiver reasons, for instances where automated waivers are configured. The chart will display a trend line for each of the three waiver reasons for automated waivers where the policy violation is:
below the selected security threat level AND has no path forward.
below the selected security threat level AND is not reachable.
below the selected security threat level AND has no path forward AND is not reachable.
Learn more about Automated Waivers.
Waivers Expiring in:
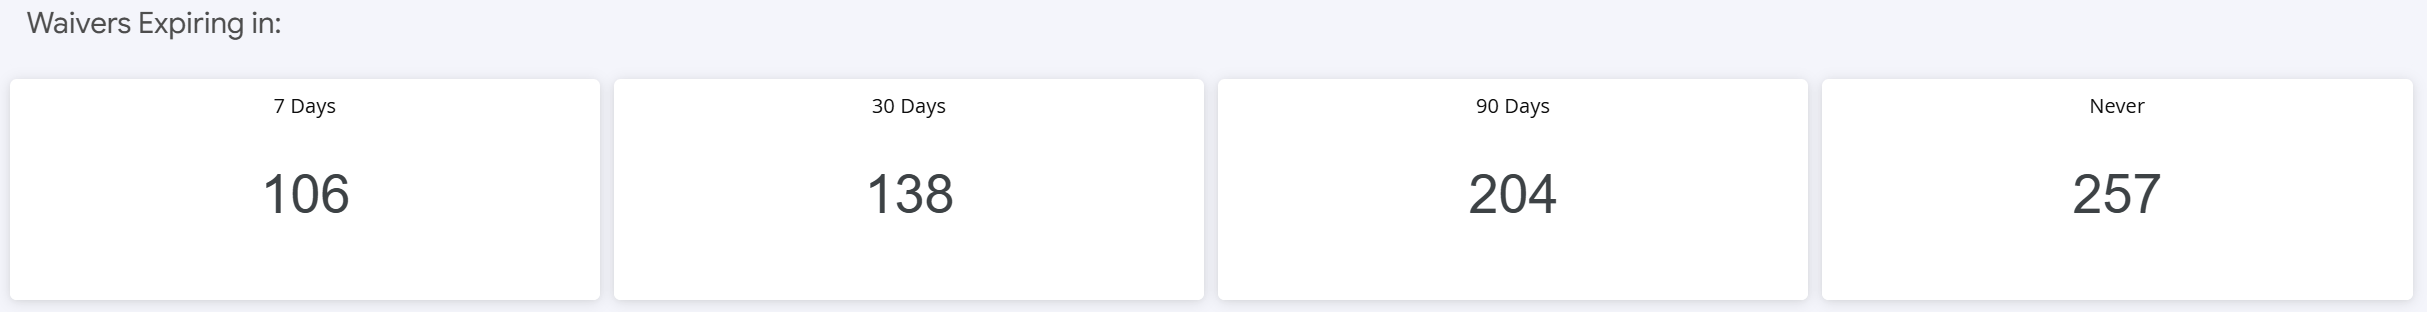
This section shows an expiration timeline for waivers for the next 7, 30 and 90 days (and never) based on the selected date range. The count shown in each tile is the cumulative sum of waivers in the time period referenced.
Top 5 Policies With Most Applied Waivers
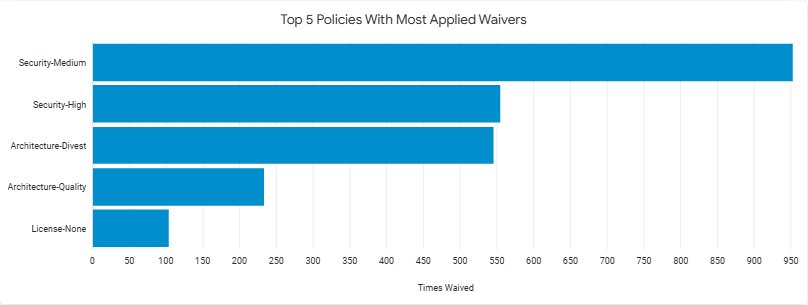
The Top 5 Policies With Most Applied Waivers shows the top five policies (policy name on Y-axis) that have the highest count of waivers created for policy violations, within the selected date range.
Top 5 Policies with Most Waived Violations
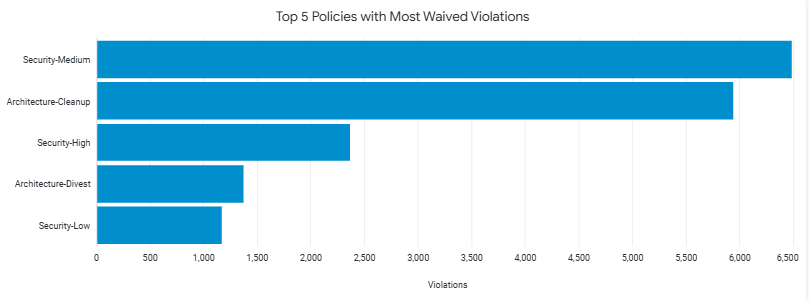
The Top 5 Policies with Most Waived Violations shows the top five policies that have the maximum number of policy violations that are waived, within the selected date range.
Top 5 Components with Most Waivers
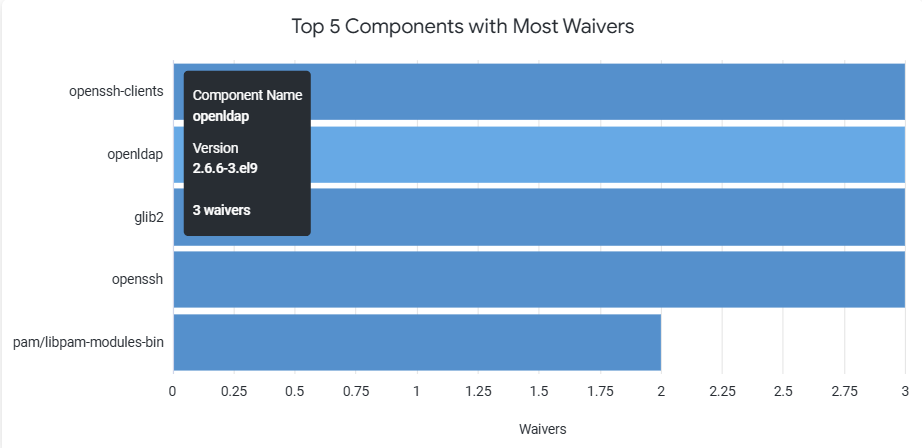
The Top 5 Components with Most Waivers shows the five components that have the maximum number of waivers applied. A quick hover over the chart shows the complete version number of the implicated component.
Top 5 Applications with Most Waived Violations
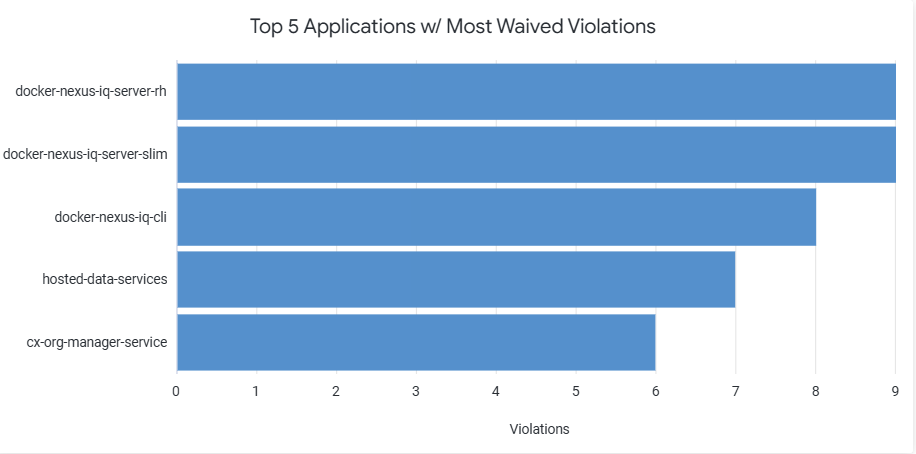
The Top 5 Applications with Most Waived Violations chart displays the five applications that have the maximum number of policy violations that are waived, within the selected date range.
Waived Violations Details

This table shows a list of all policy violations that have been waived, in the selected date range and other filter criteria.
NOTE: Due to limitations of the data visualization platform, this table can show 5,000 rows only. This also applies to the exported data.
Table column | Description |
|---|---|
Vulnerability ID | The published vulnerability identifier causing the policy violation. Not Applicable indicates that the violation is triggered by a license or other (non-security) policy. |
Namespace | The namespace to which the implicated component belongs. Not Applicable indicates that the violation is triggered by a license or other (non-security) policy or the component ecosystem does not have an explicit namespace. |
Component | The name of the implicated component. |
Version | The version number of the implicated component. |
Policy Name | The name of the policy that was violated. |
Threat Level | The threat level assigned to the policy. |
Detected | The date when the policy violation was first detected. |
Waived | The date when the policy violation was waived. |
Reason | The reason assigned at the time of waiver creation. |
Scope | The scope assigned at the time of waiver creation. |
Organization | Indicates the name of the organization |
Type | Indicates if it is a manual or automated waiver. |
Apps | Indicates the count of applications affected by the policy violation. |
Expiry | The date when the waiver expires. |
Components with Waived Violations
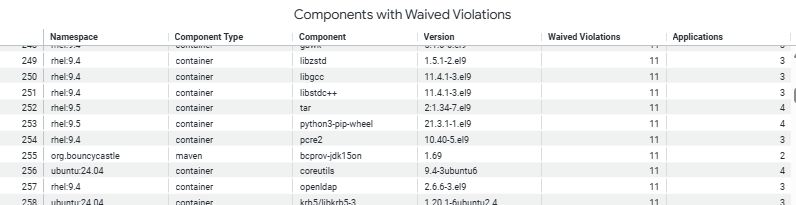
This table shows a list of all implicated components triggering policy violations that are waived.
NOTE: Due to limitations of the data visualization platform, this table can show 5,000 rows only. This also applies to the exported data.
Table column | Description |
|---|---|
Namespace | The namespace to which the implicated component belongs |
Component Type | The type of the implicated component (ecosystem) |
Component | The name of the component |
Version | The version number of the implicated component |
Waived Violations | Number of waived violations |
Applications | Number of applications containing the implicated component |
Applications with Waived Violations
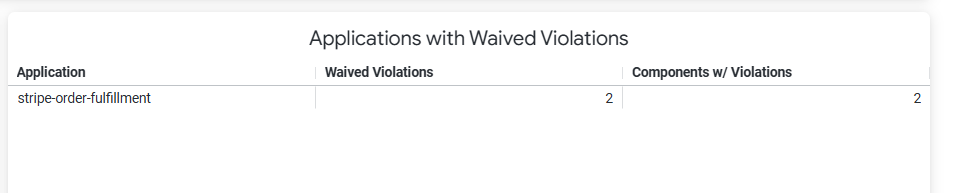
This table shows a list of all applications triggering policy violations that are waived.
NOTE: Due to limitations of the data visualization platform, this table can show 5,000 rows only. This also applies to the exported data.
Table column | Description |
|---|---|
Application | The name of the application containing the waived policy violation |
Waived Violations | Number of policy violations that are waived |
Components w/Violations | The number of violating components that are waived |
Troubleshooting
Problem
Clicking on the browser Refresh button may give you the following error:
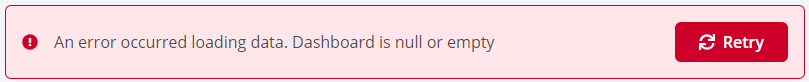
Solution
Click the Back button on your browser, from the page where you see this error, to go back to the Landing page Enterprise Reporting. Select the dashboard you want to view, to reload the visualizations.
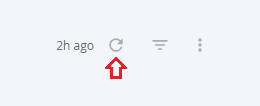
To refresh the page, click on the refresh icon on the top right, instead of the Refresh button on your browser.
Problem
No data visible on the dashboard or any other issues with the dashboard.
Solution
Click on Copy to Support Info to Clipboard button and contact support support with this information.