Cleanup Performance Data
This testing evaluates performance between Java- and SQL-based cleanup to understand the performance impacts when opting to retain specific versions while using SQL-based cleanup.
Nexus Repository deployments using PostgreSQL databases use SQL-based cleanup by default.
Summary of Findings
SQL-based cleanup far outperforms Java-based cleanup.
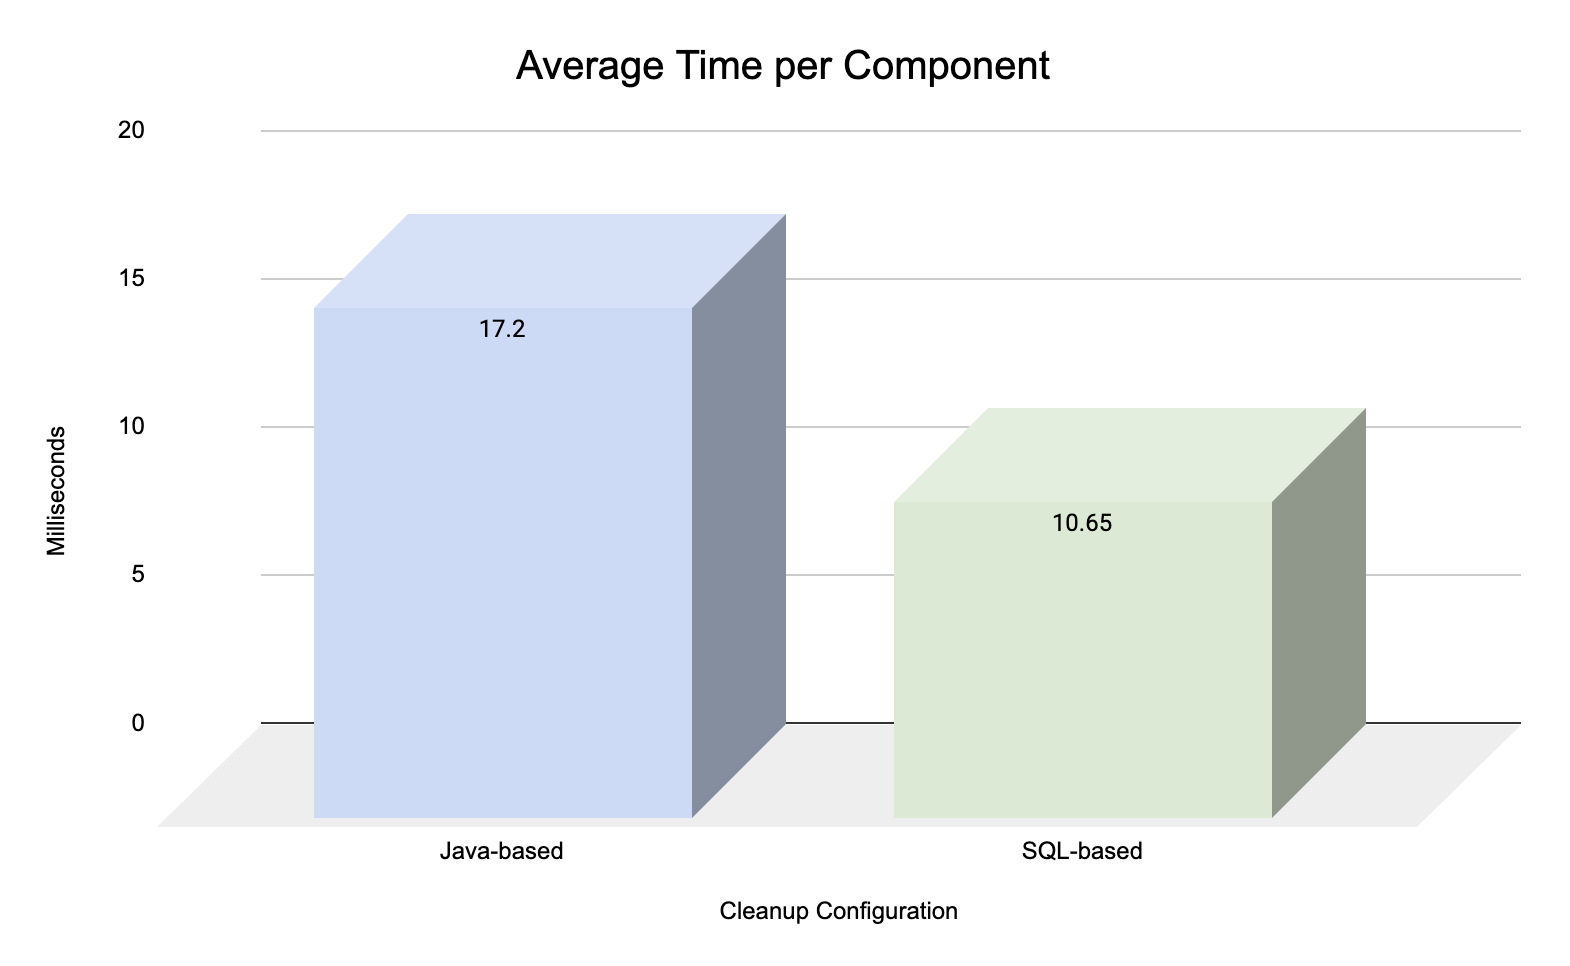
The average time per component for SQL-based cleanup was 10.6 ms versus 17.2 ms for Java-based cleanup.
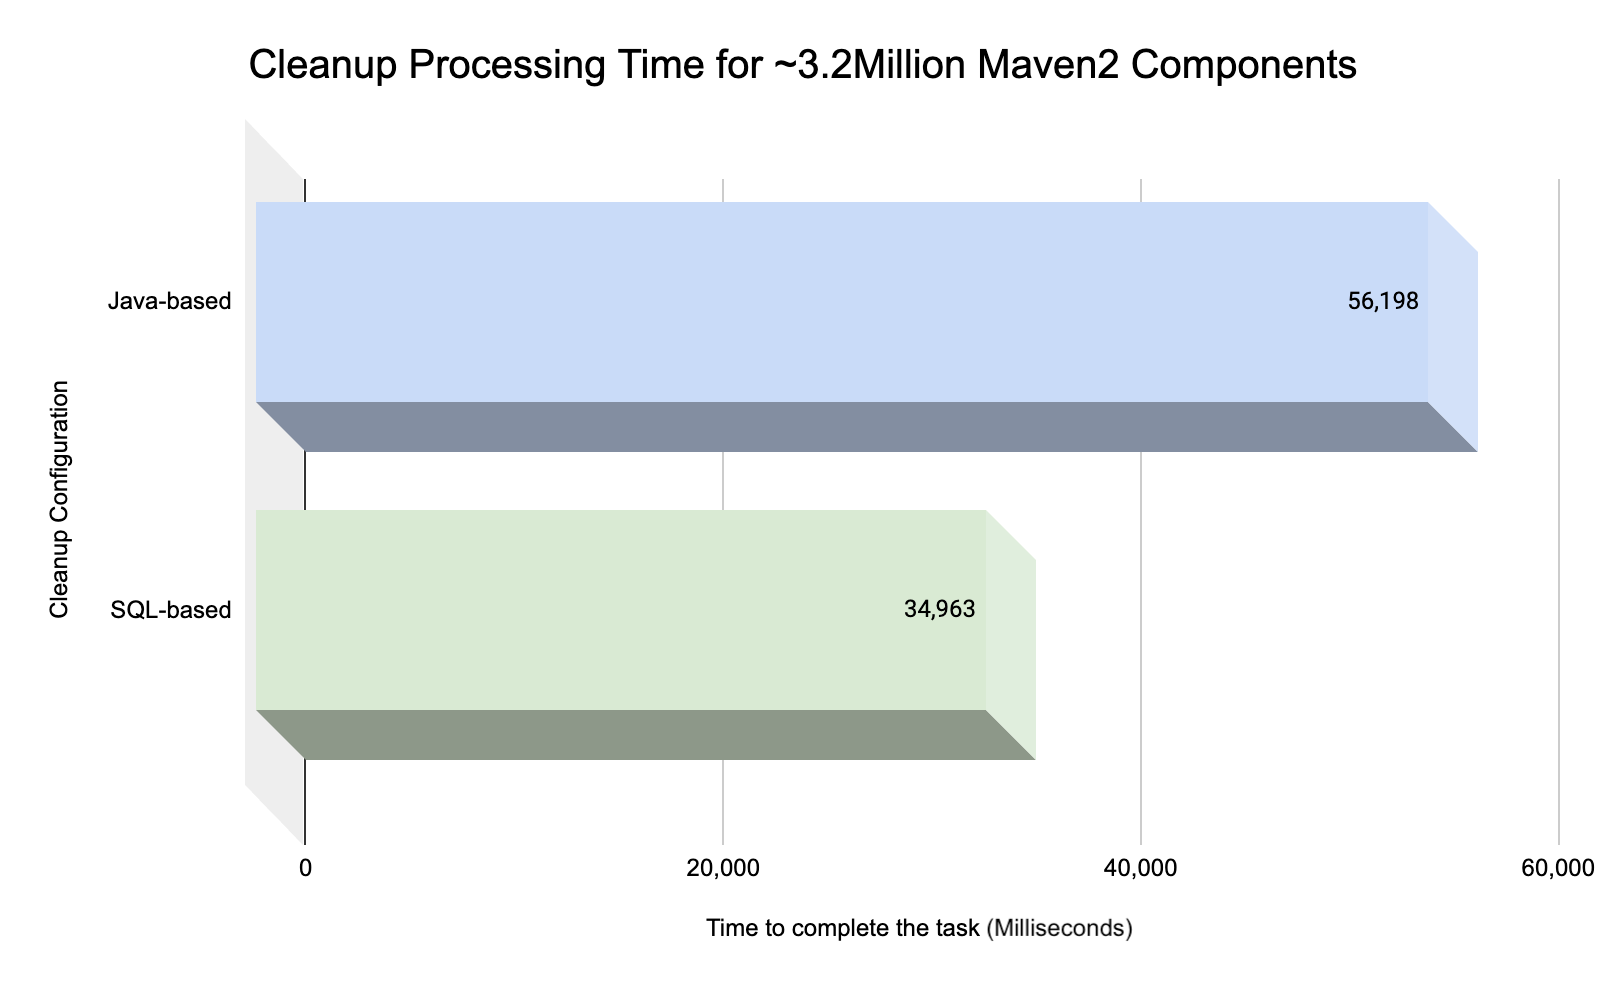
The total process could take more than 10 hours with the SQL-based approach and more than 15 hours with the Java-based approach for 3.2 Million components.
Based on this data, we conclude that SQL-based cleanup performs 38% better than Java-based cleanup (results may vary depending on the deployment environment).
Neither SQL- nor Java-based cleanup test scenarios experienced detectable bottlenecks (memory leaks) when running the cleanup task.
Neither SQL- nor Java-based cleanup test scenarios experienced hardware degradation.
SQL-based cleanup saw 10% more CPU utilization versus Java-based cleanup.
Other hardware utilization statistics were similar between both approaches.
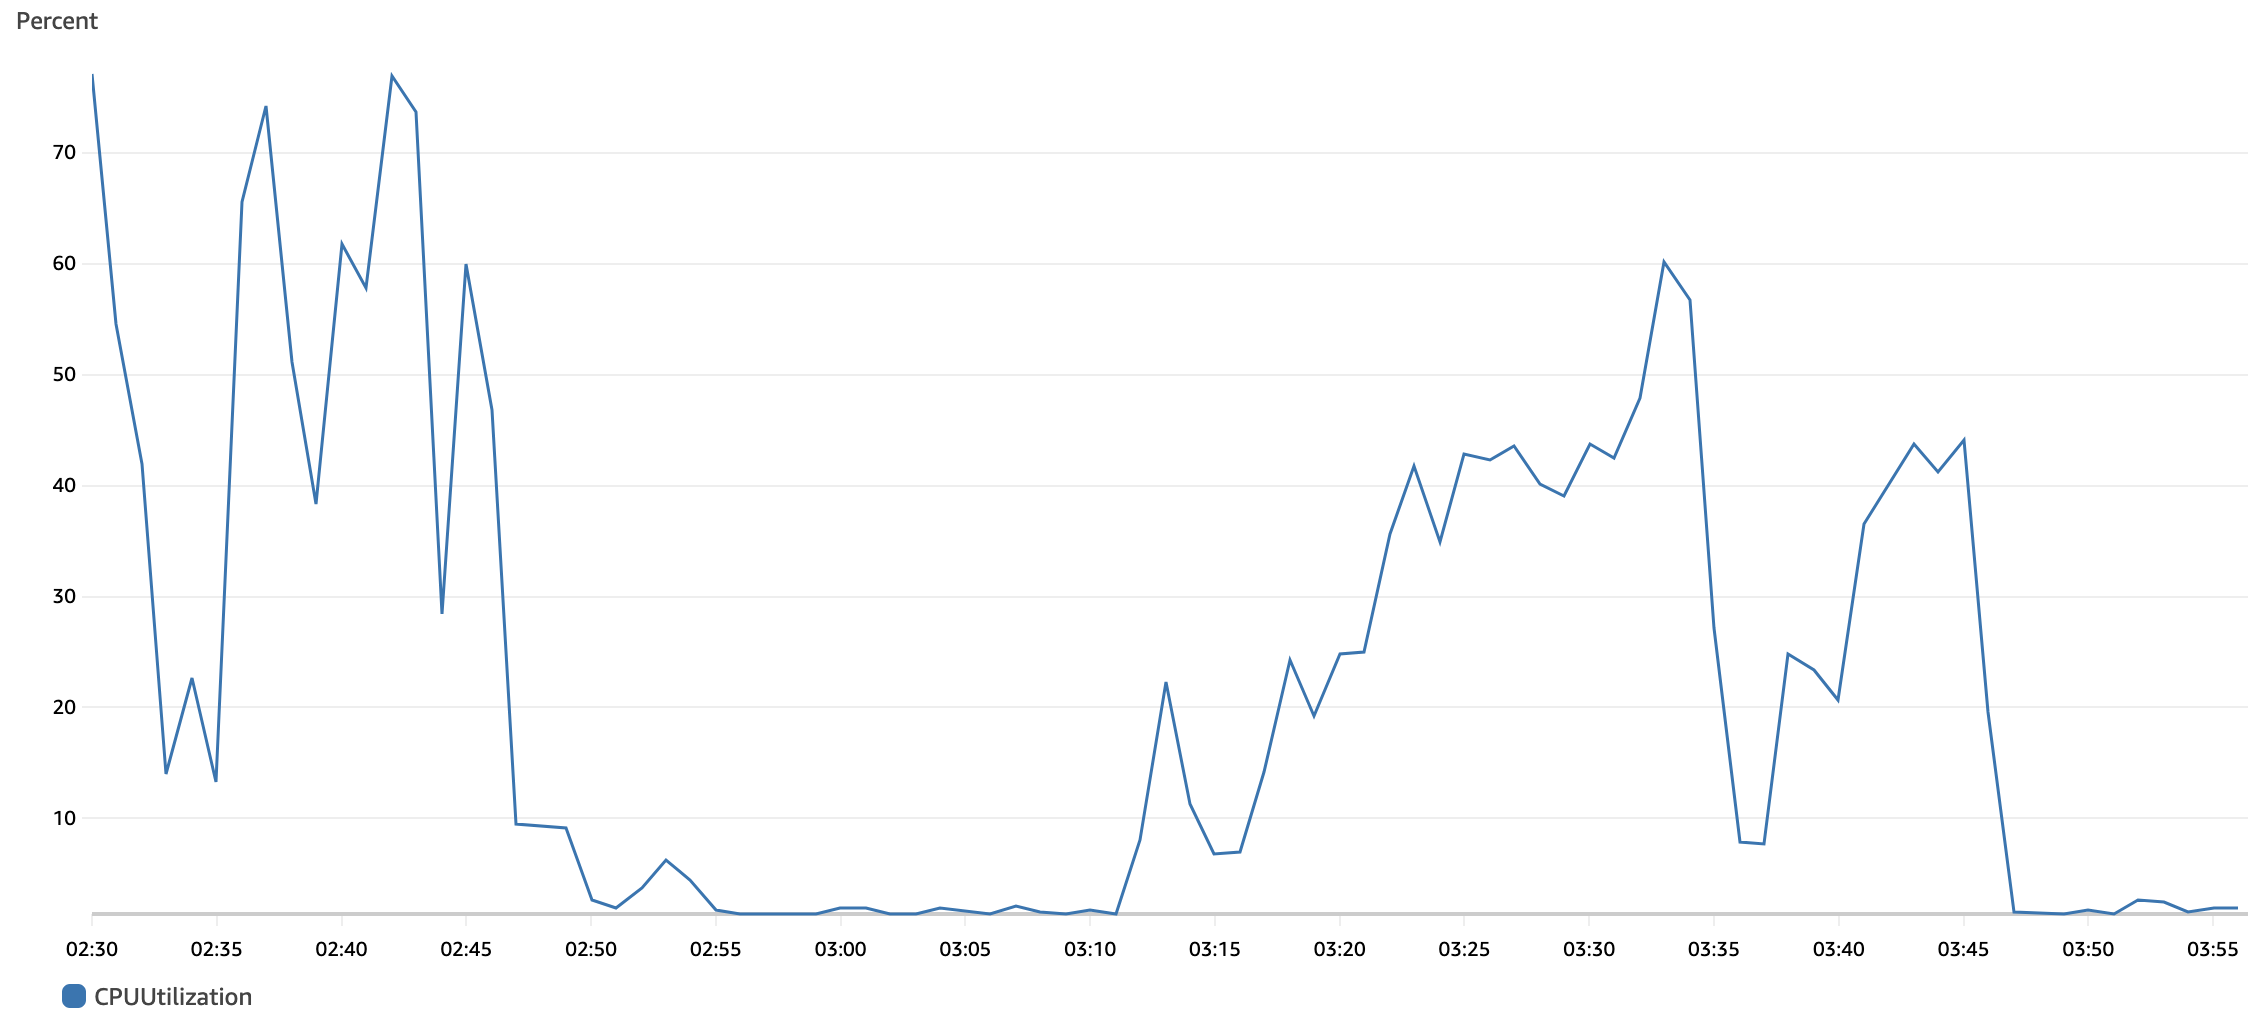
Using the ability to retain specific versions did cause a spike in RDS CPU utilization; however, this is expected as filtering by queries requires more effort from the database engine versus generic queries.
When testing the ability to retain specific versions, we saw no performance difference when using the last updated blob or last downloaded criterion to determine specific versions to retain.
Test Environment and Setup
The test environment included one Nexus Repository deployment using first Java-based cleanup and then SQL-based cleanup.
The tested deployment met the following specifications:
A Nexus Repository node deployed in an AWS m5d.2xlarge EC2 instance (8 vCPU, 32 GB RAM)
External Amazon PostgreSQL RDS backed by db.r5.xlarge (4 vCPU, 32GB RAM)
~3.2 million Maven components in hosted and proxy Maven repositories
In both the Java- and SQL-based cleanup scenarios, the applied cleanup policy covered all components (i.e., all components were flagged for cleanup).
When testing the performance impact of retaining specific versions, we adjusted the policy so that not all components would be identified for cleanup.
Resources Use Sample
SQL-based and Java-based Cleanup Comparison
Testing concluded that SQL-based cleanup performed approximately 38% faster than Java-based cleanup. Note that we mathematically calculated this value; you should only use it as a reference.
 |
As expected, the average time per component was less for SQL- than for Java-based cleanup. There was only a minimal difference in hardware utilization.
 |
Testing for Retaining a Specified Version Range
Item |
|
|
|---|---|---|
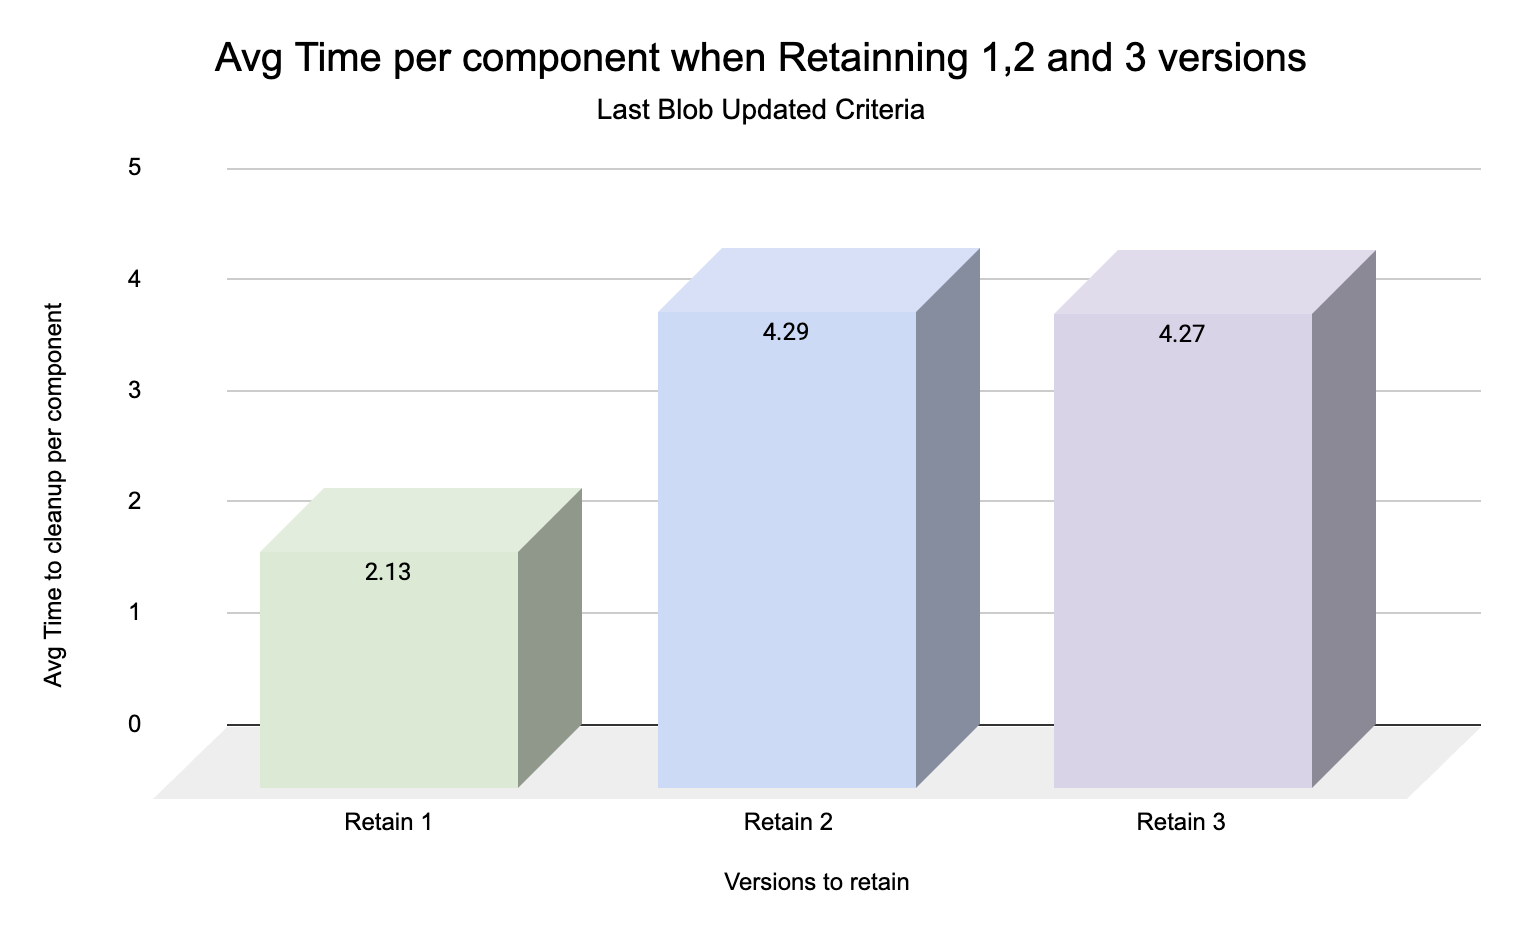
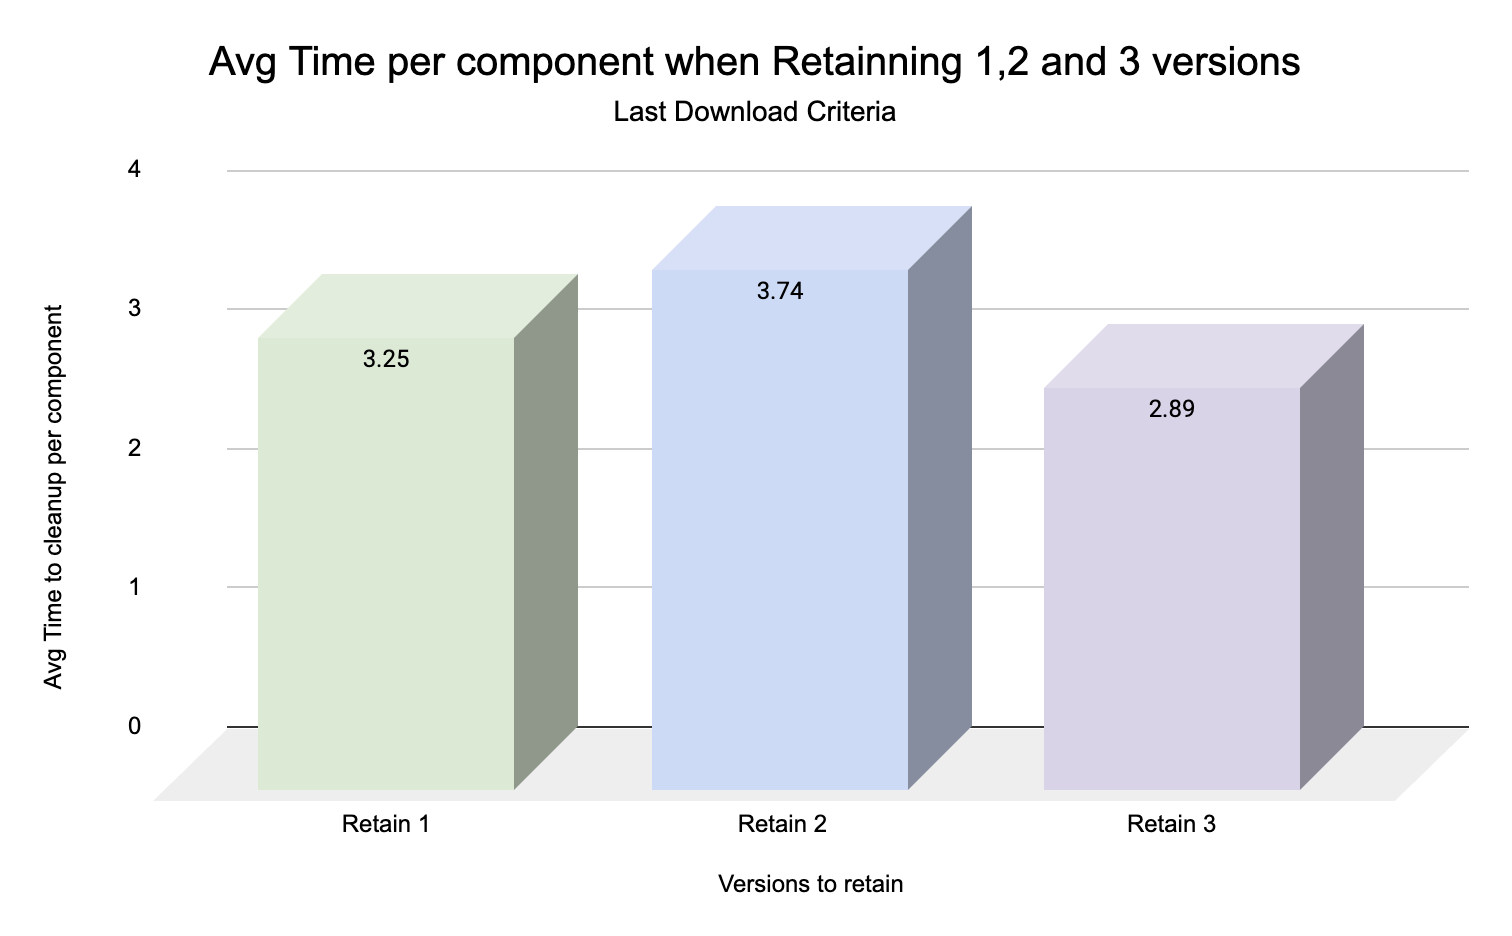
Average Time per Component Retain 1 | 2.13 ms | 3.25 ms |
Average Time per Component Retain 2 | 4.29 ms | 3.74 ms |
Average Time per Component Retain 3 | 4.27 ms | 2.89 ms |
Average Time per Component Using Last Blob Updated Criterion
 |
Average Time per Component Using Last Download Date Criterion
 |
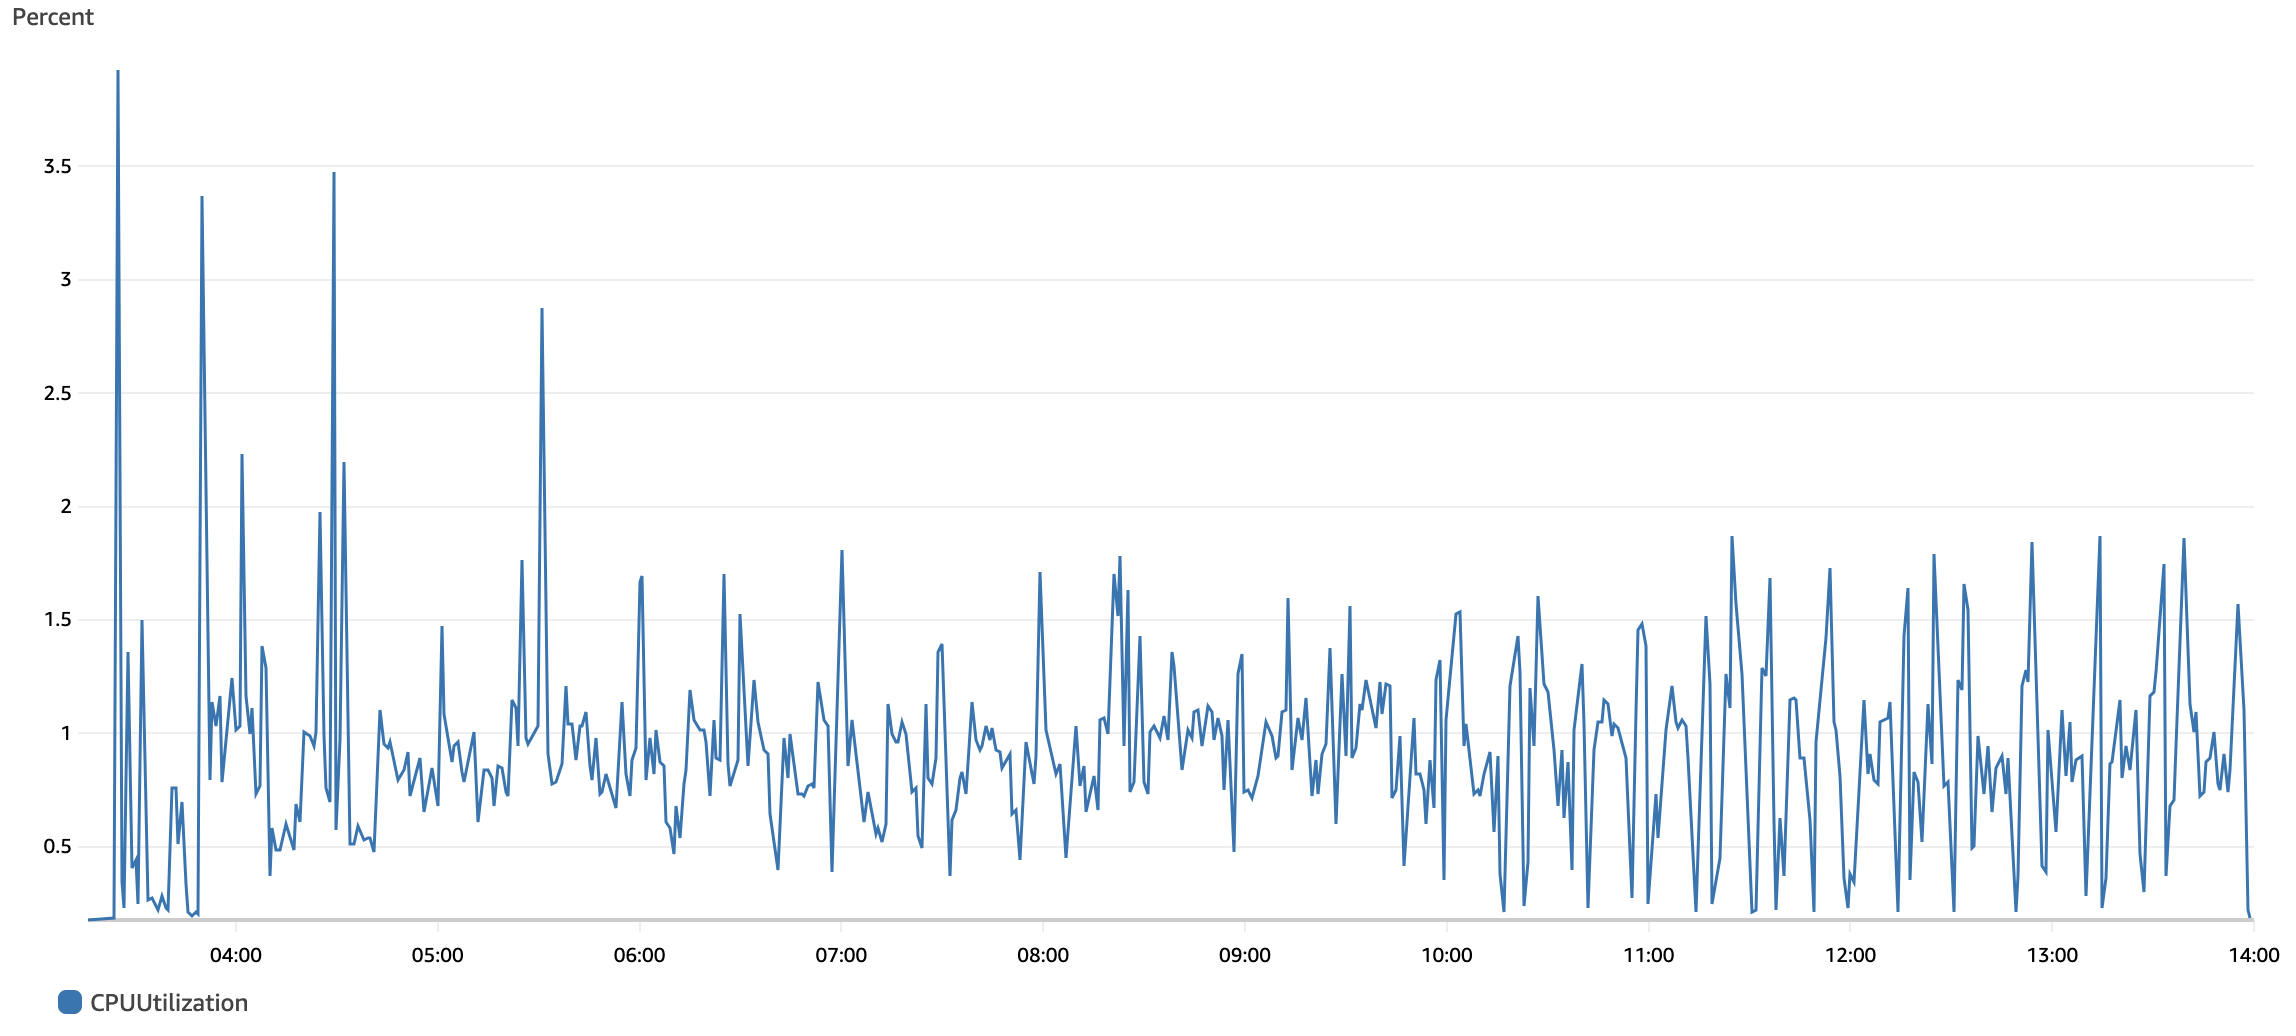
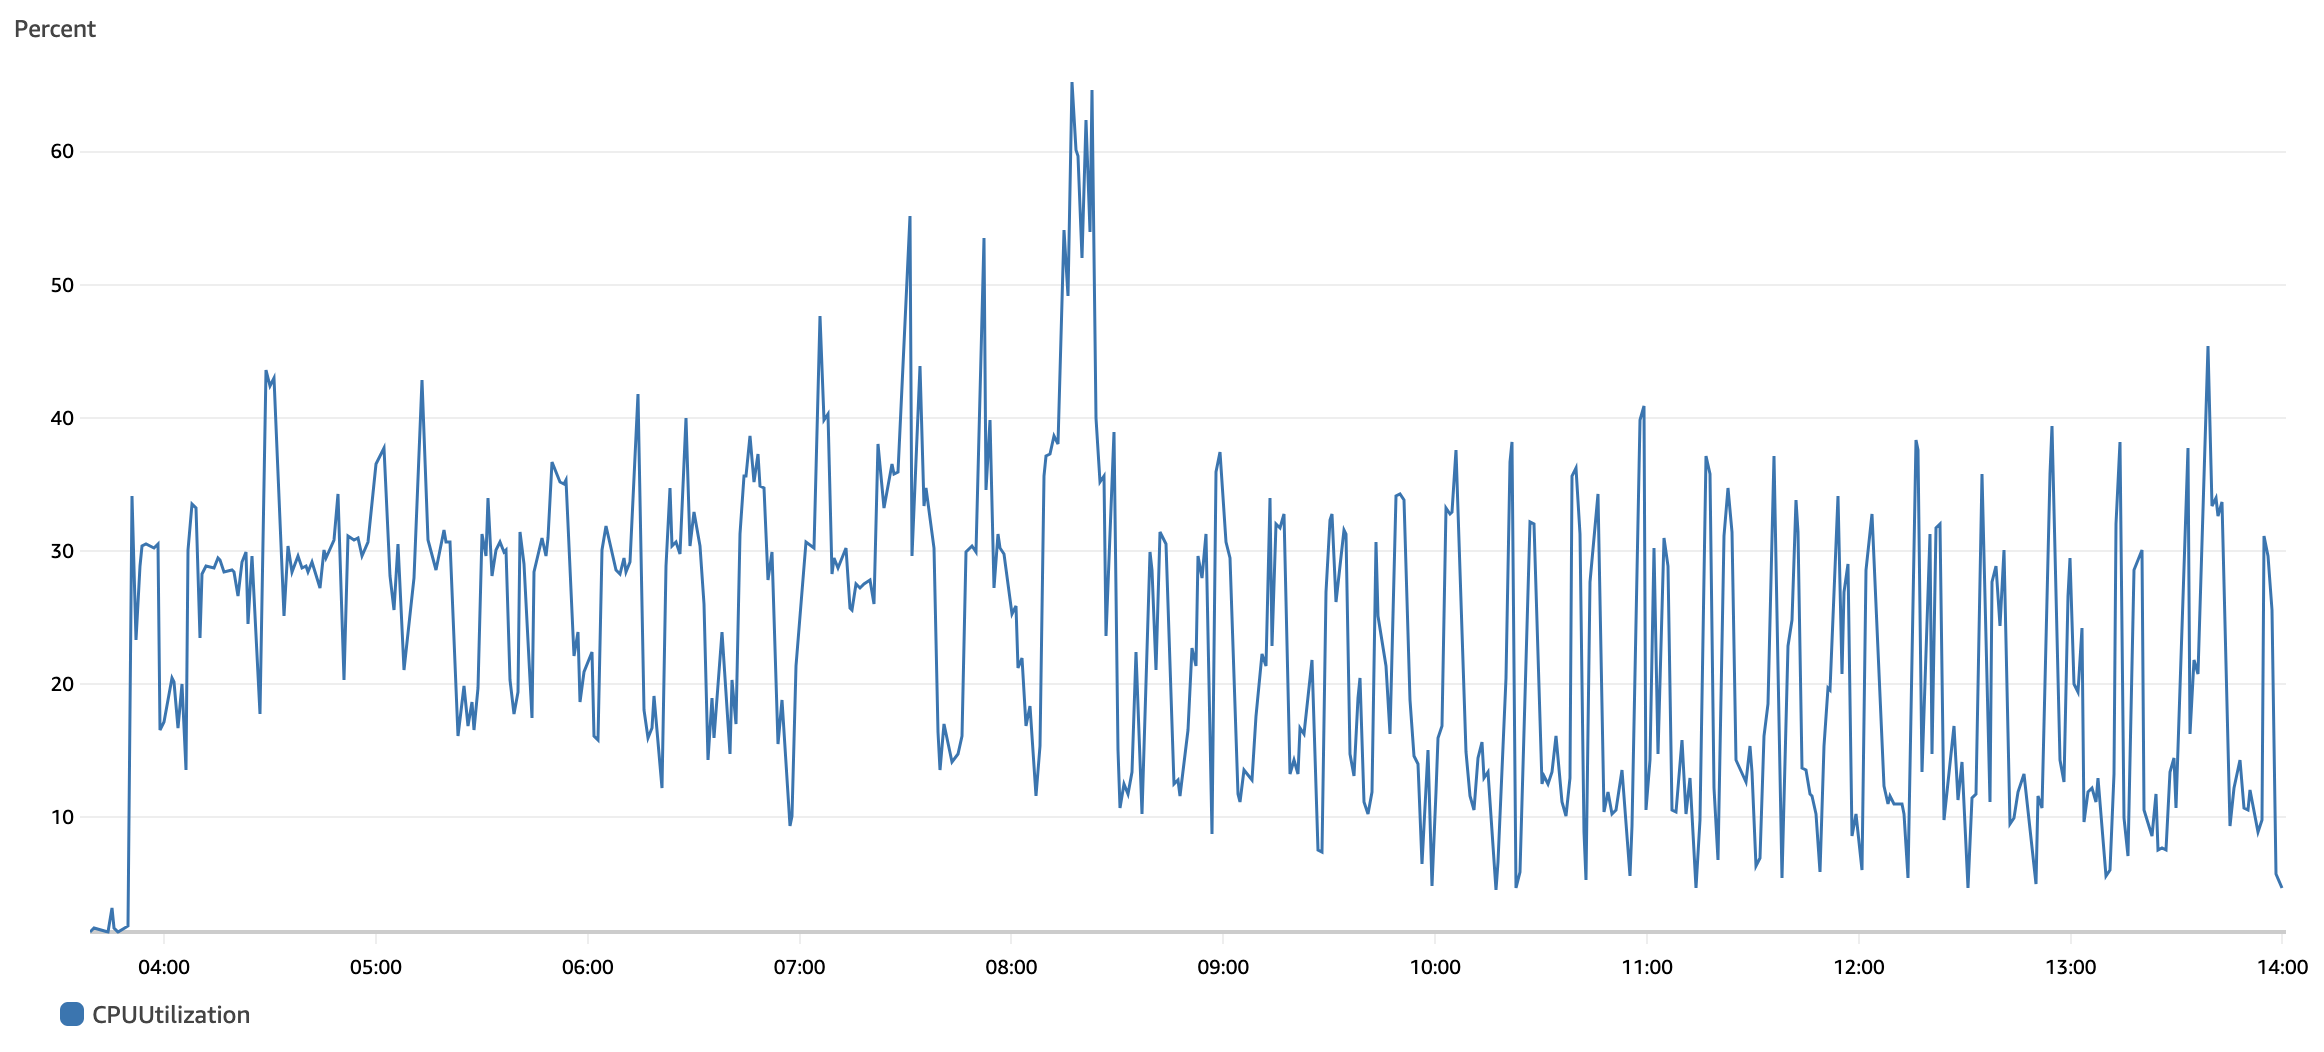
Summaries for Each Test Execution
Select any of the chart images to view them in full size.
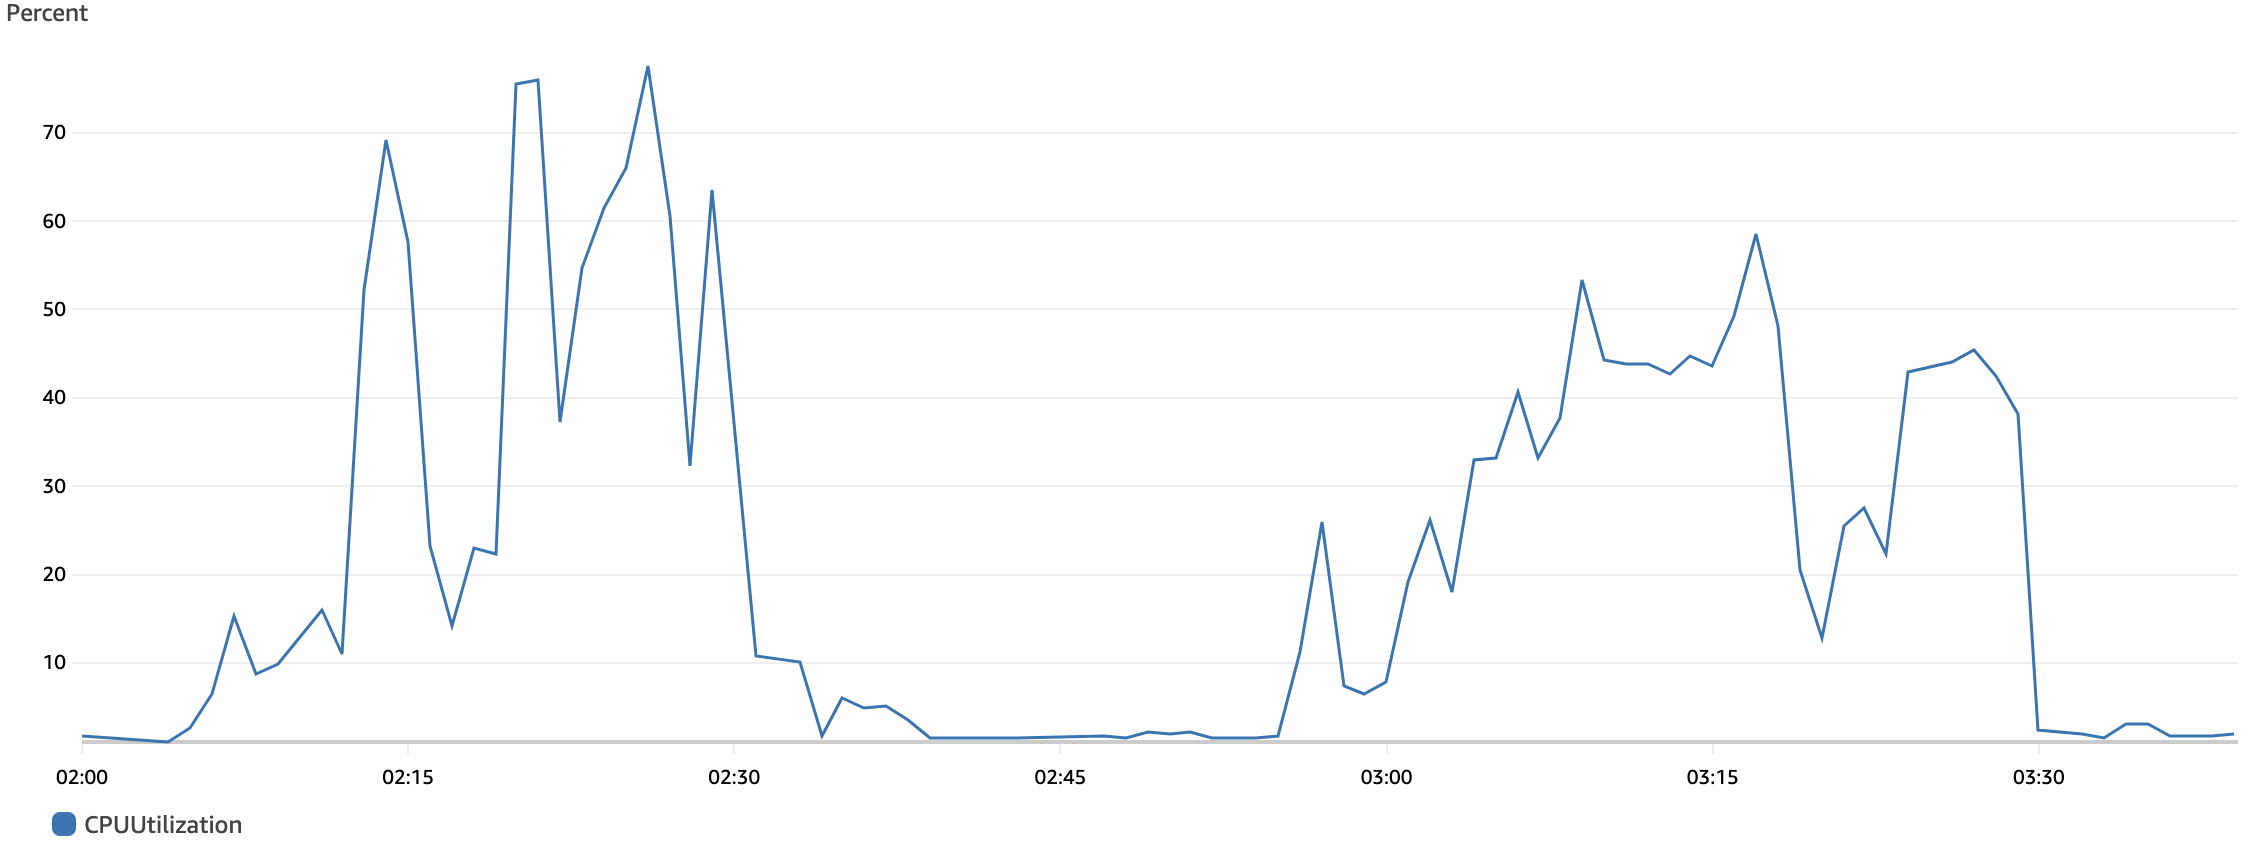
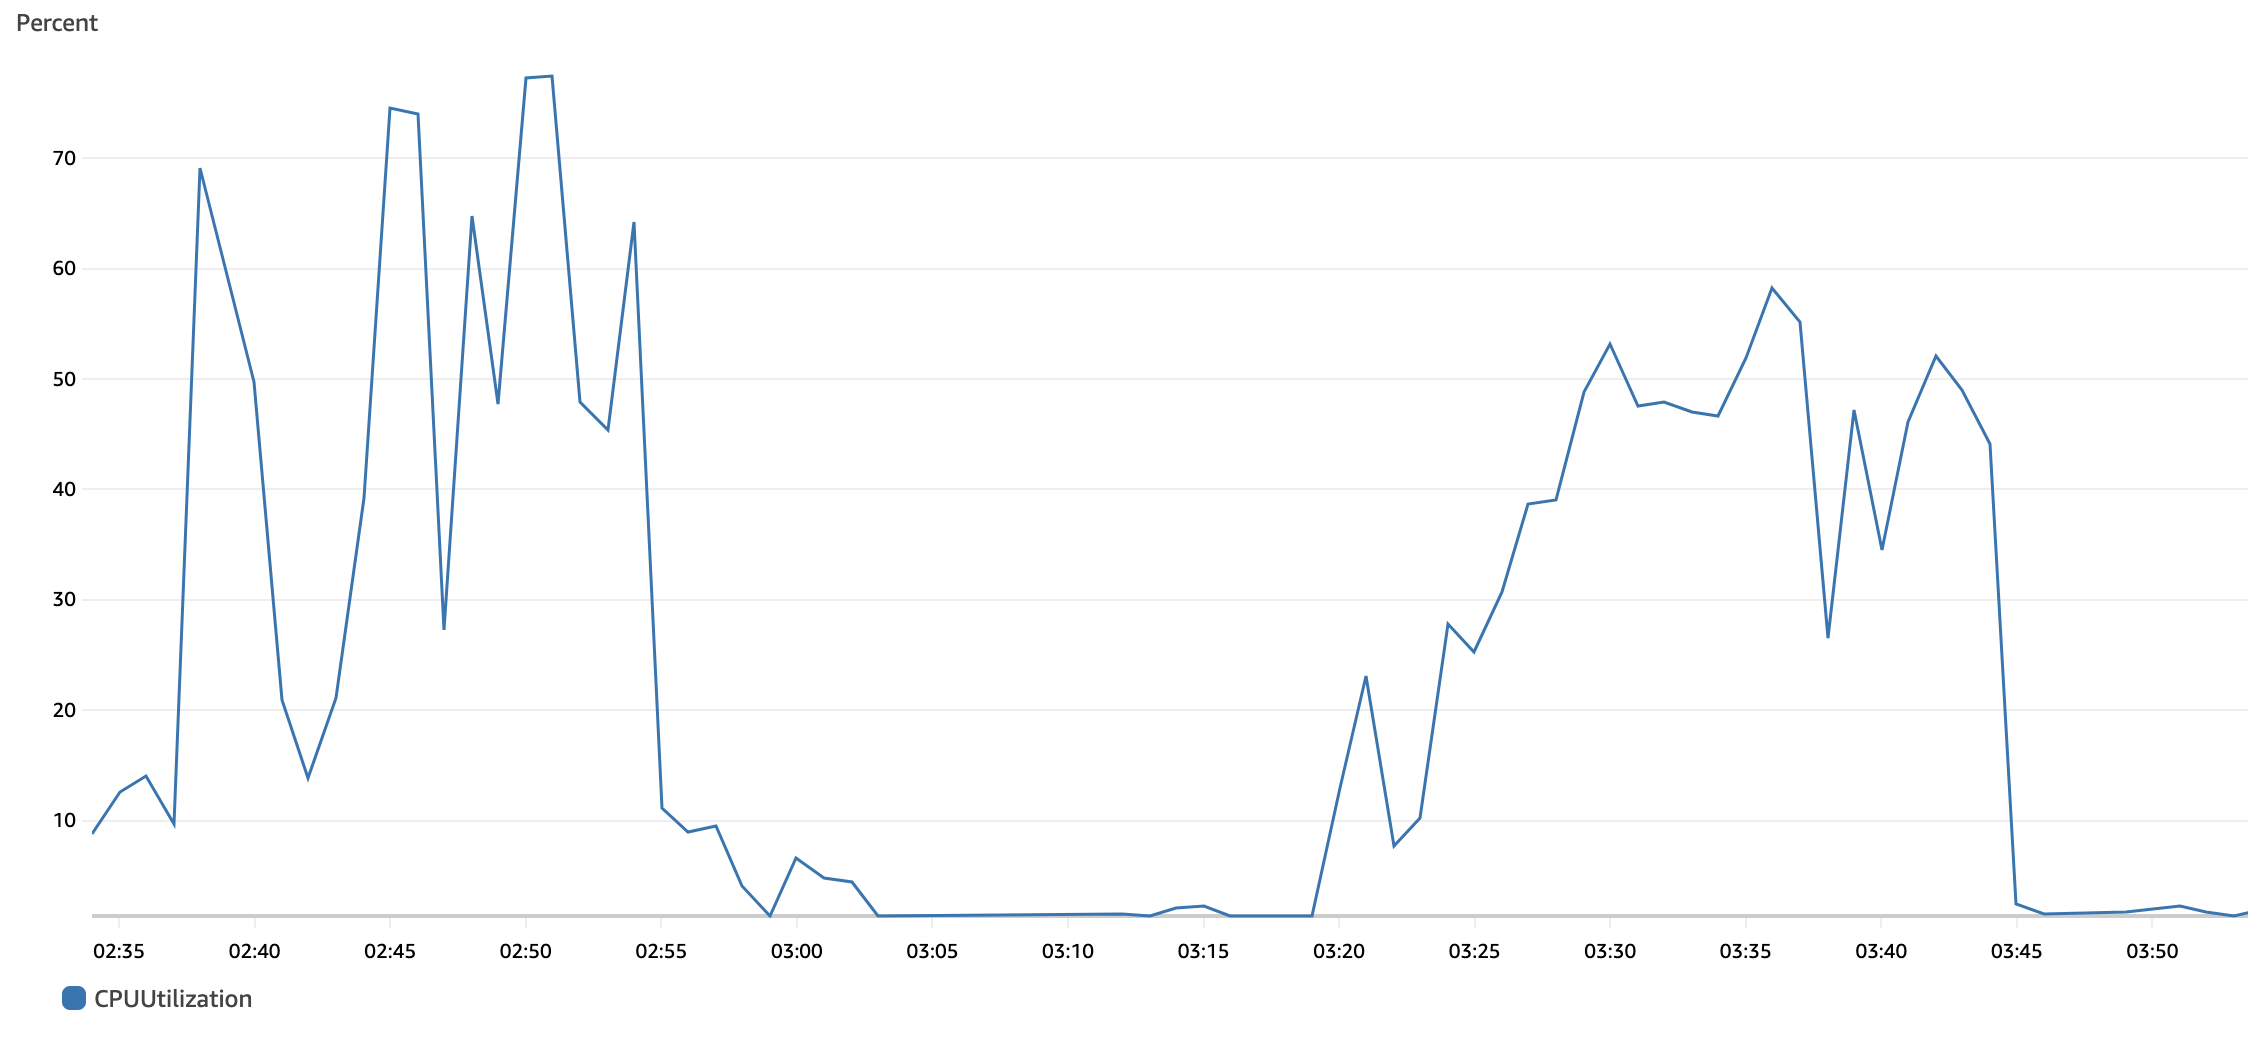
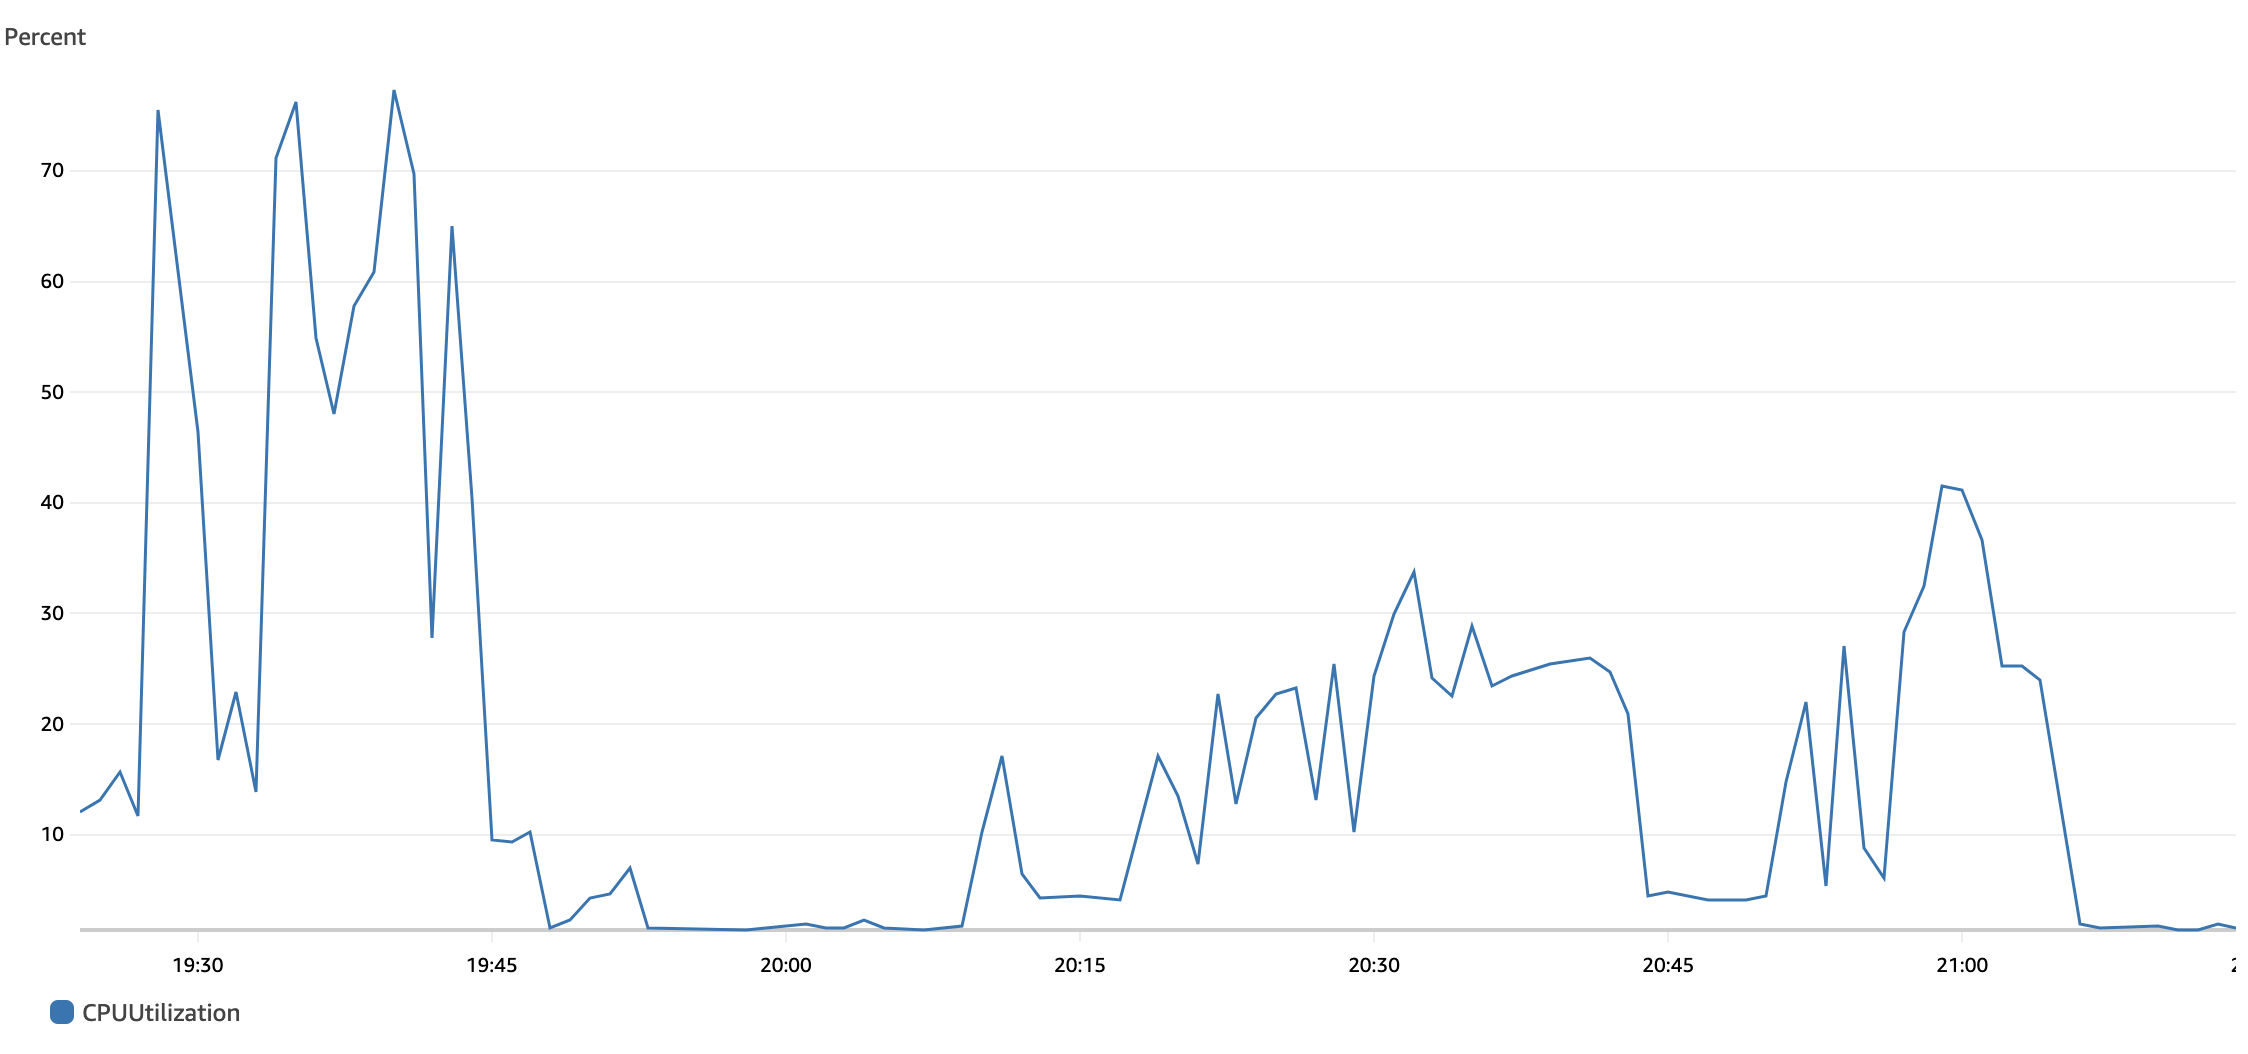
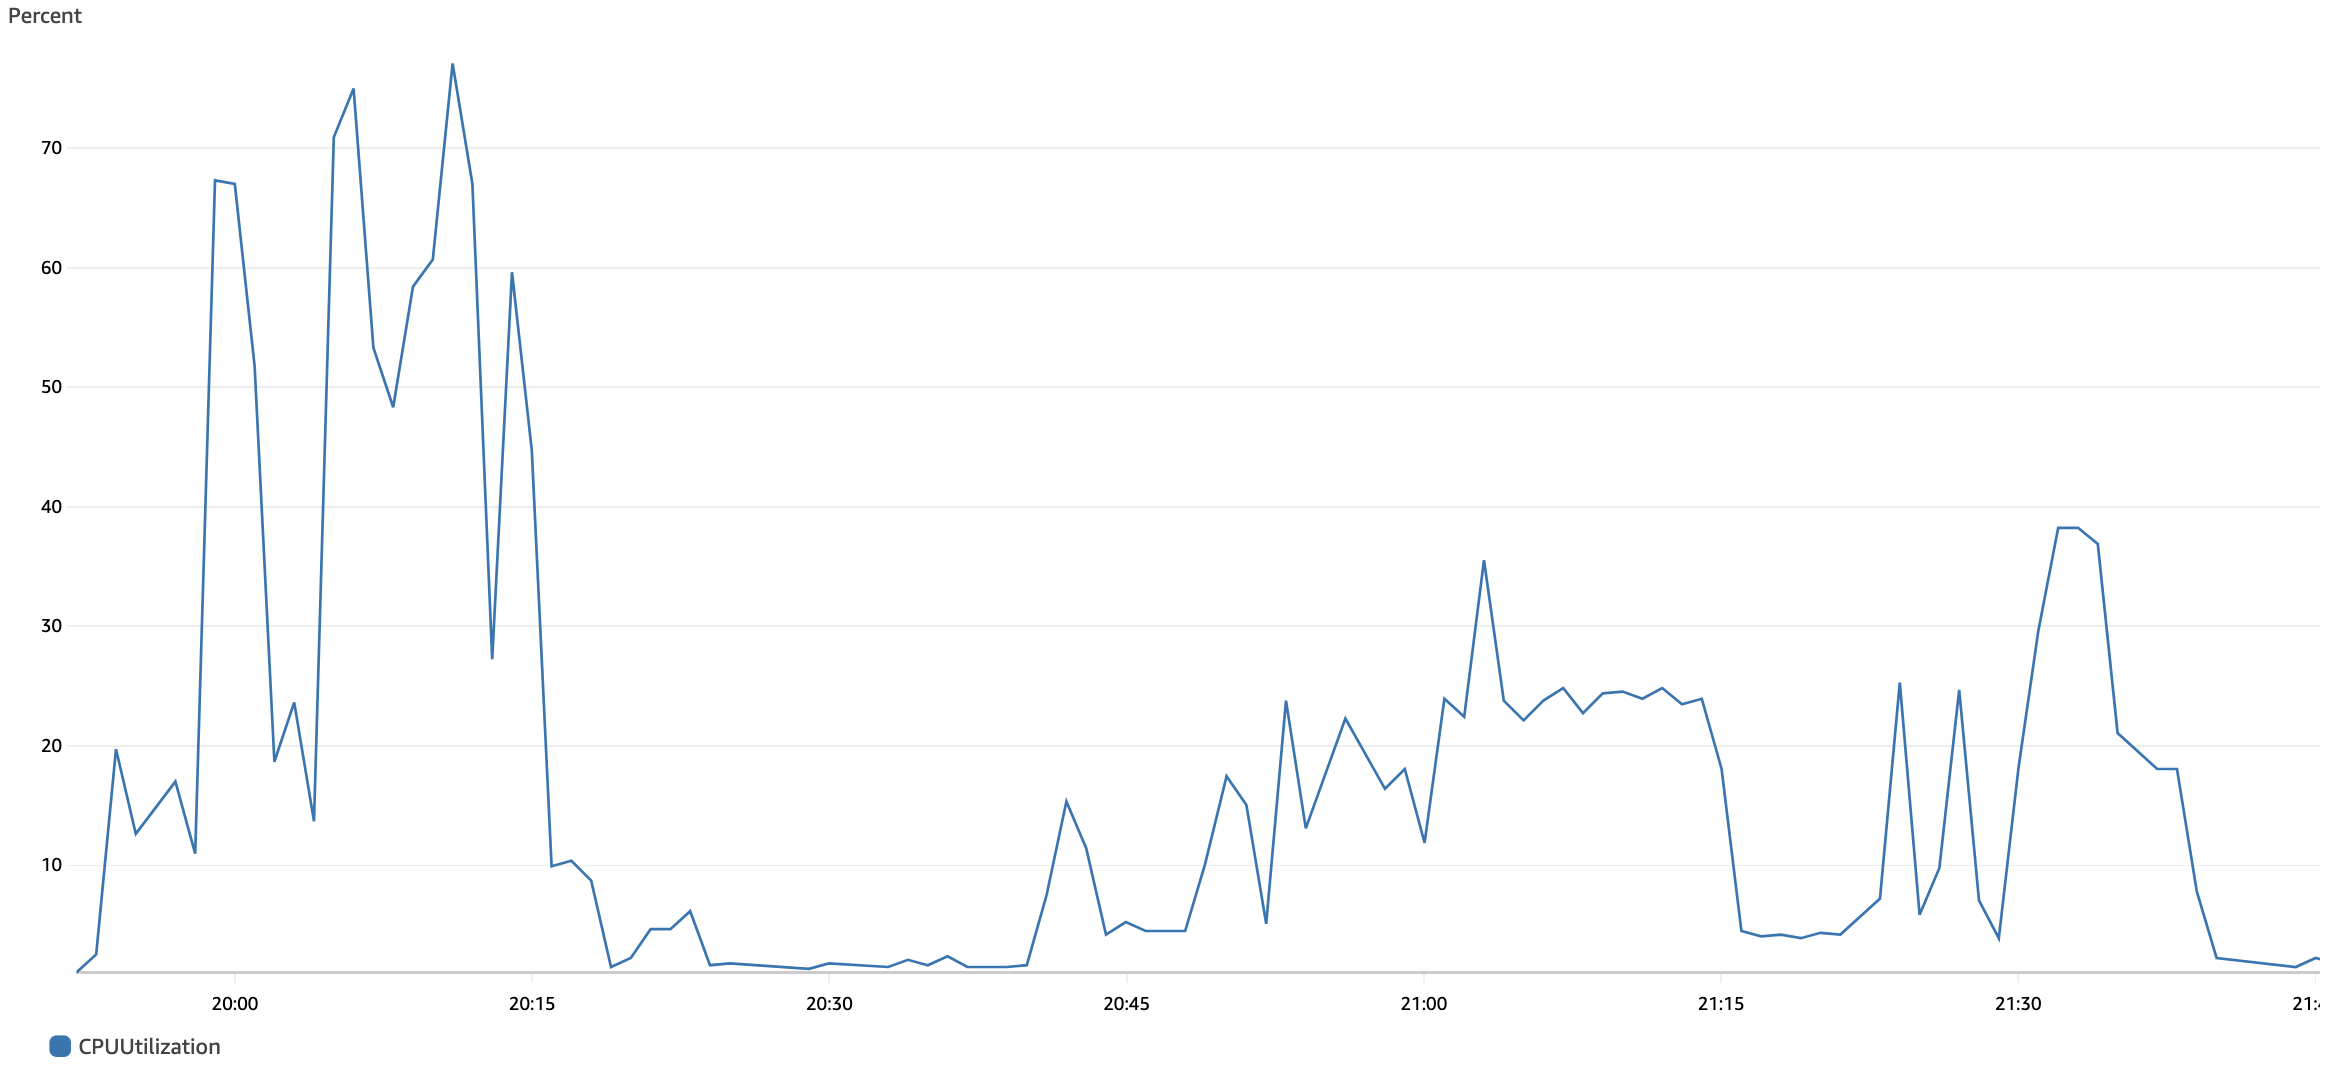
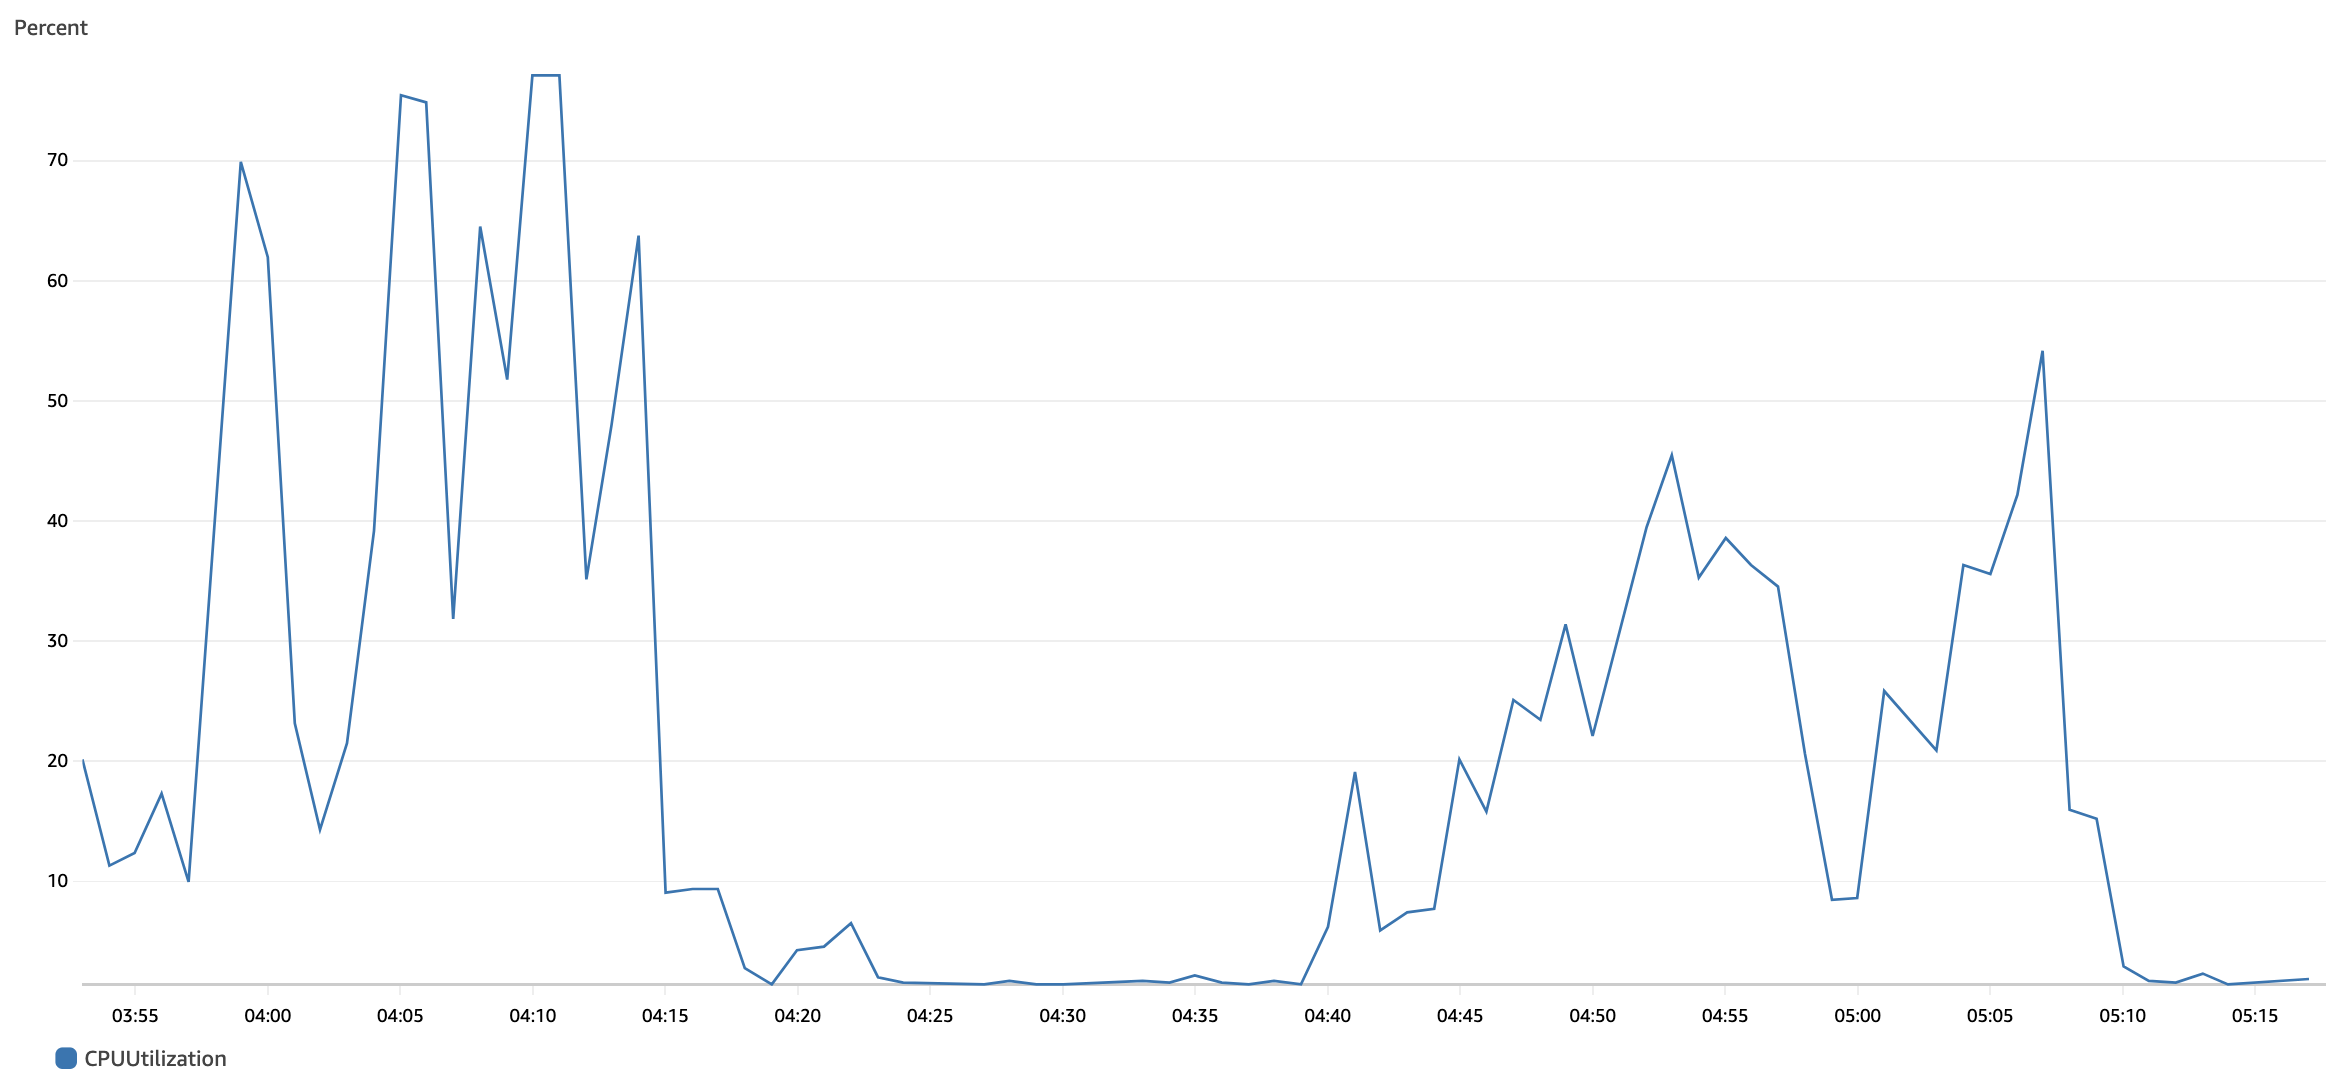
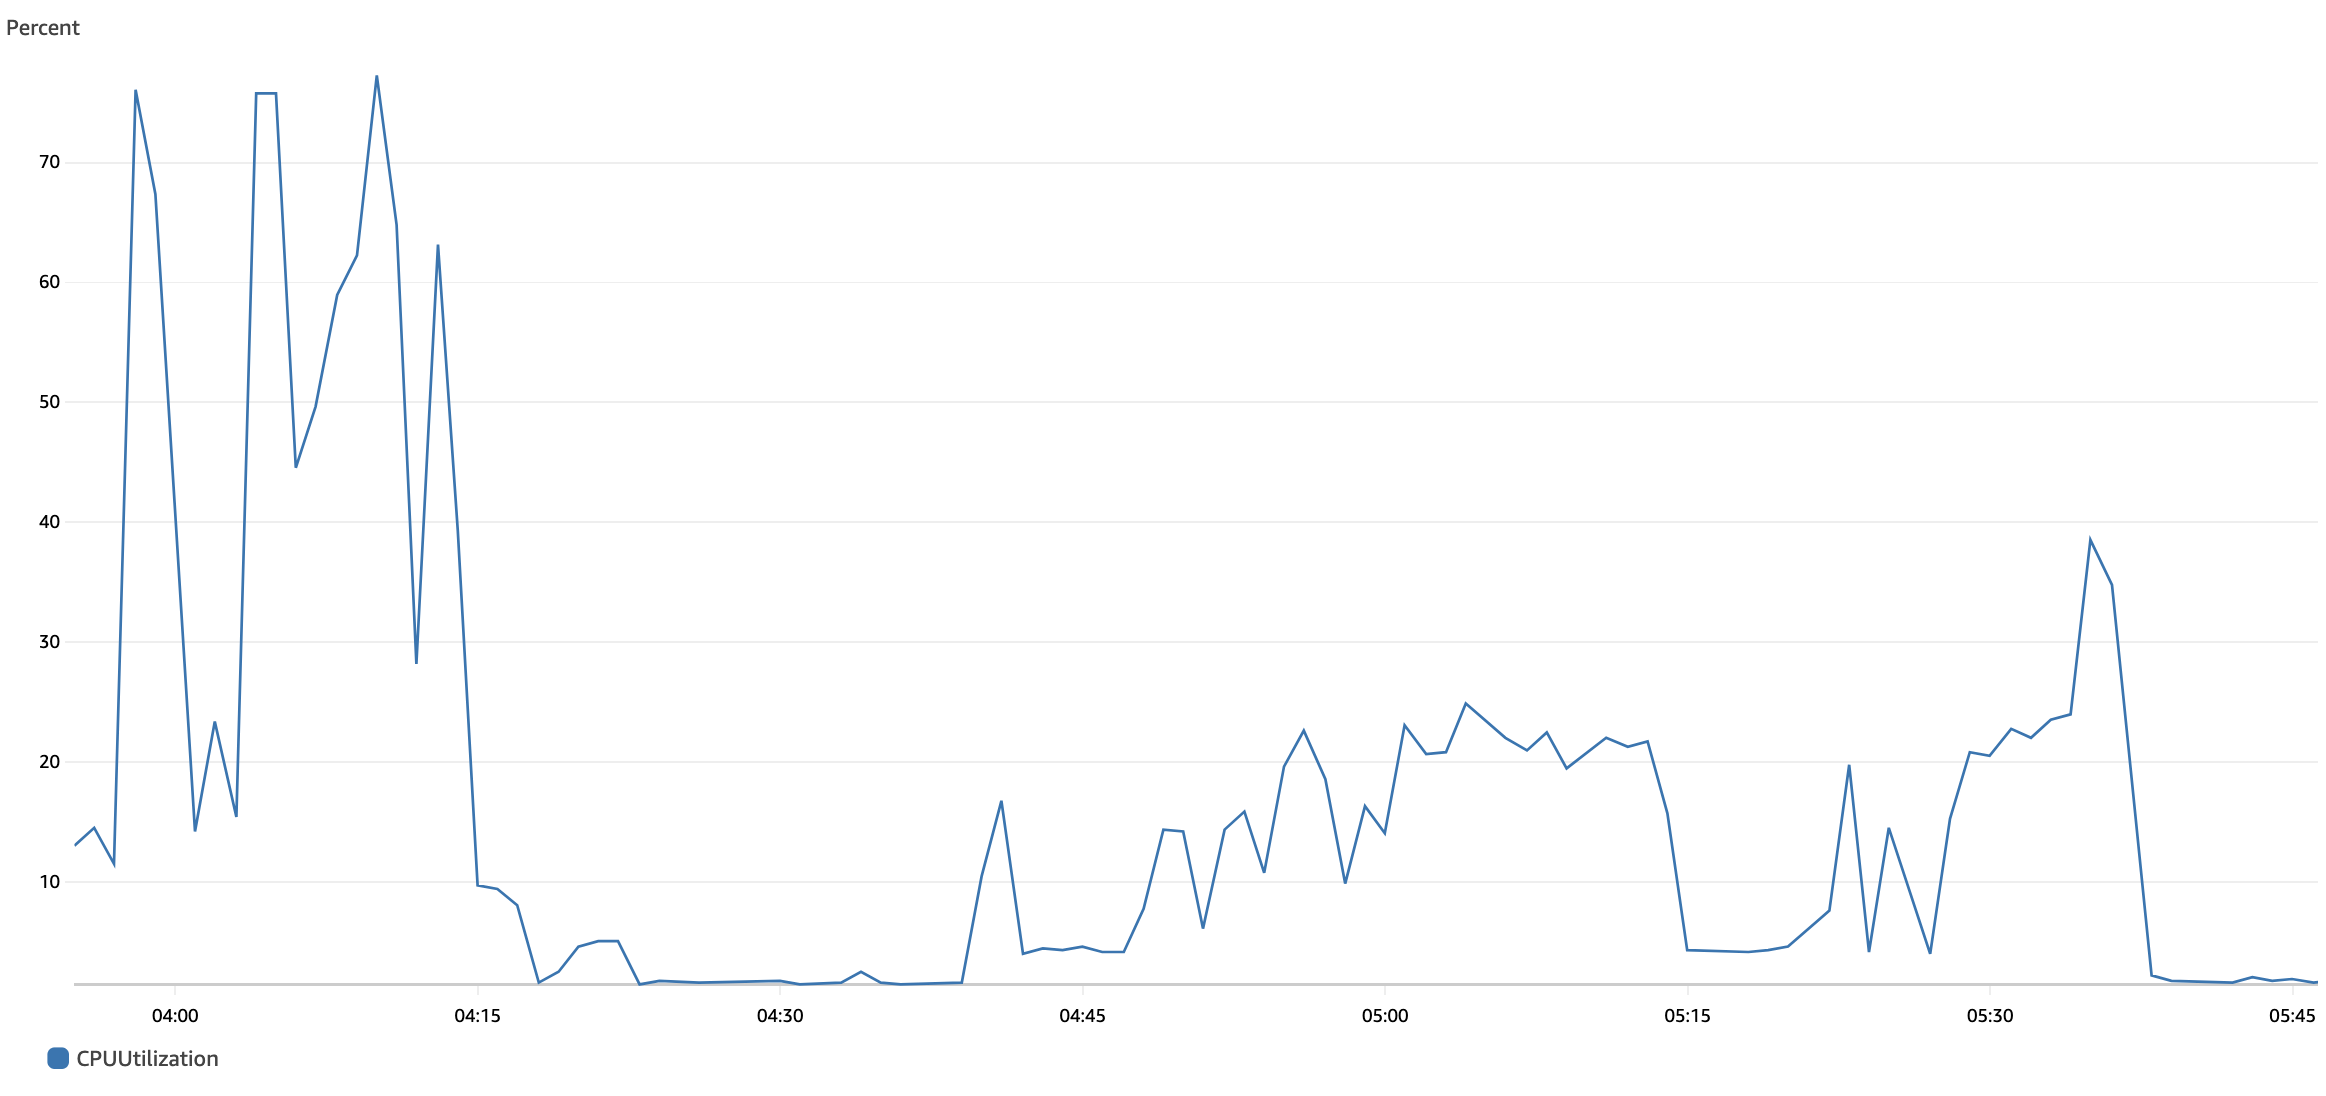
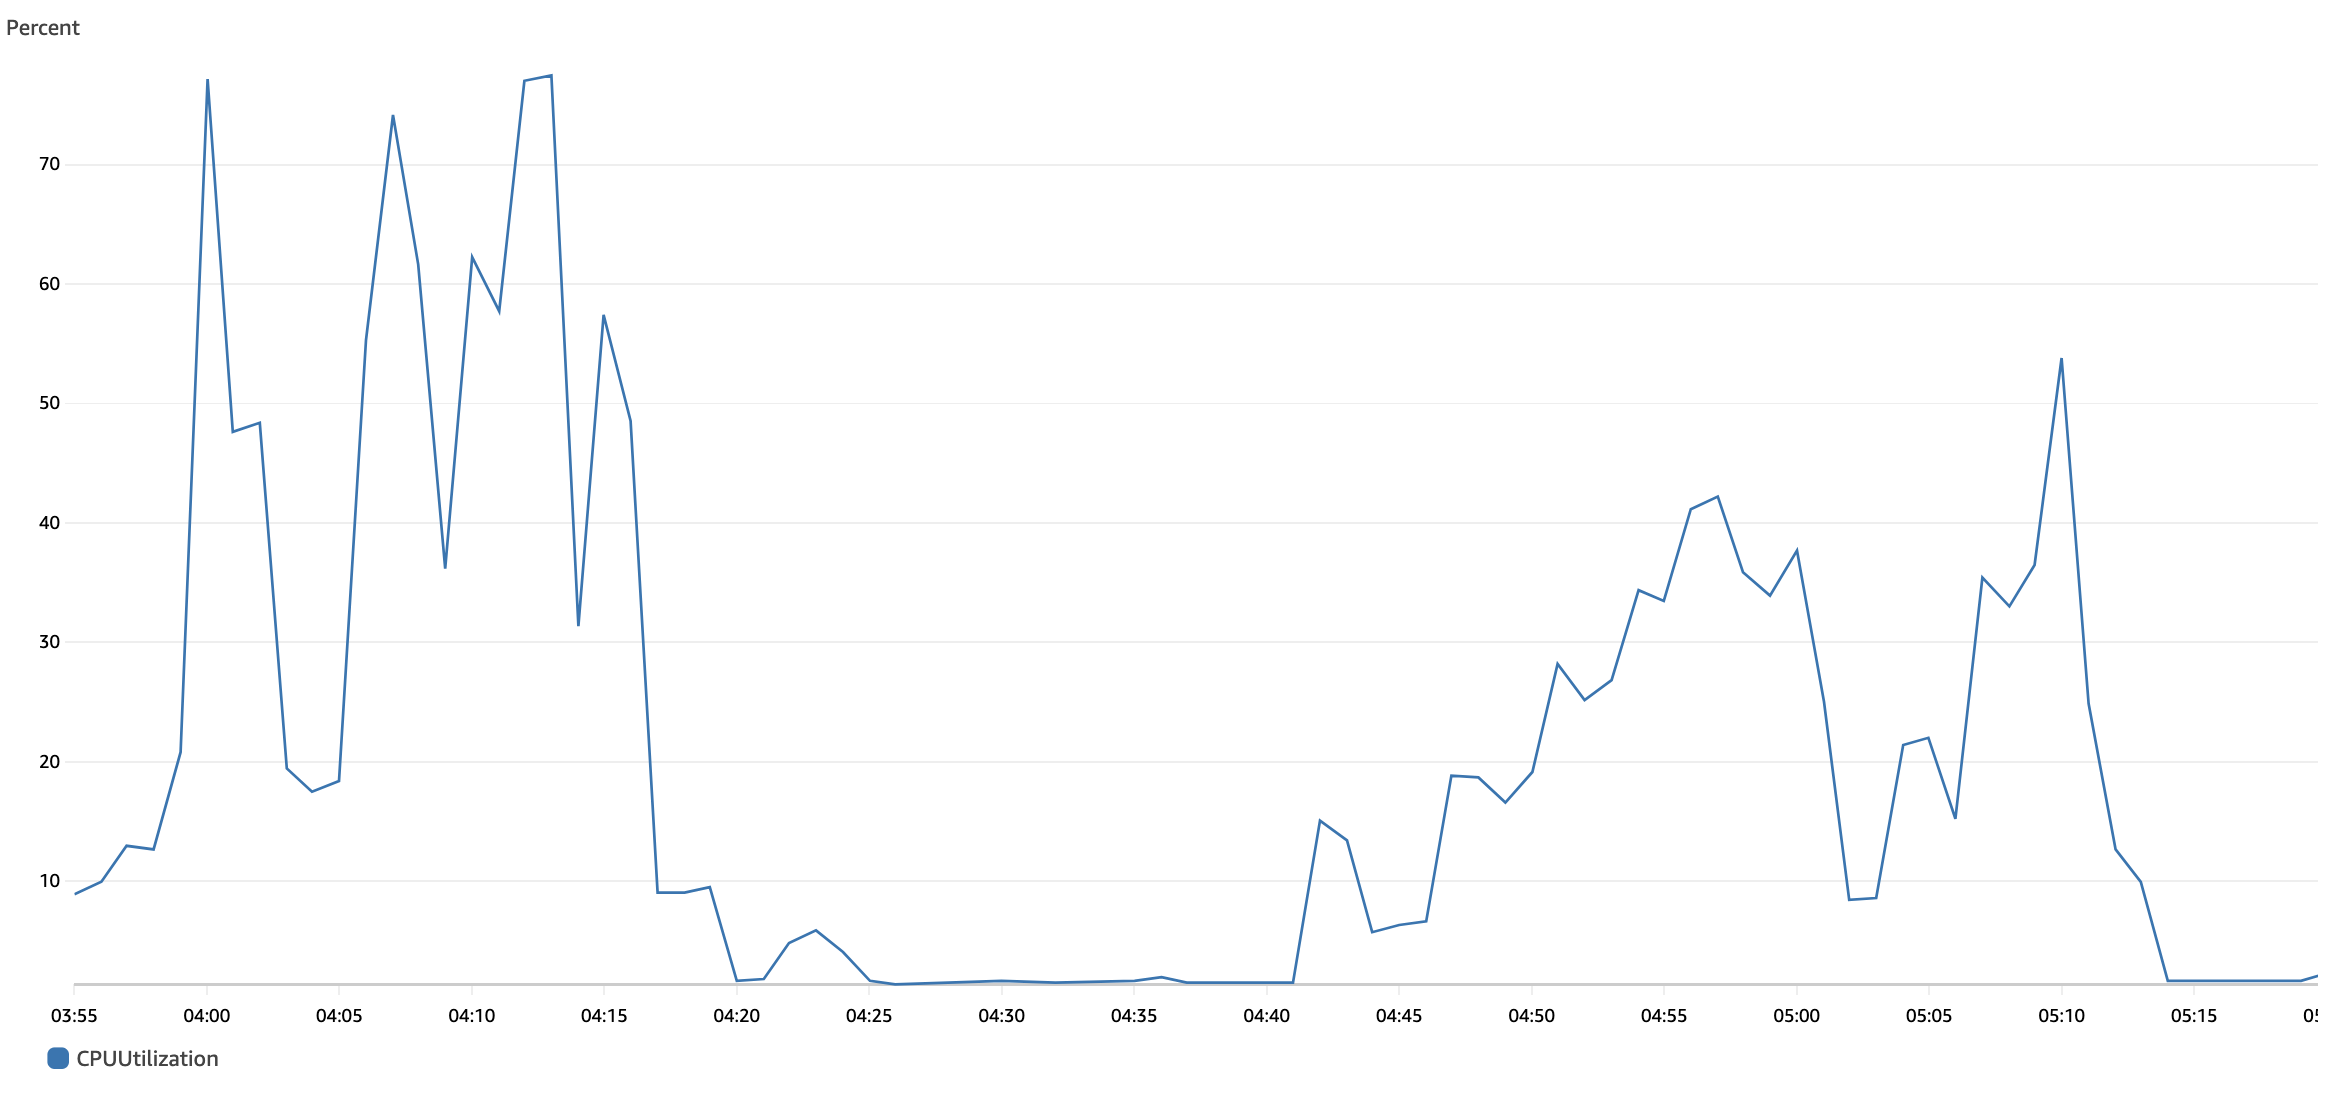
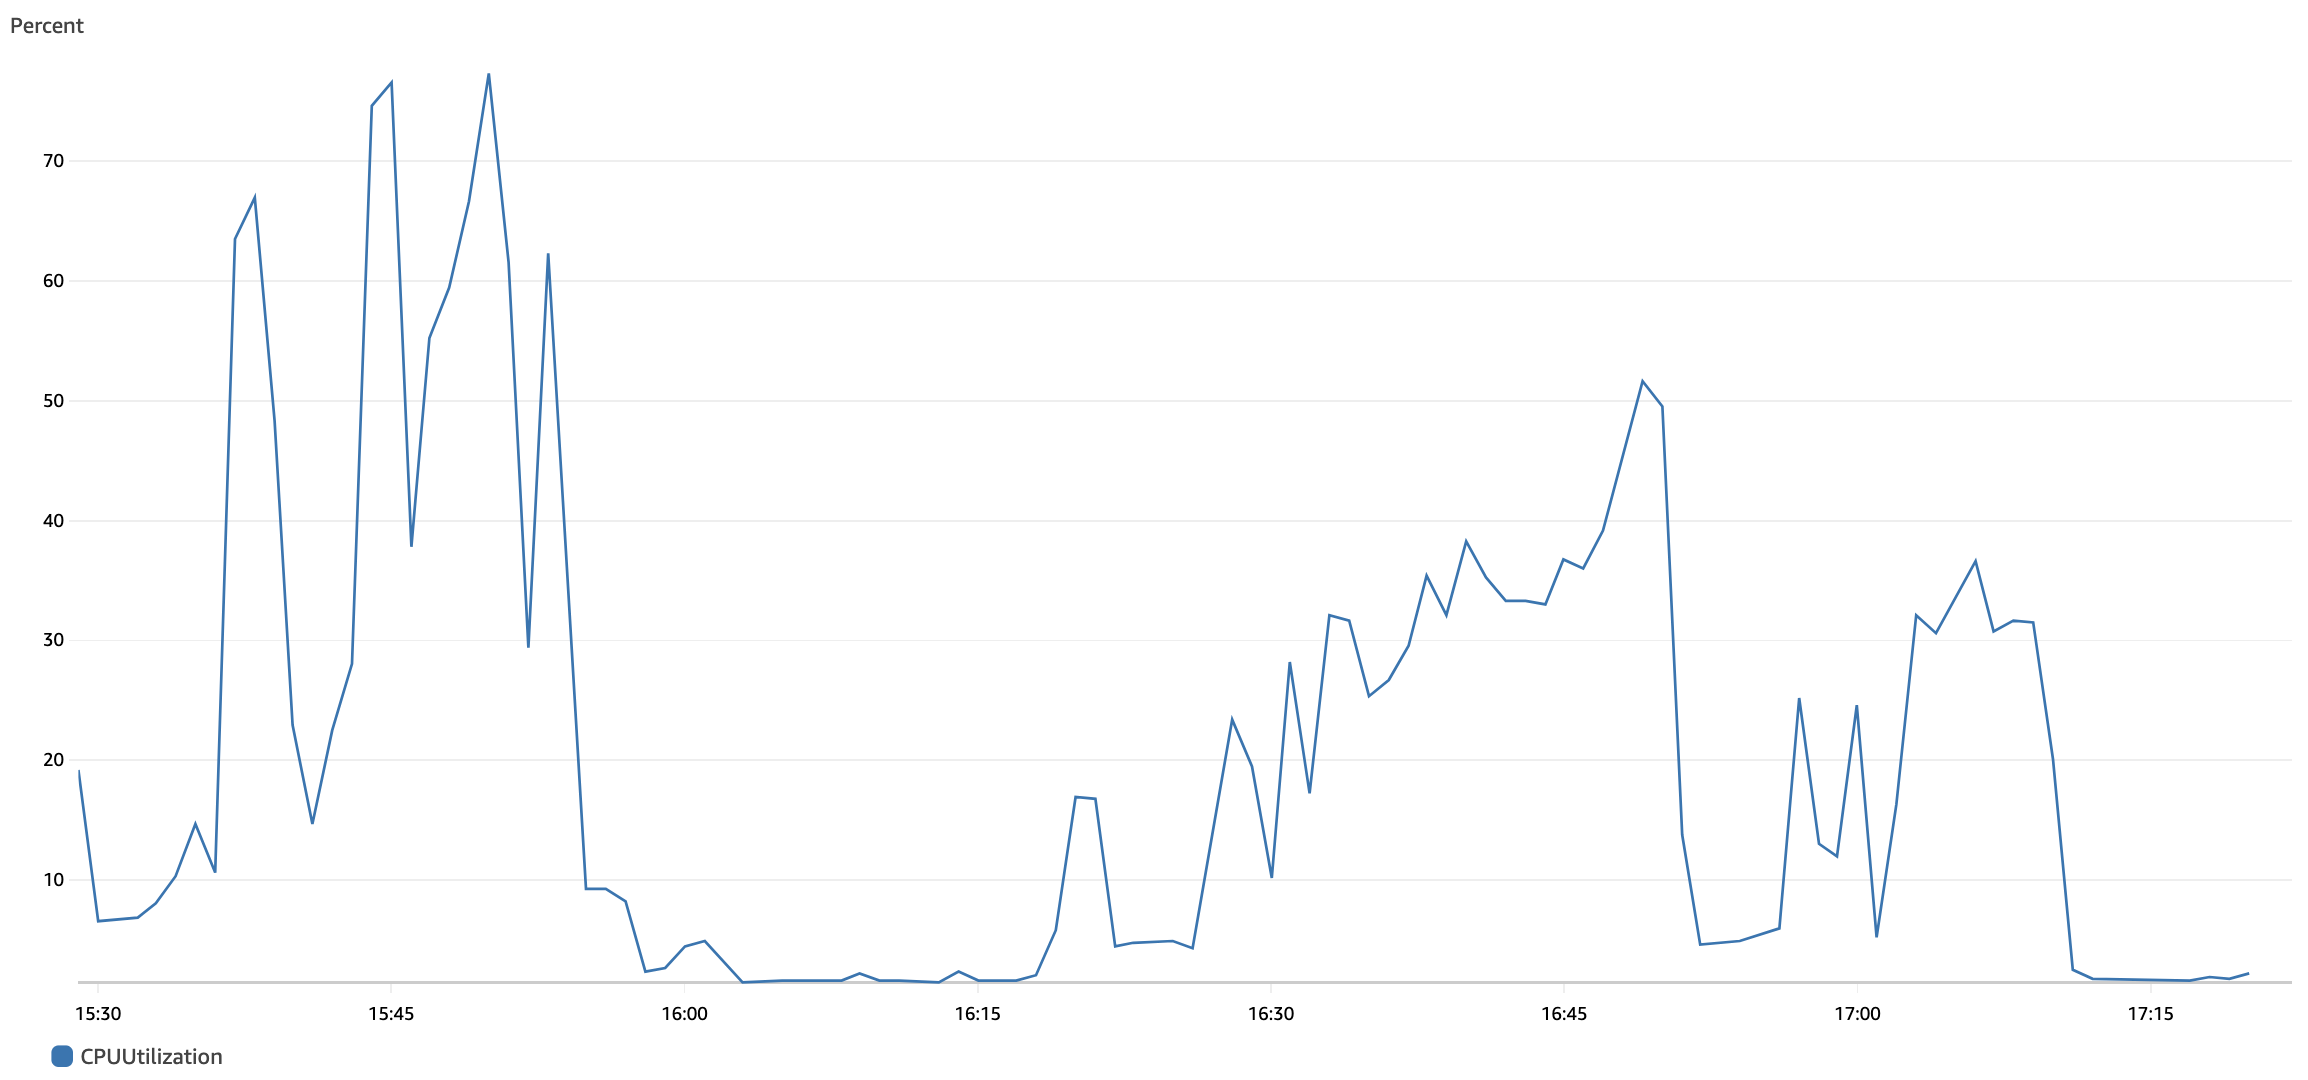
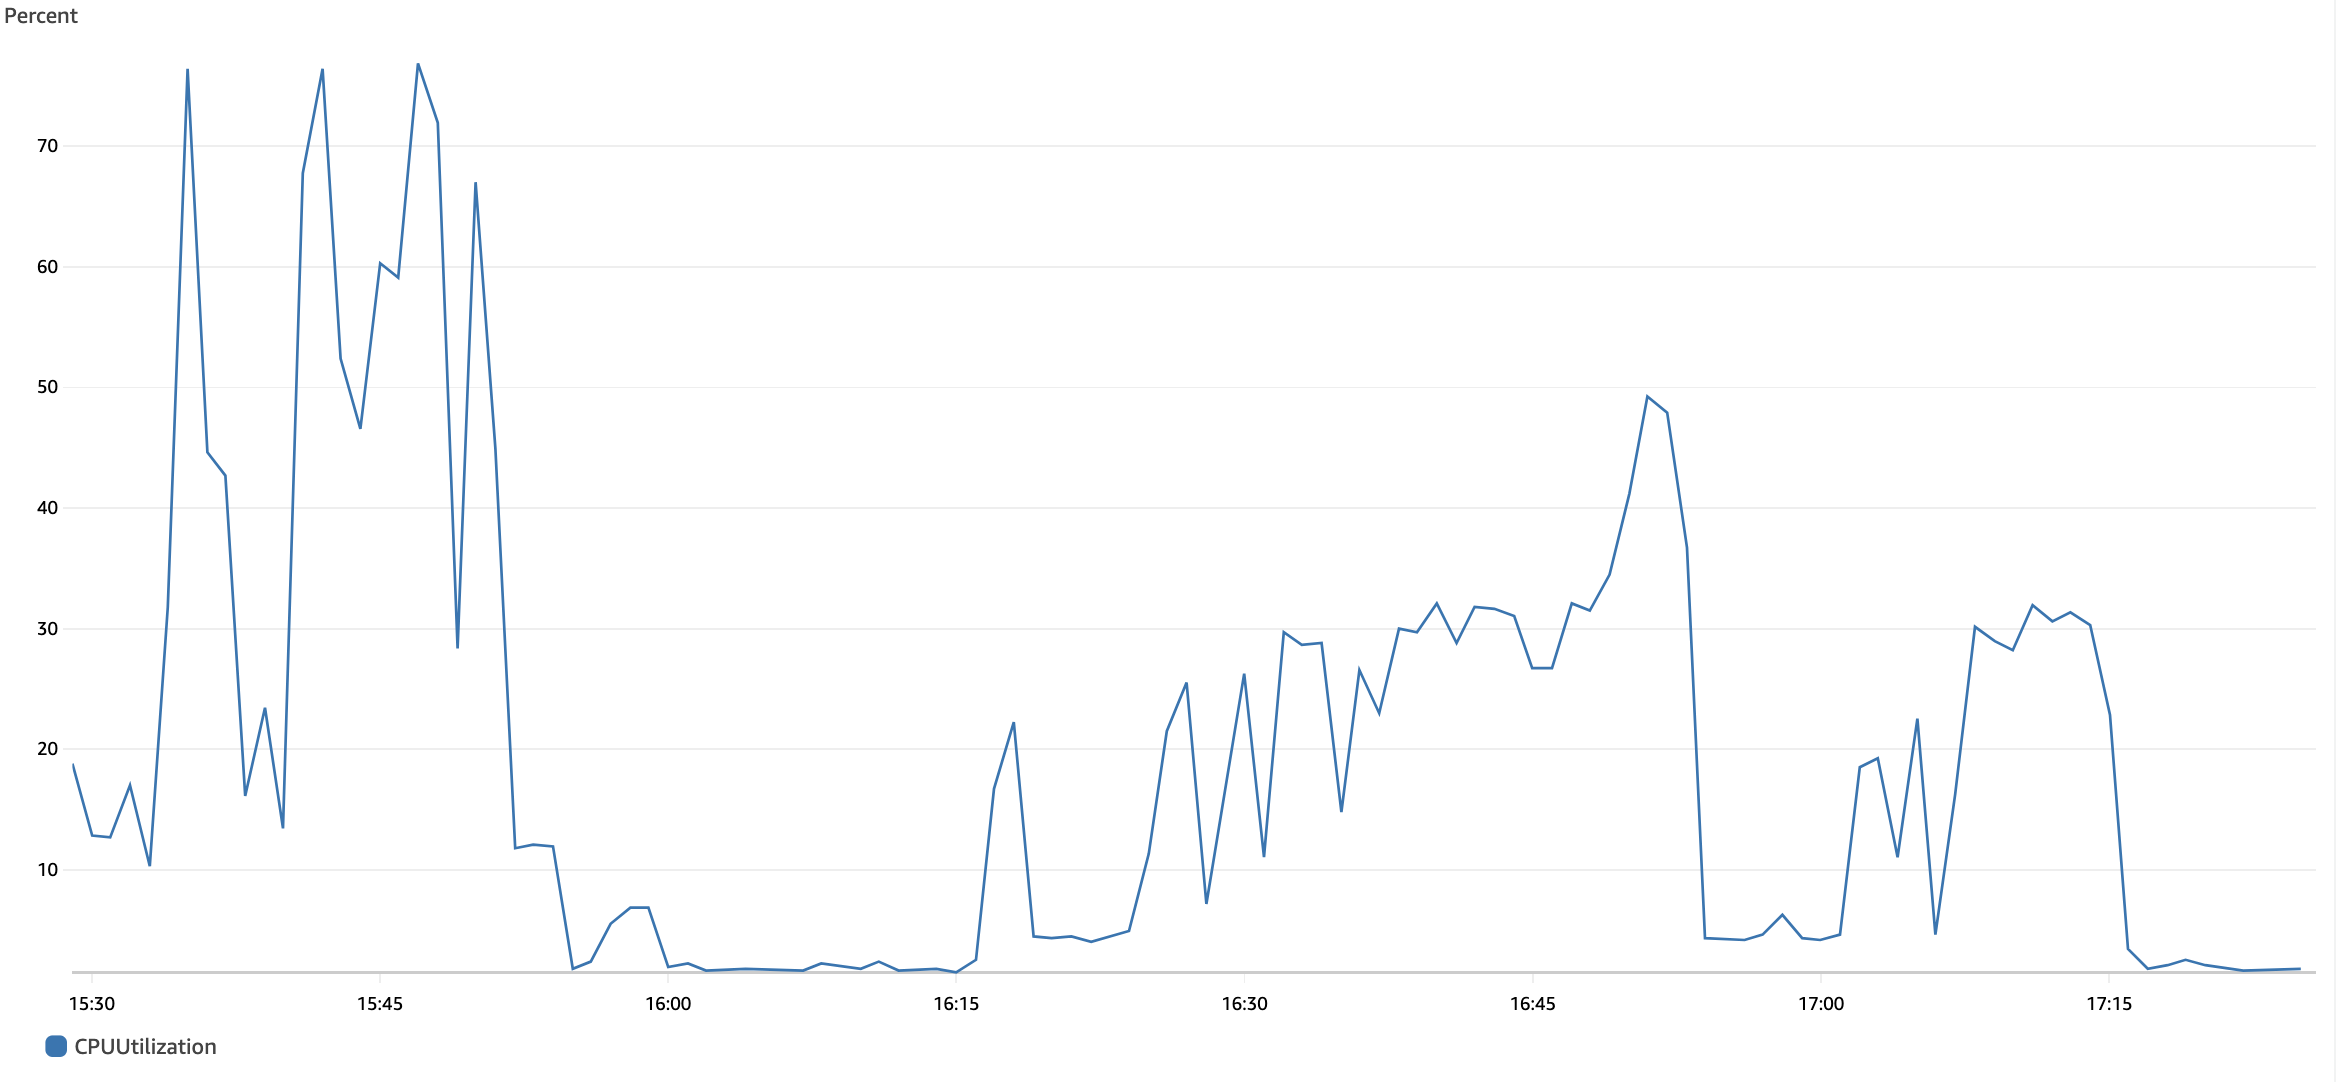
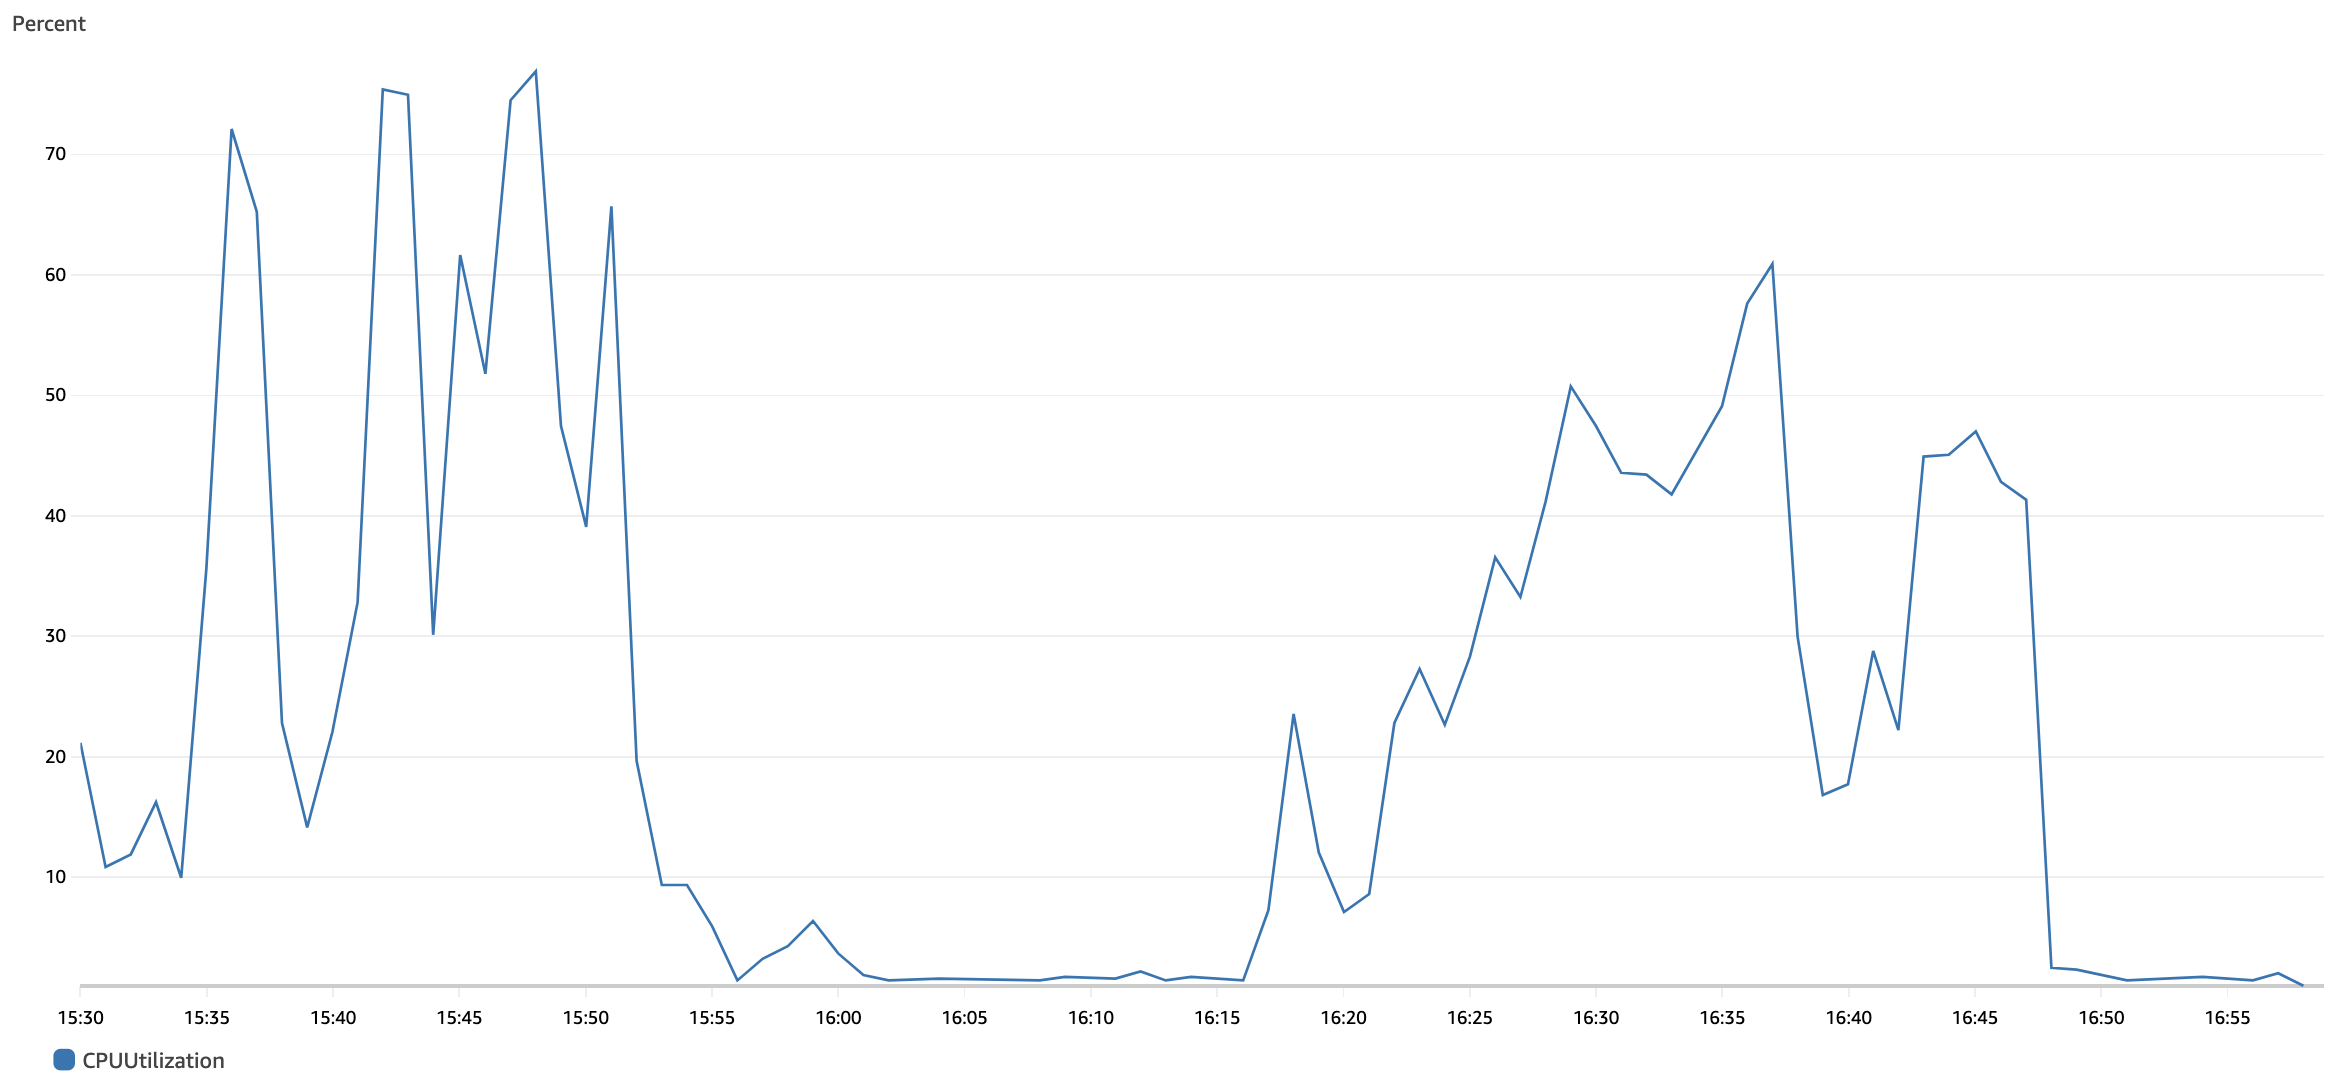
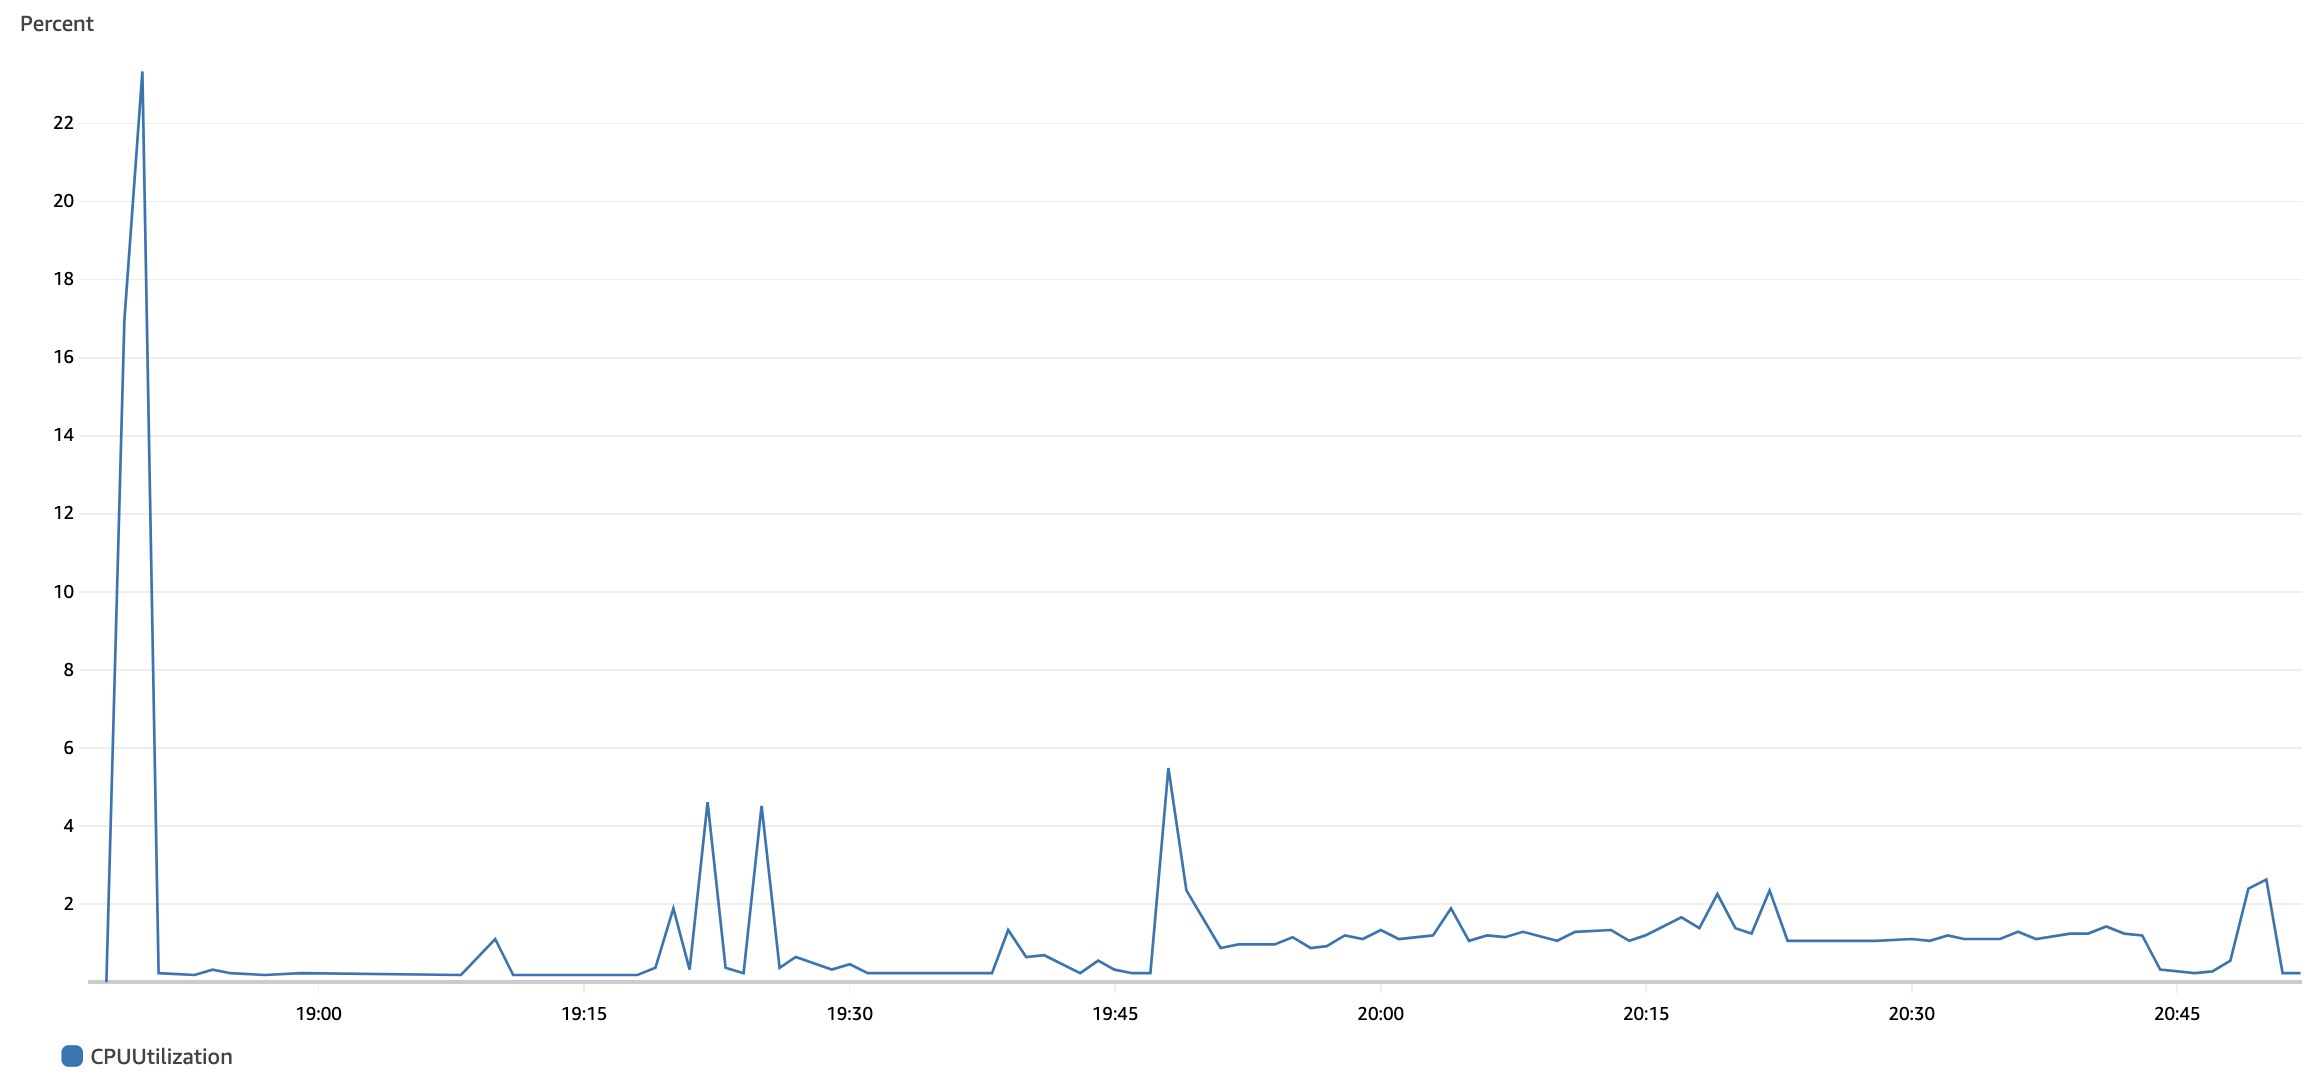
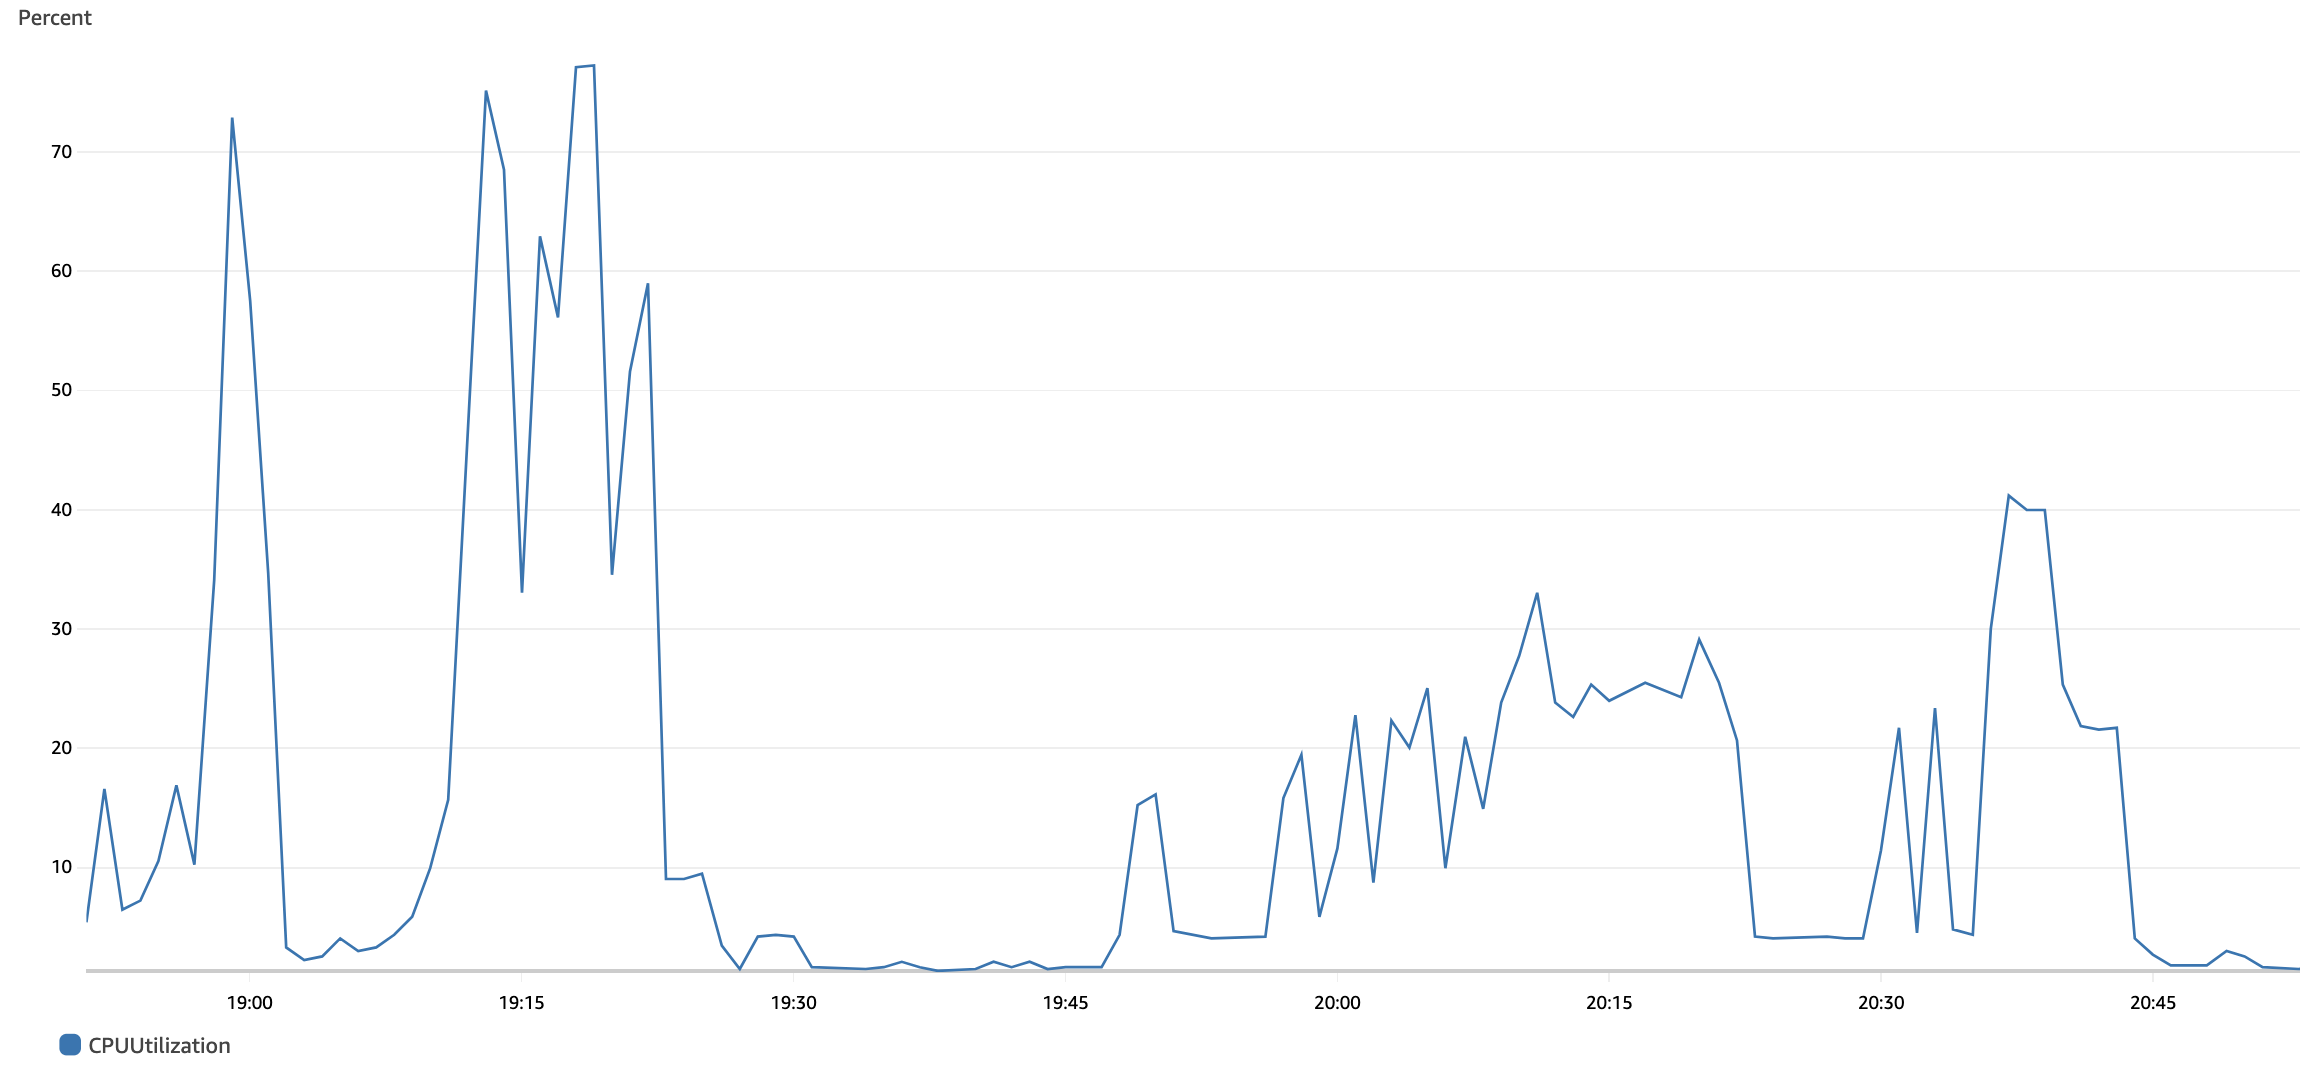
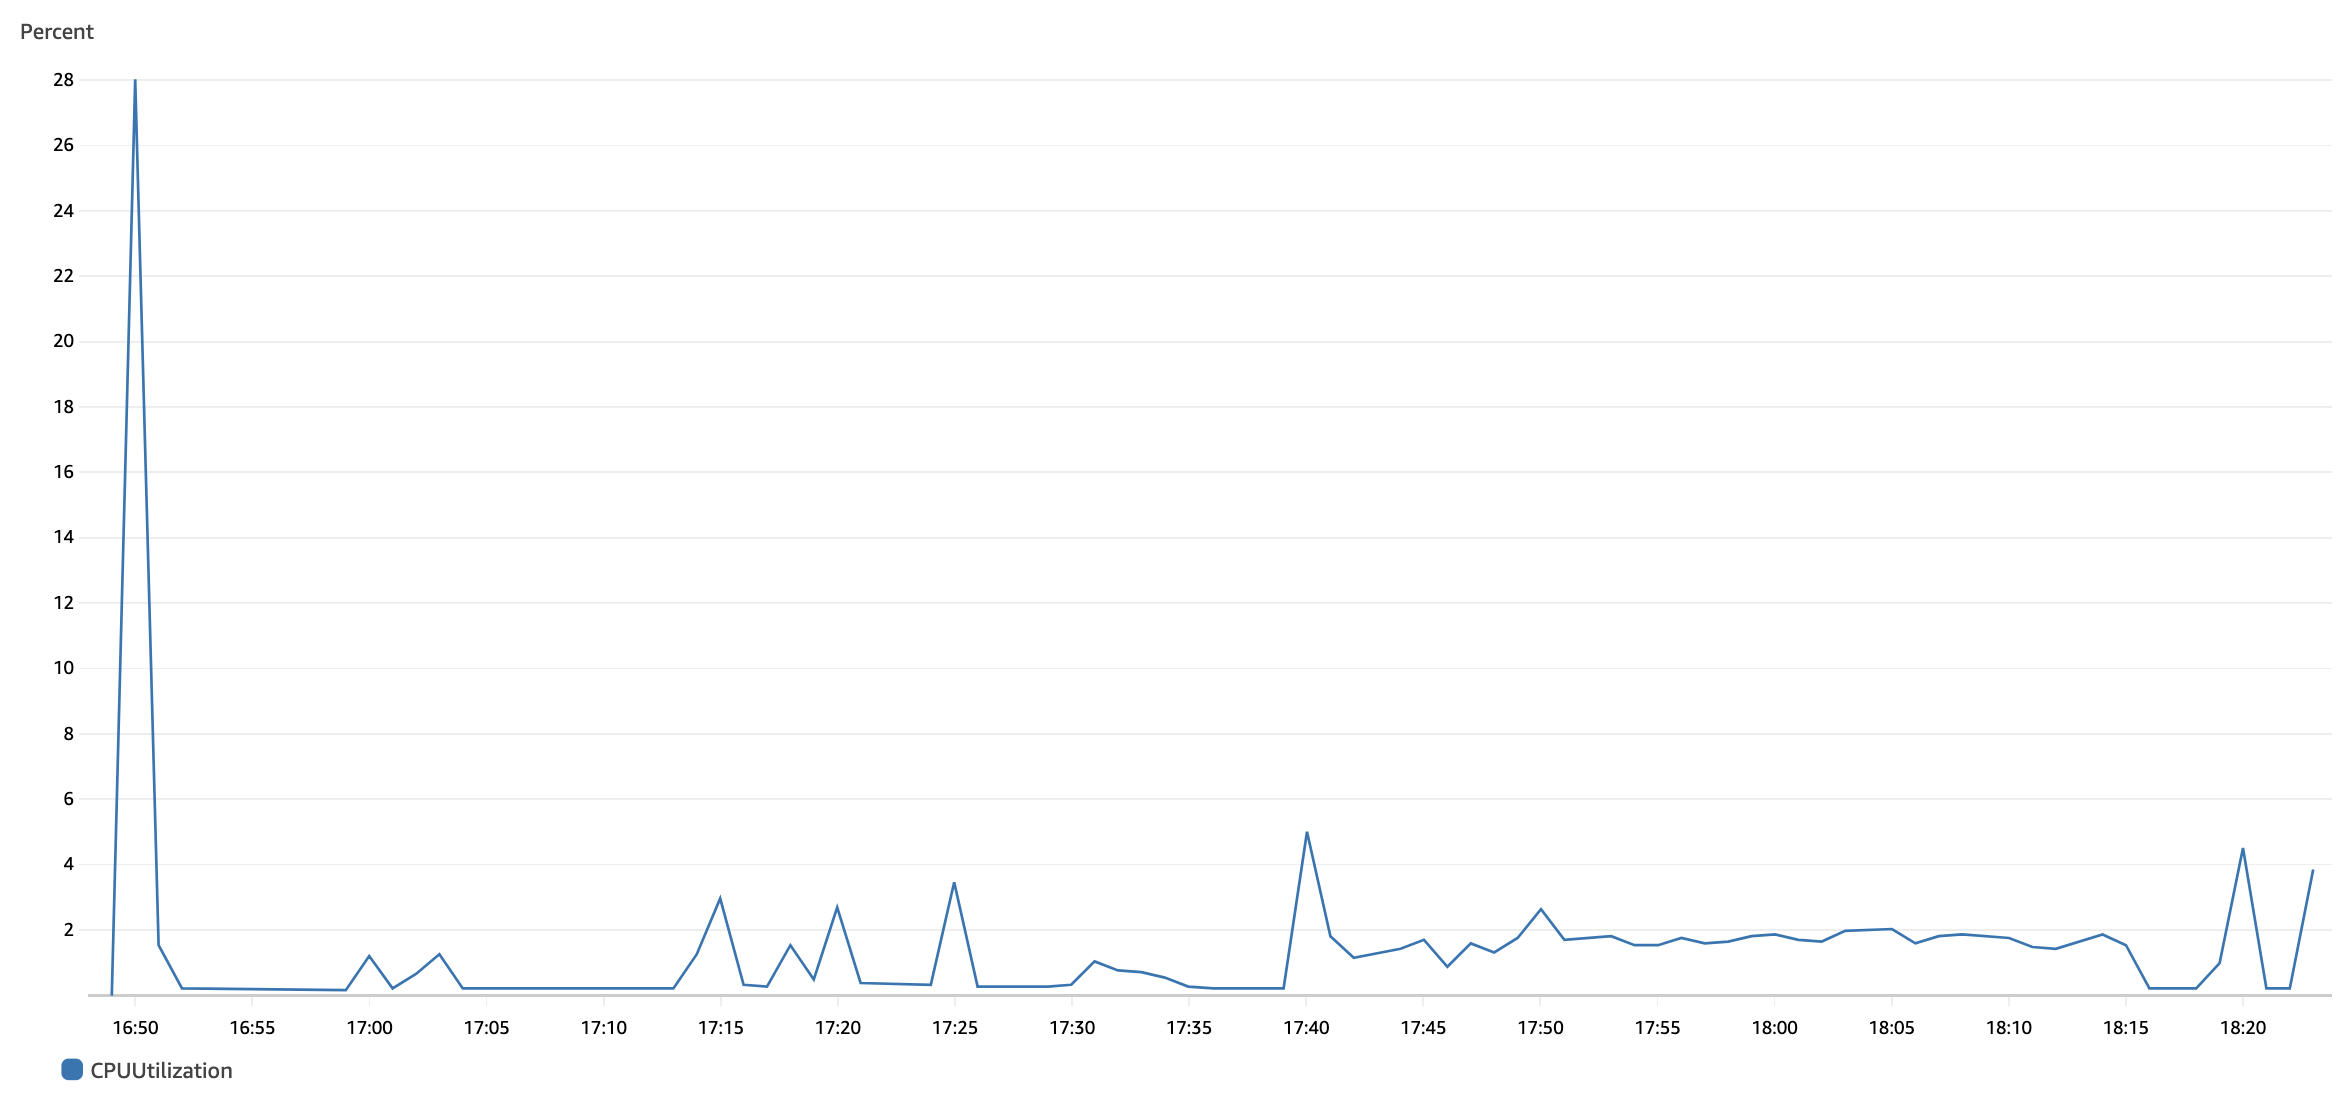
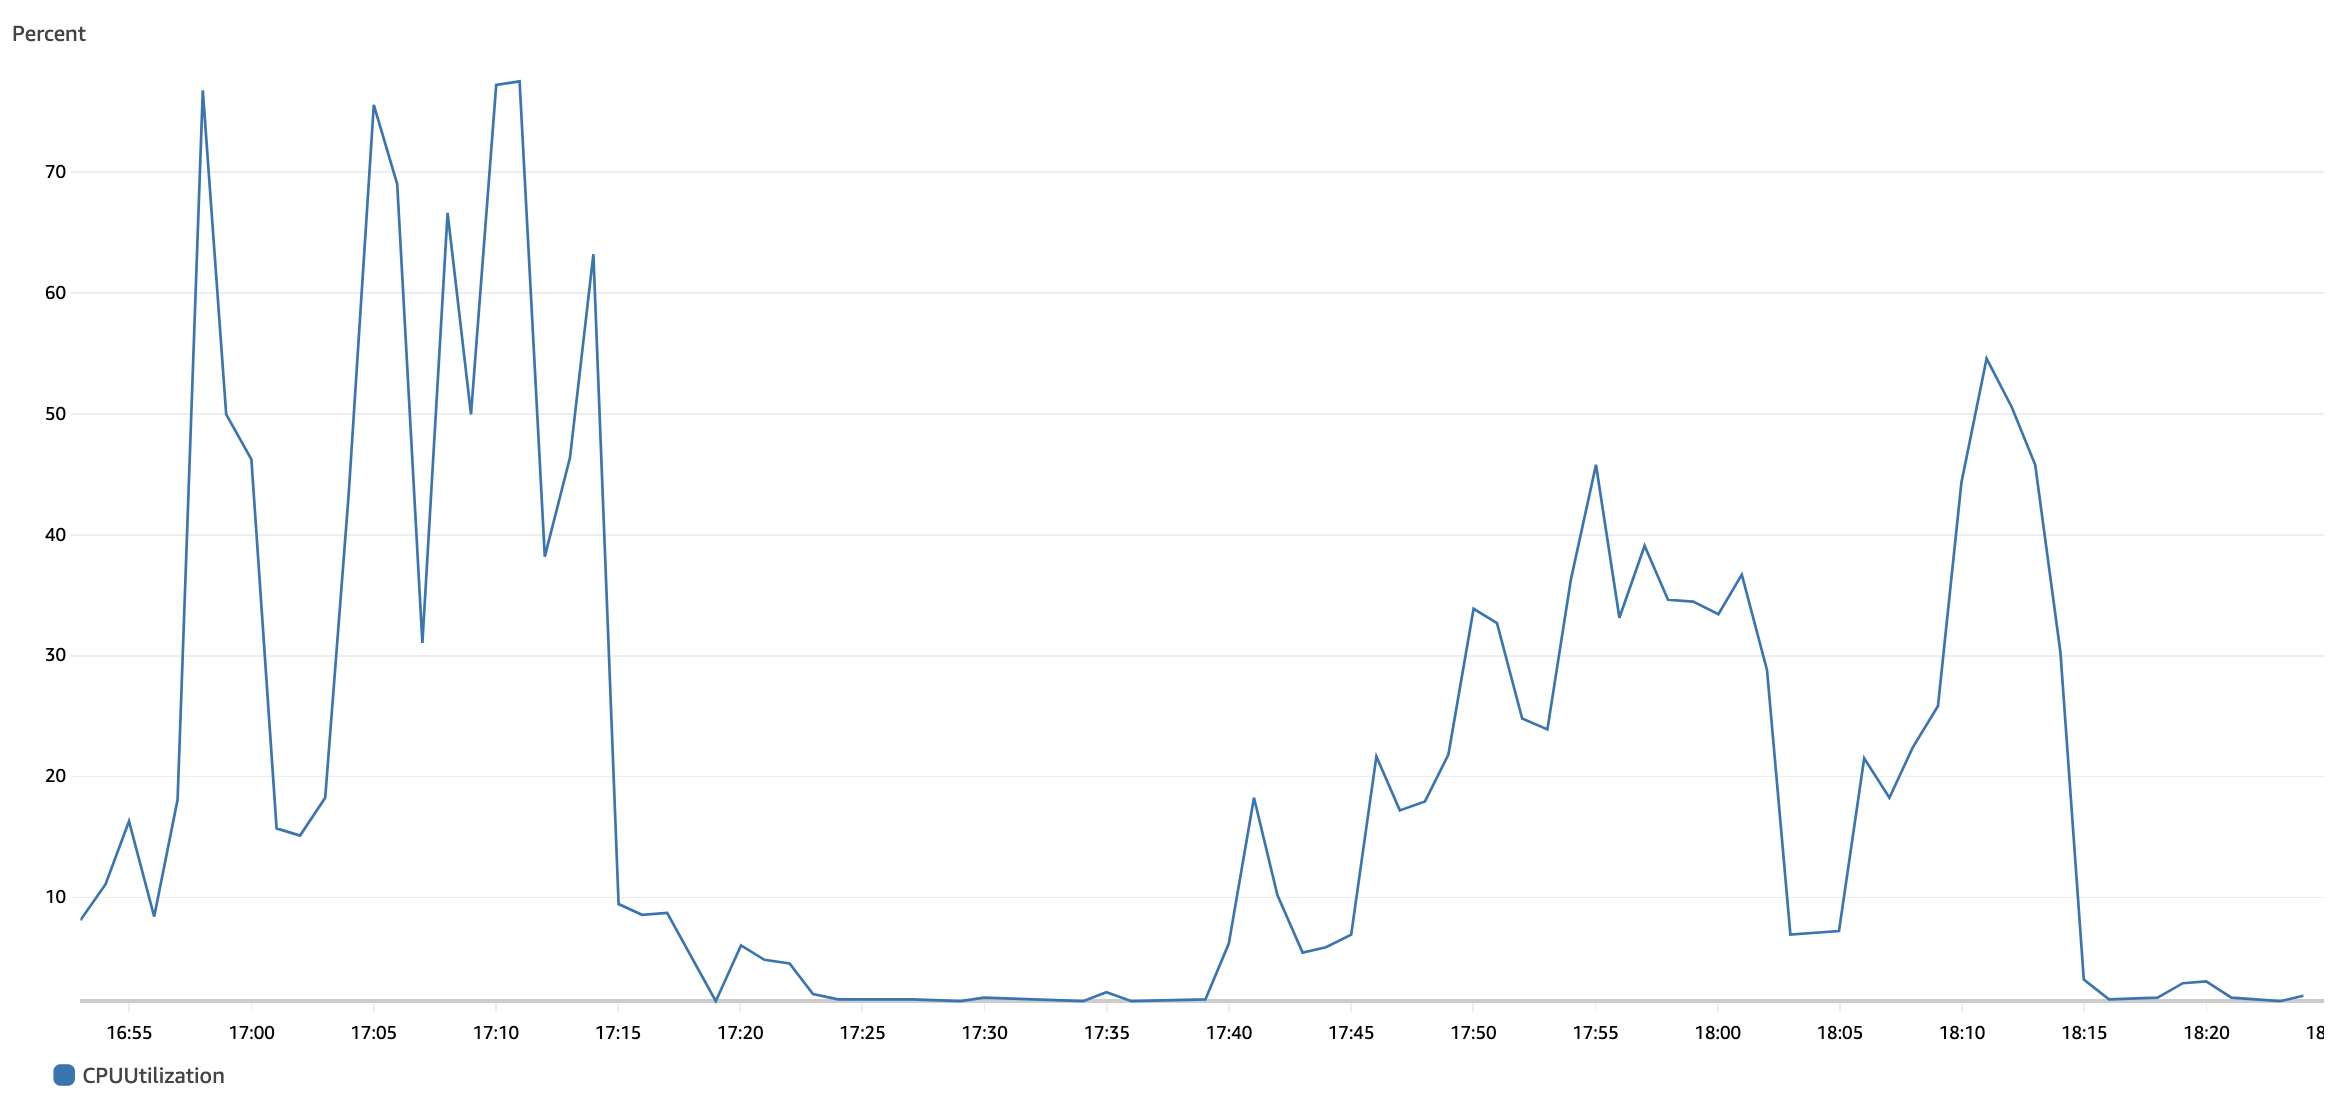
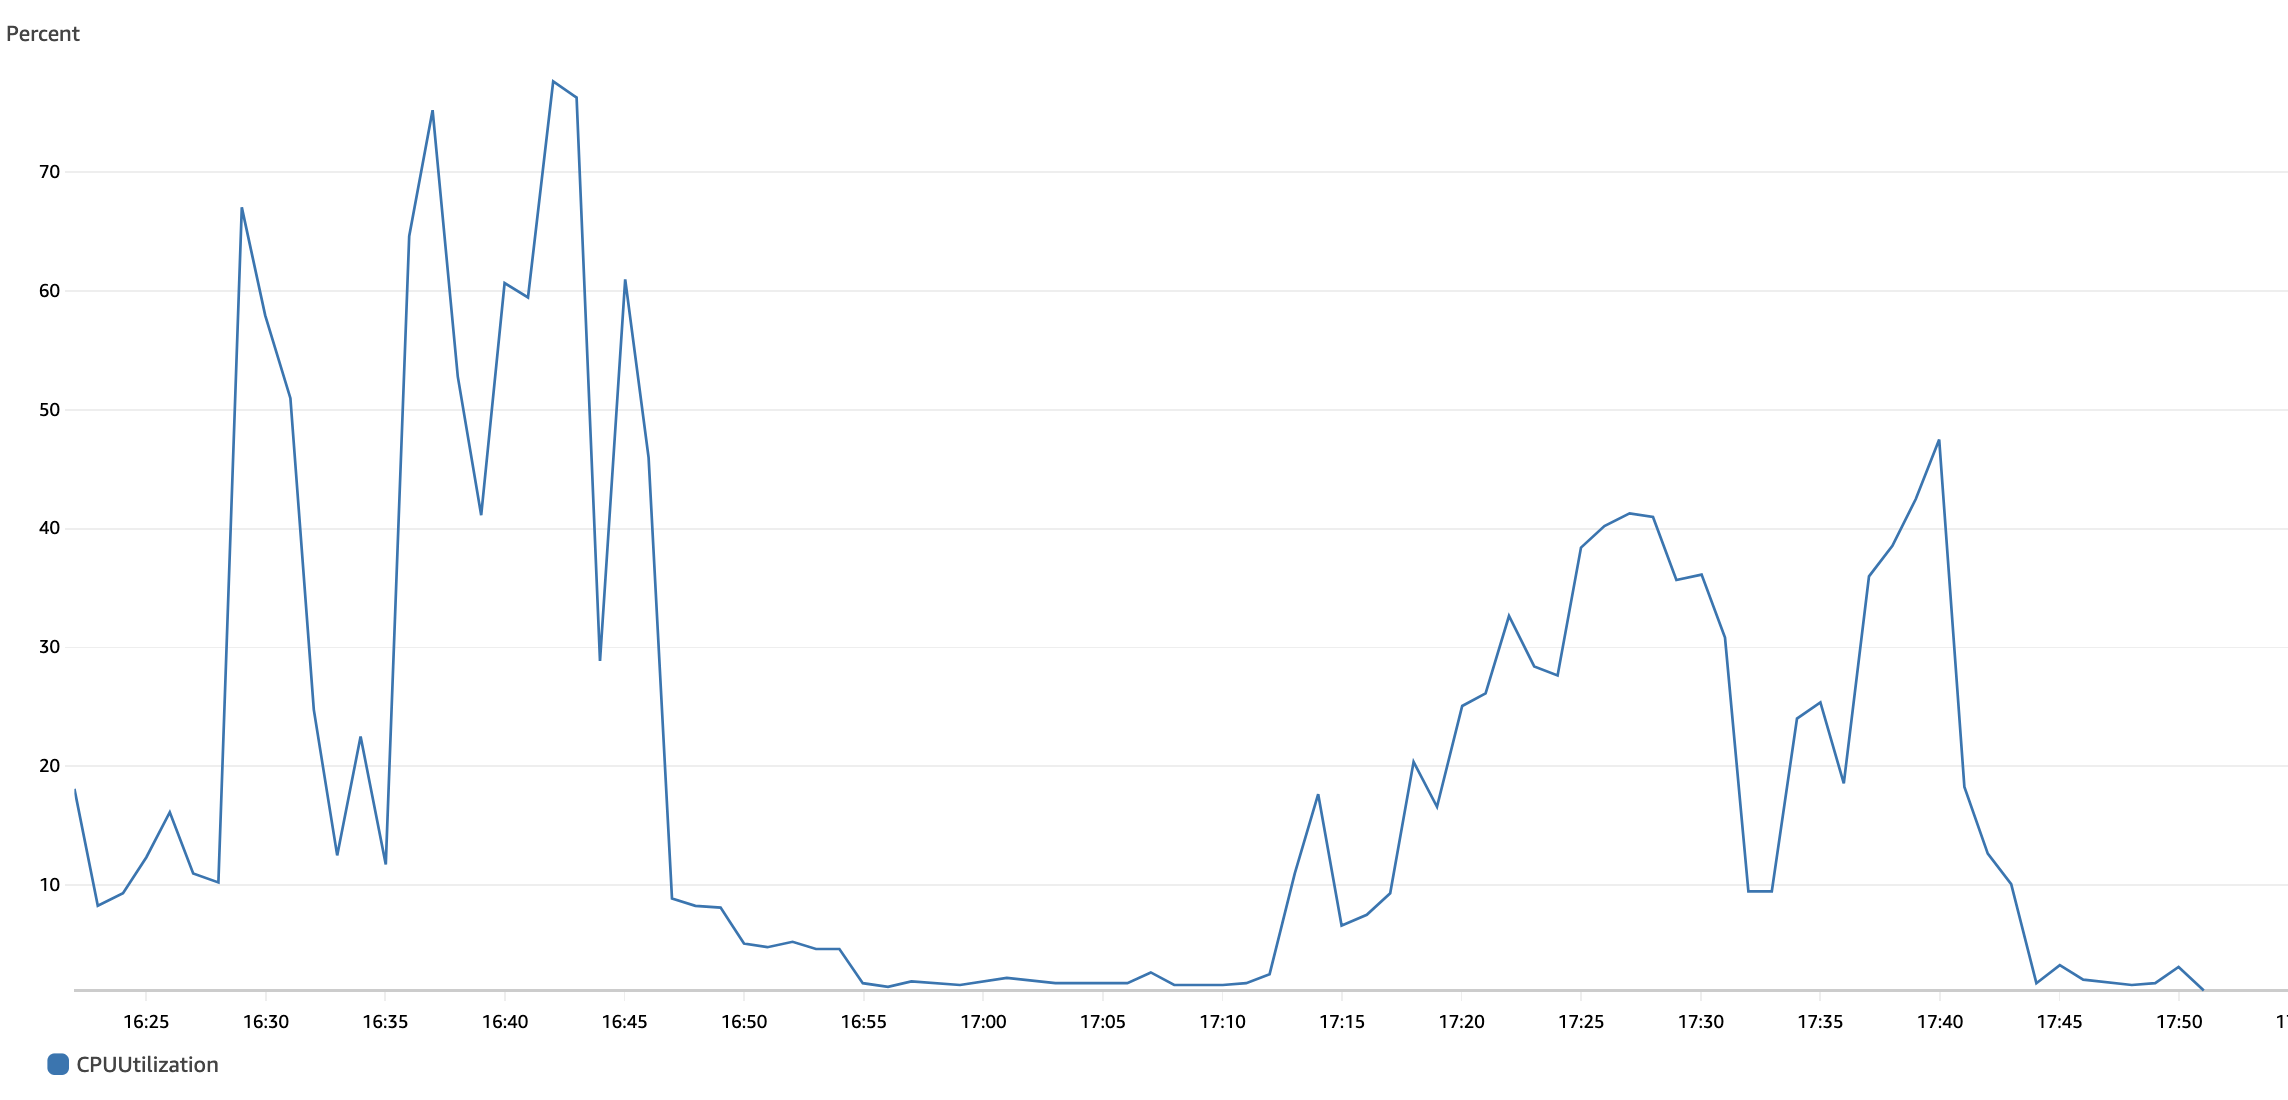
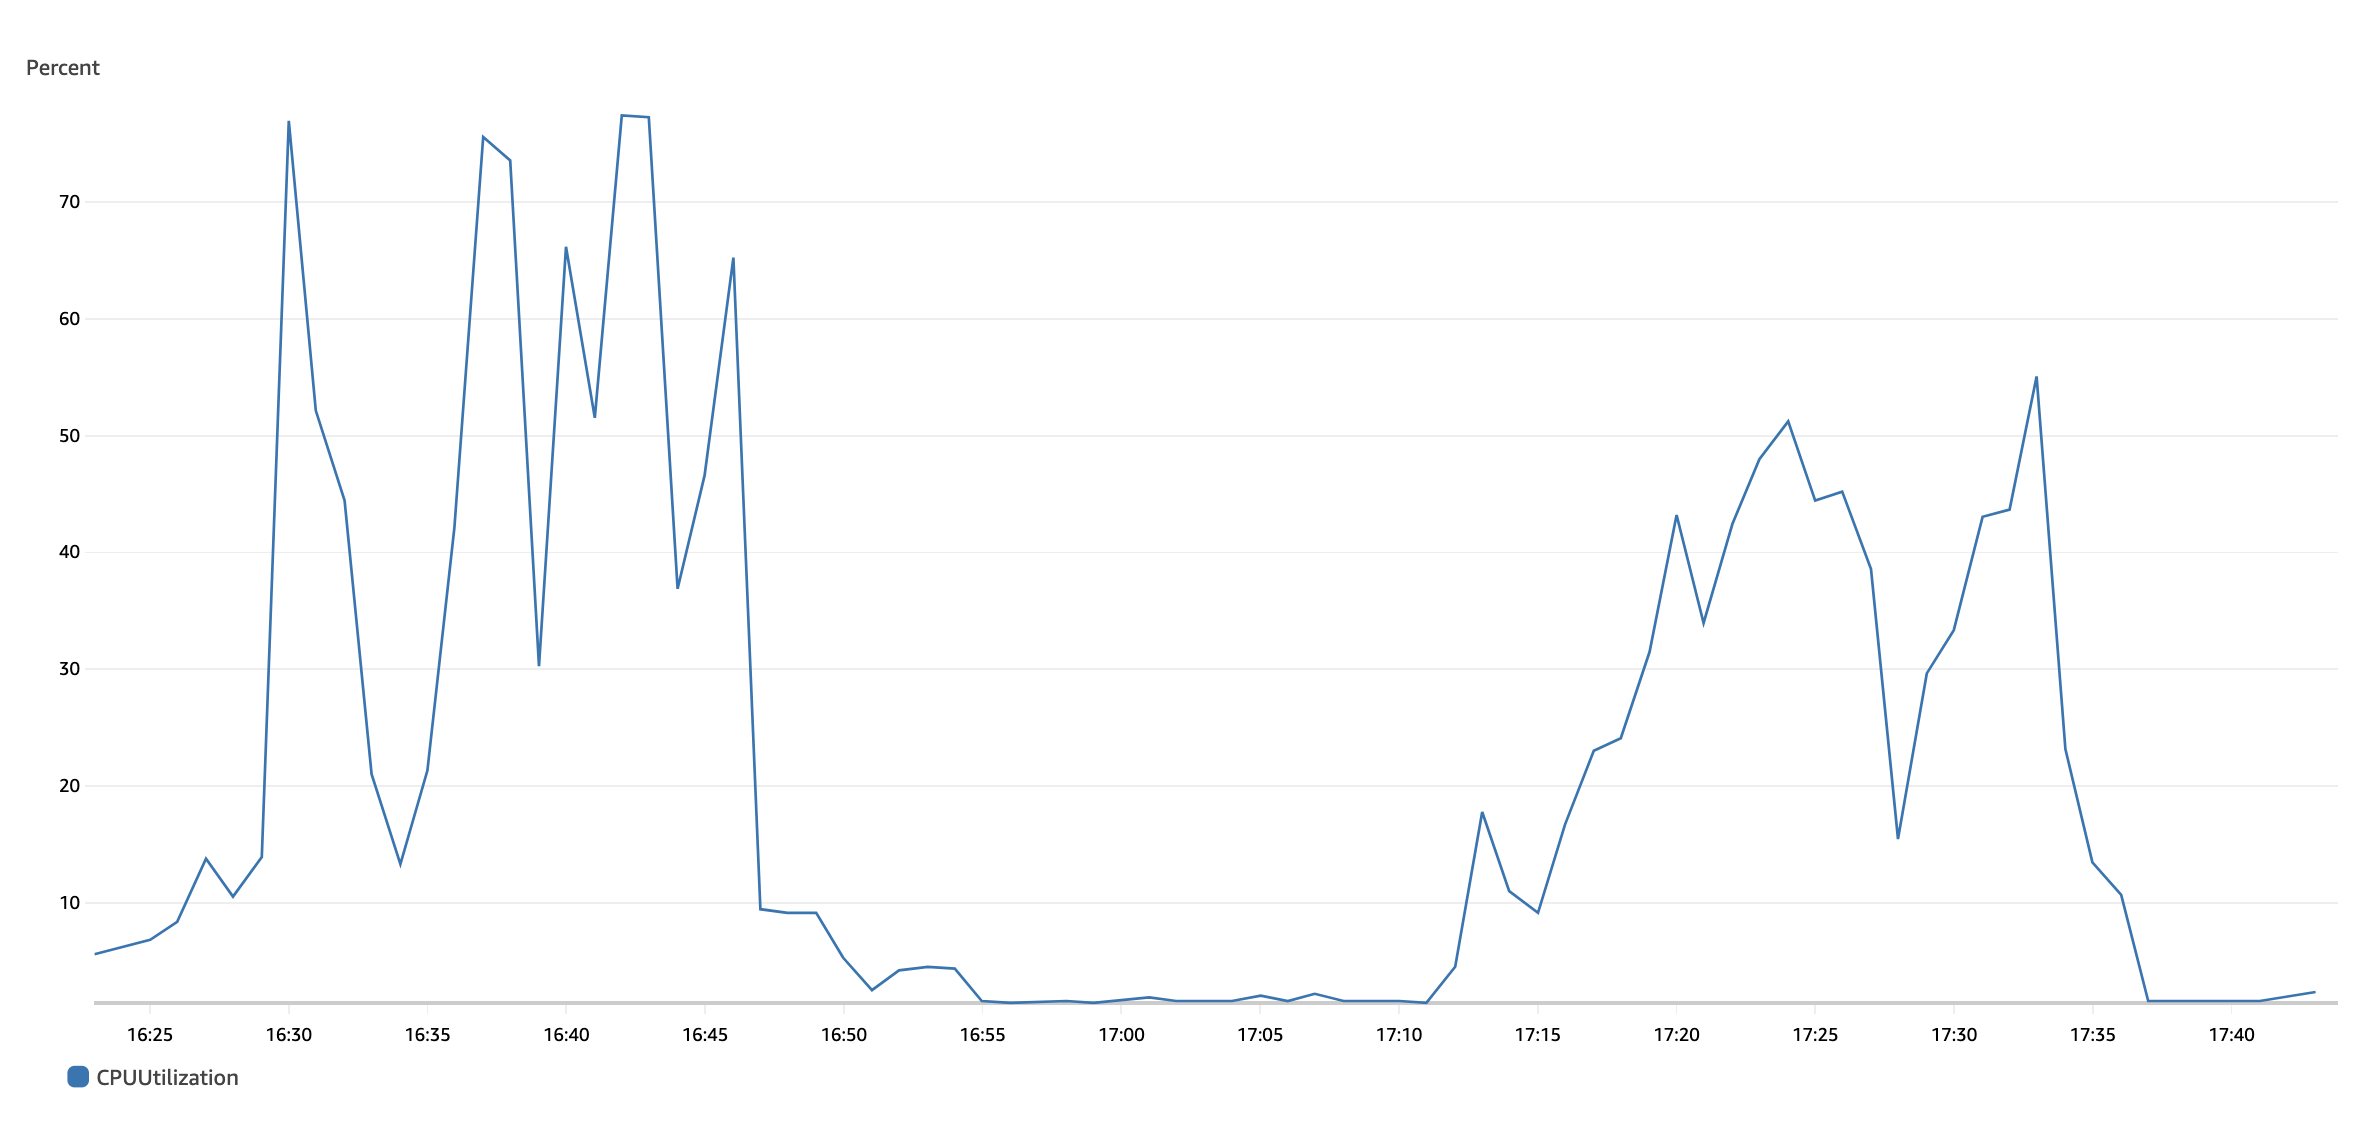
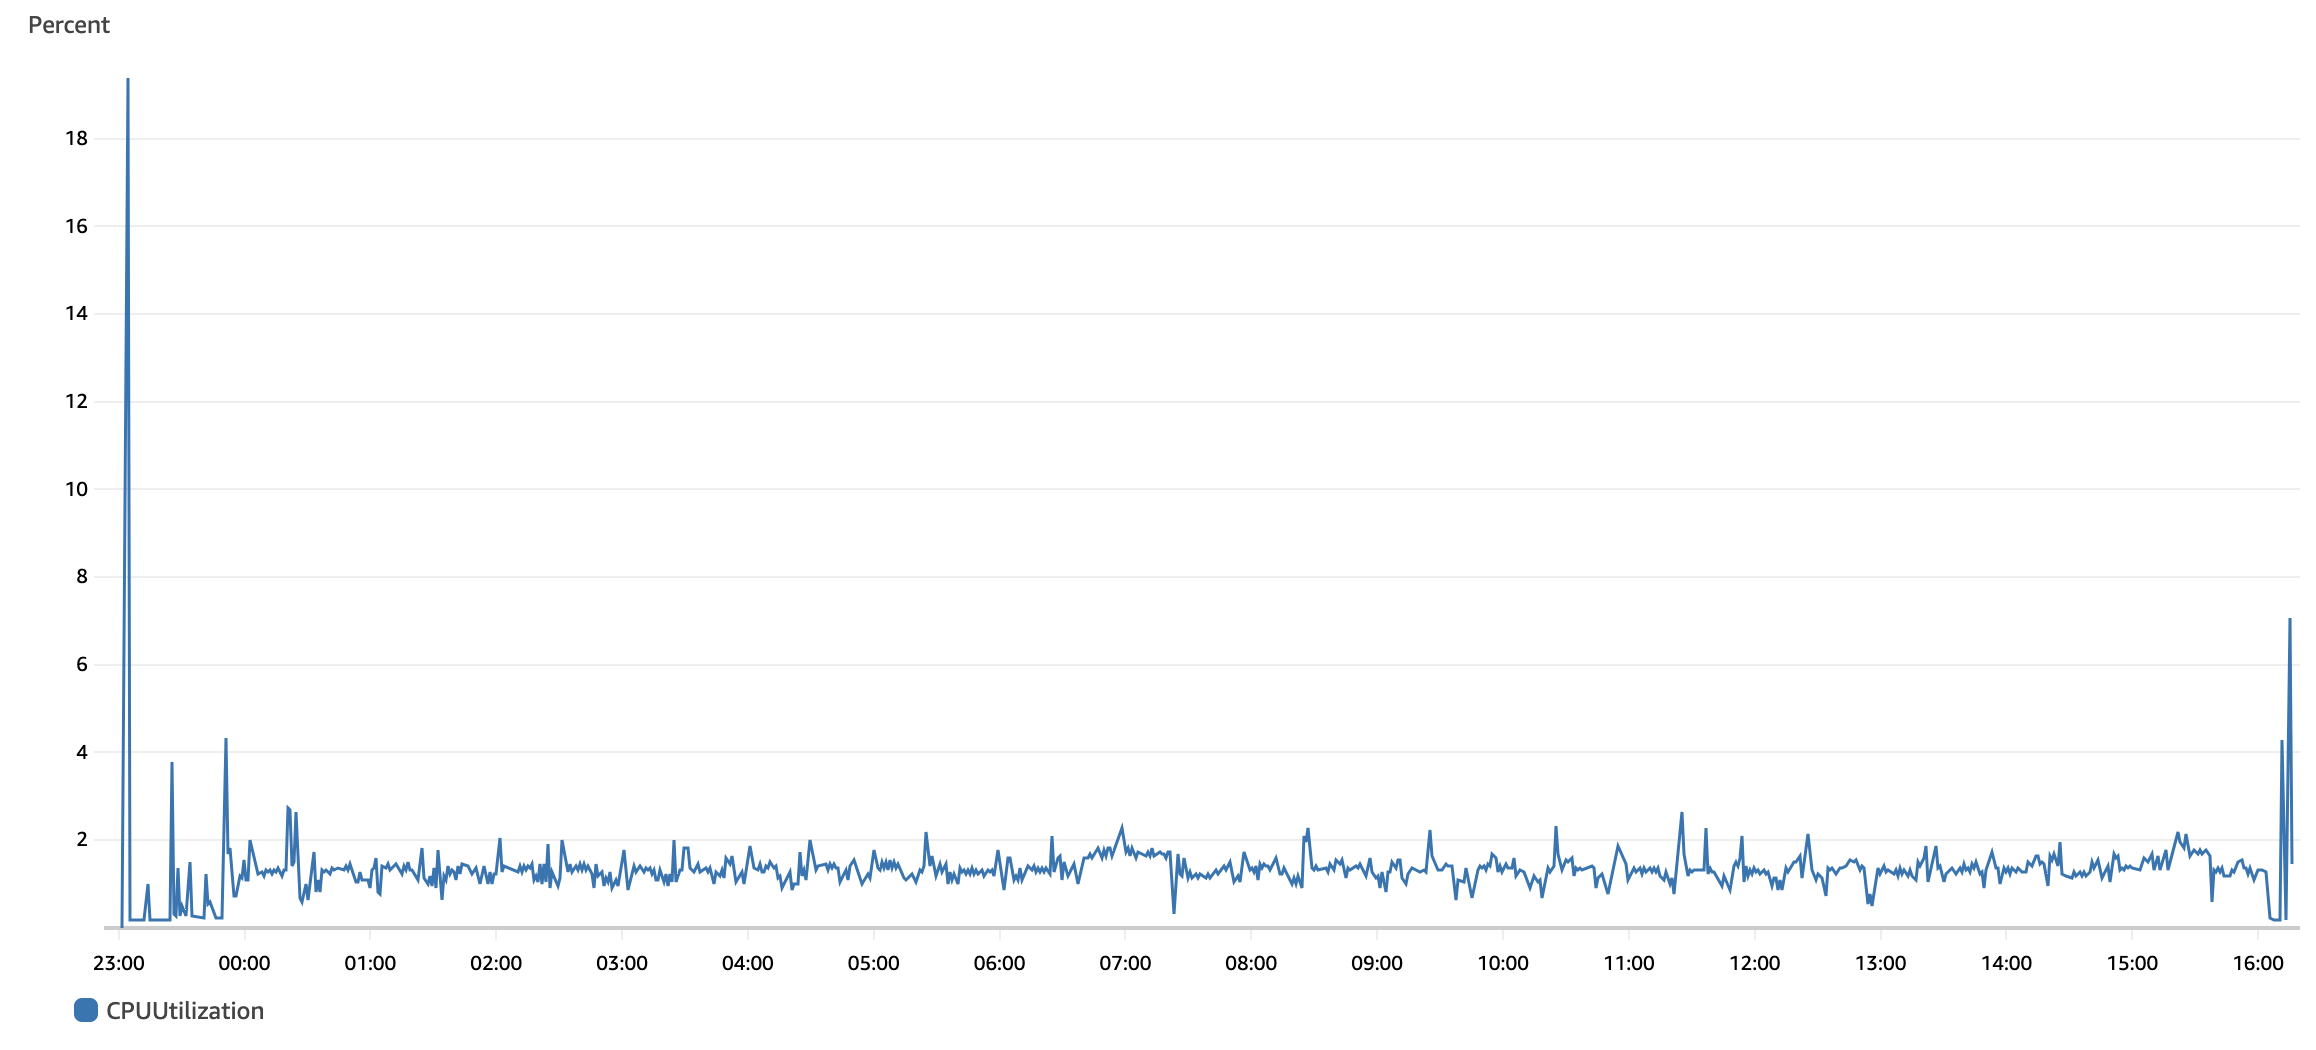
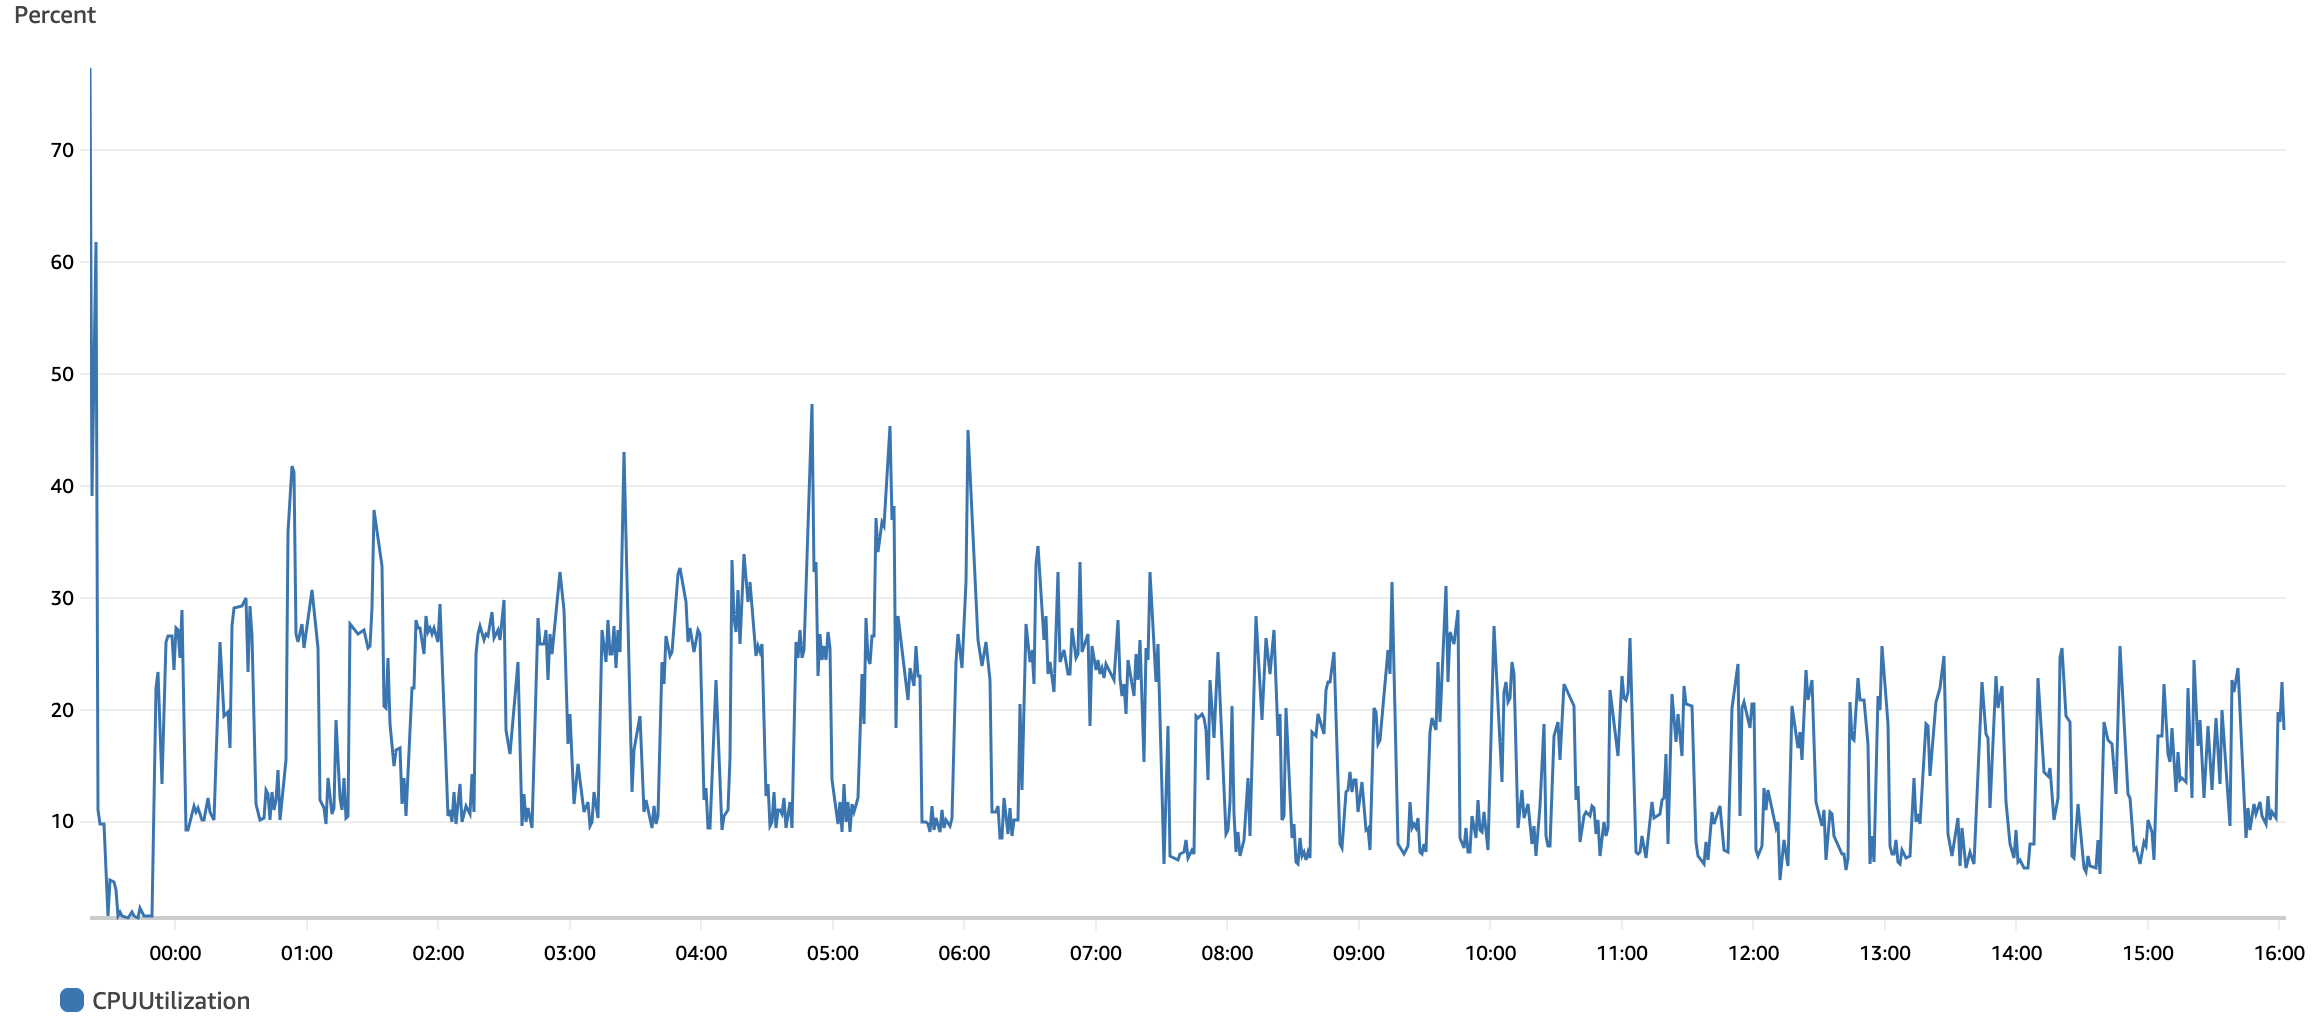
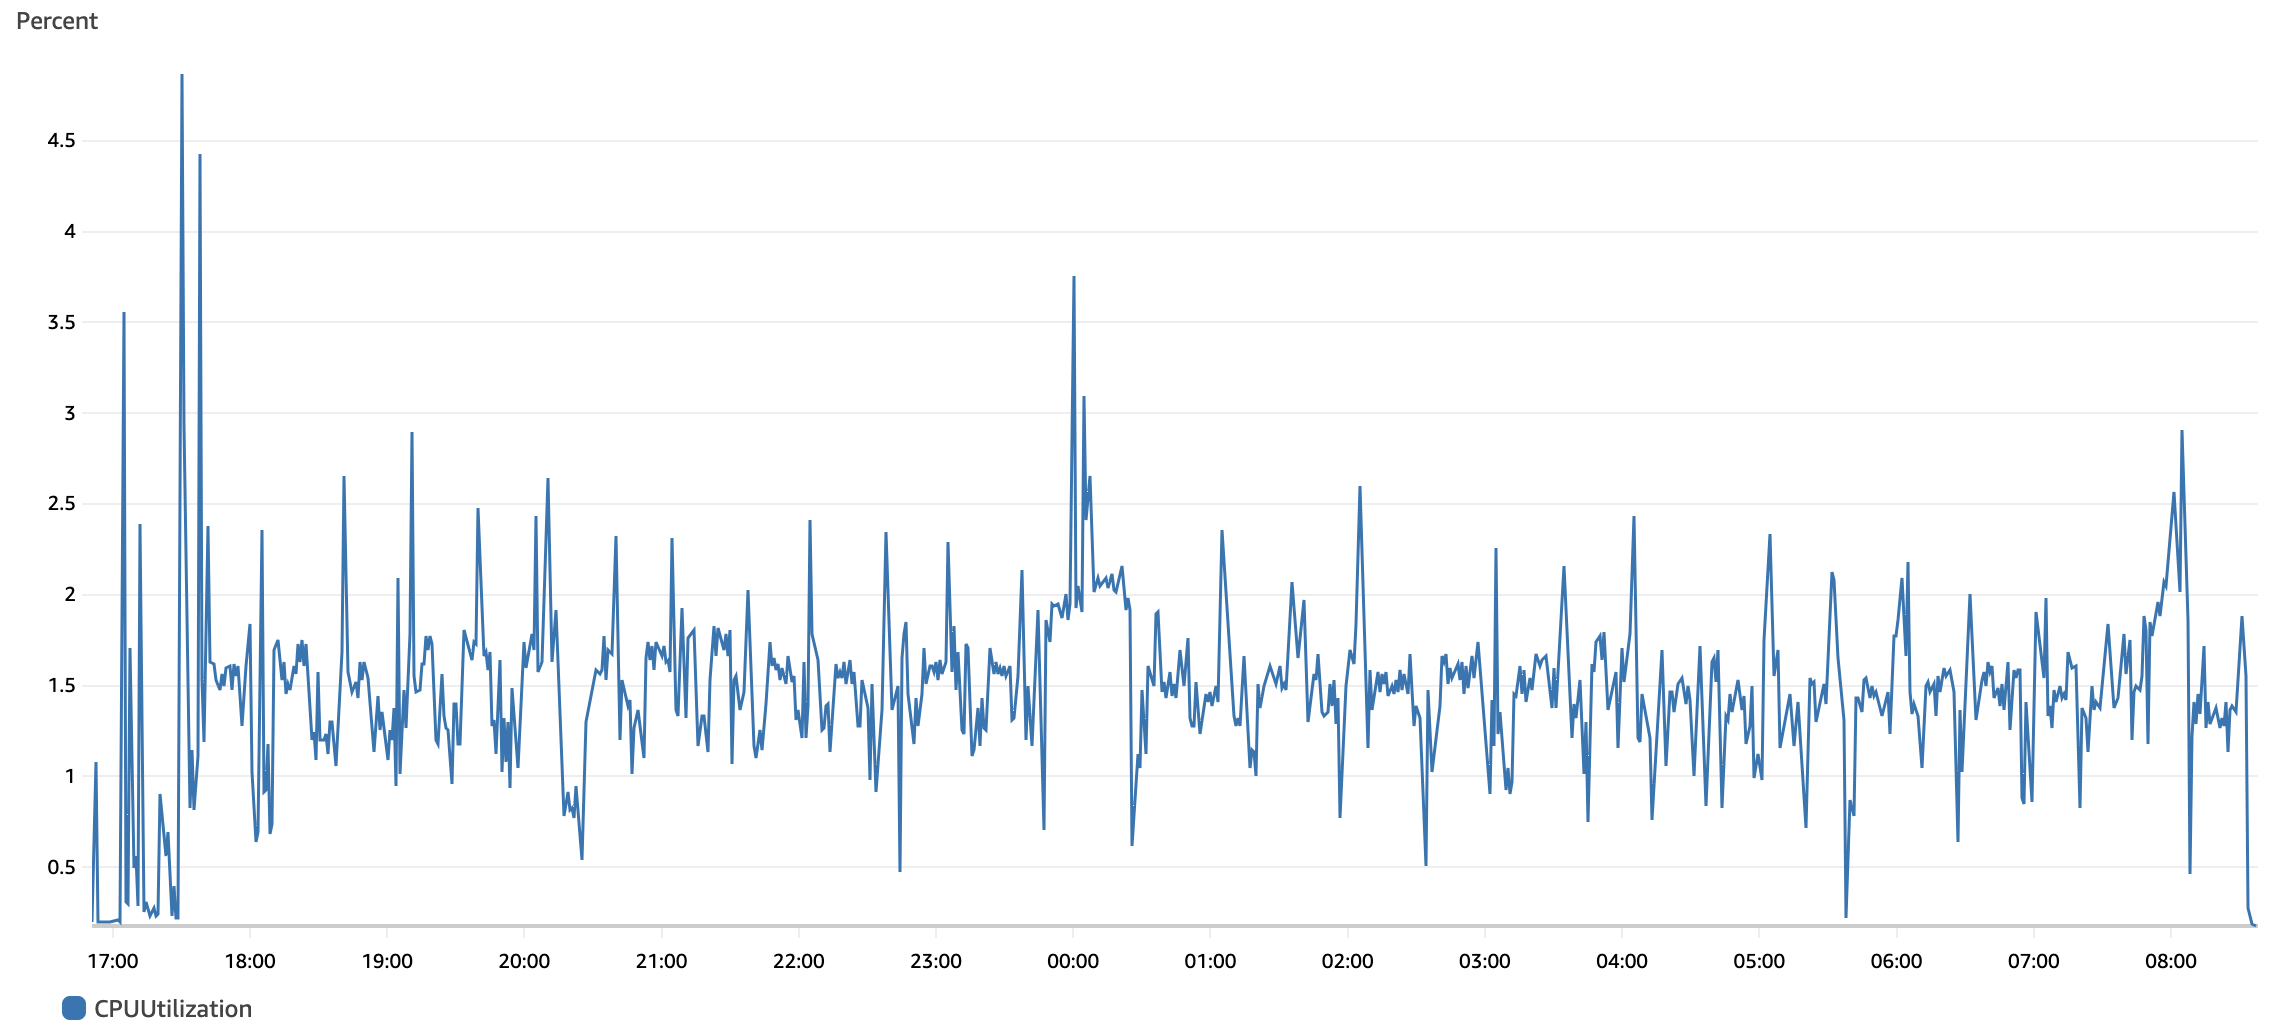
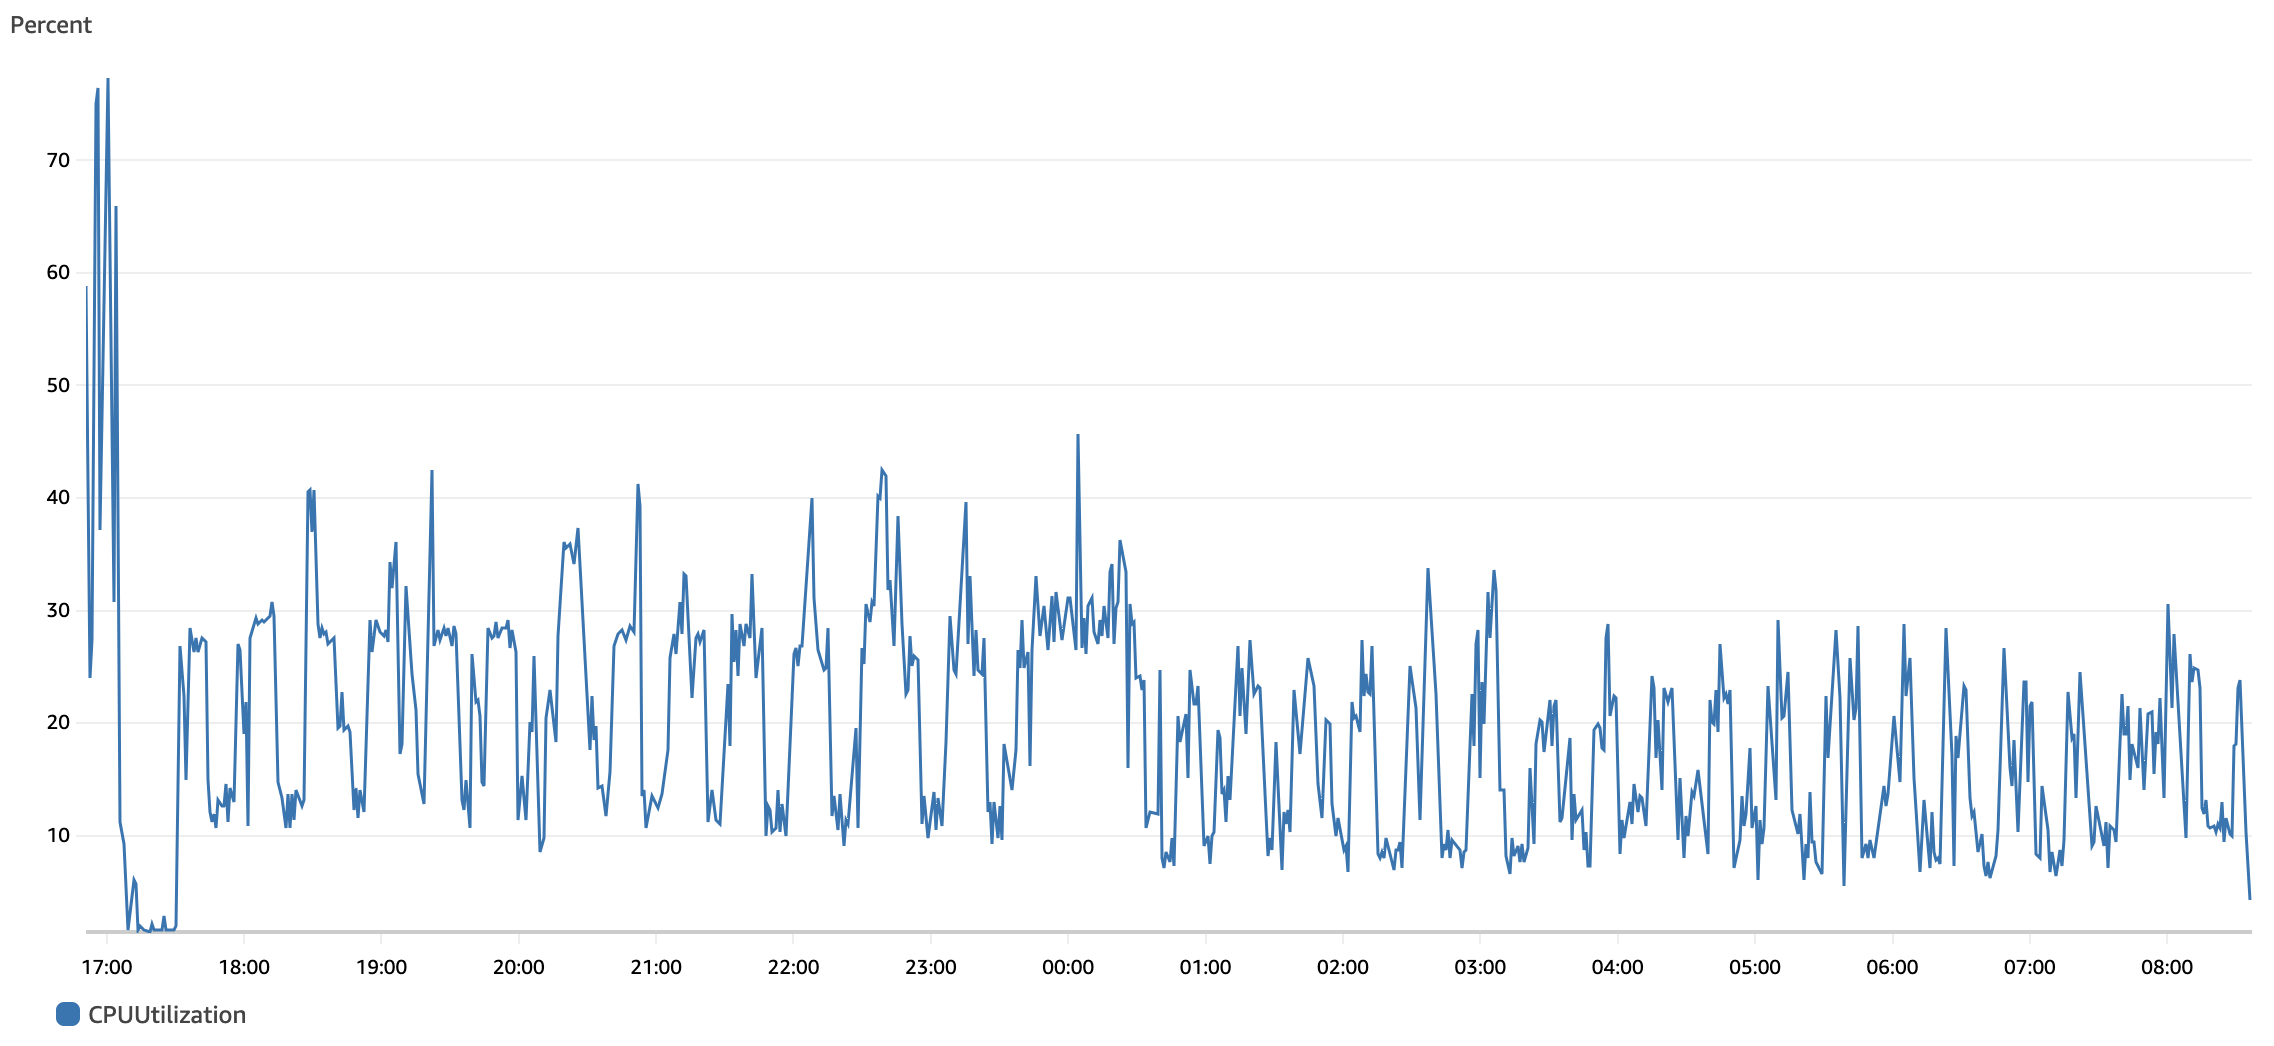
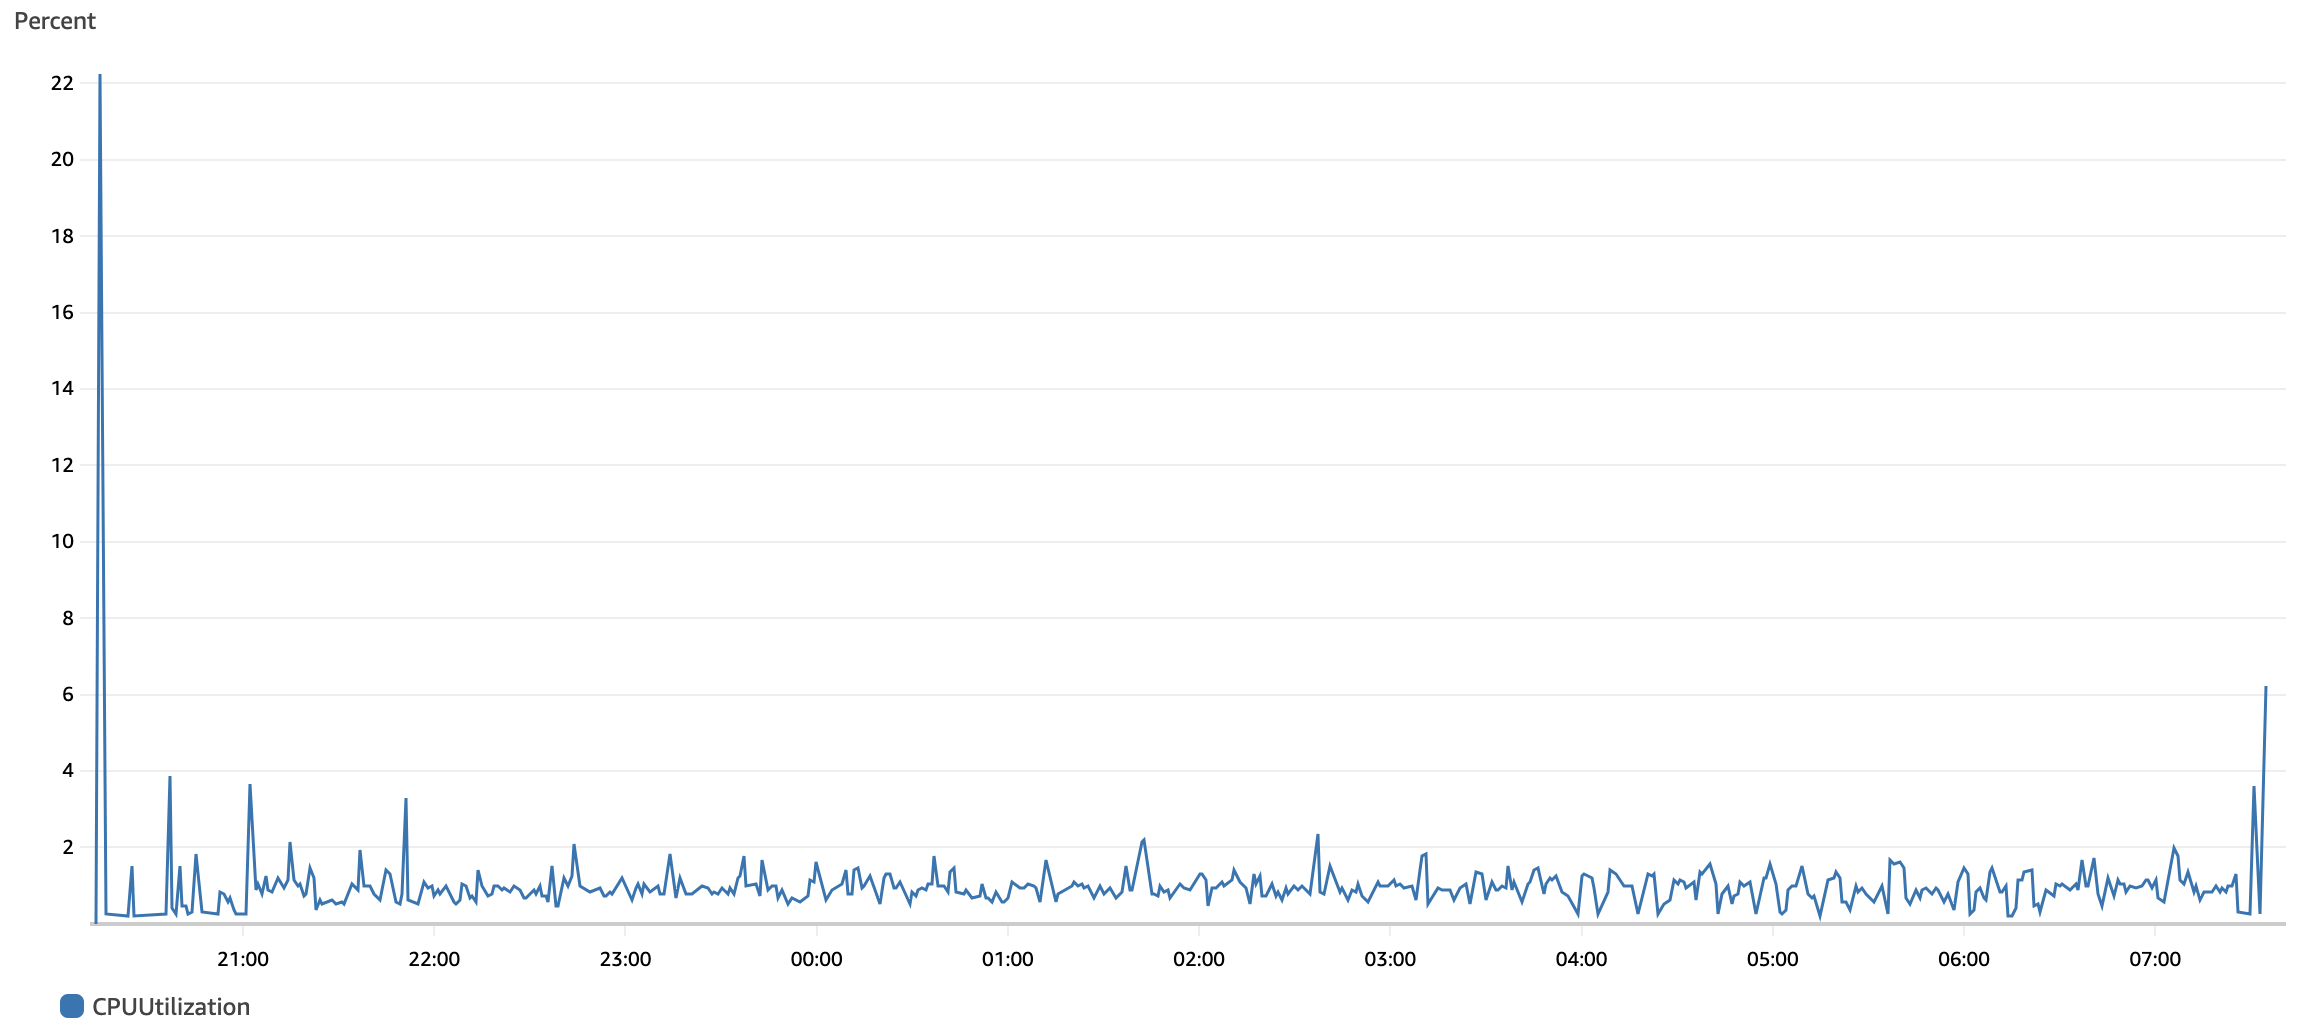
Java-Based Cleanup
Test Execution | Elapsed Time | Avg. Time per component | CPU Avg. Sonatype Nexus Repository Node | CPU Avg. RDS | Observations | ||
|---|---|---|---|---|---|---|---|
1 | 16 hours, 15 minutes, and 9 seconds (58,509 seconds) | 17.9 ms |
|
|
| ||
2 | 15 hours, 31 minutes, and 19 seconds (55,879 seconds) | 17.1 ms |
|
|
| ||
3 | 15 hours, 3 minutes, and 27 seconds (54,207 seconds) | 16.6 ms |
|
|
|
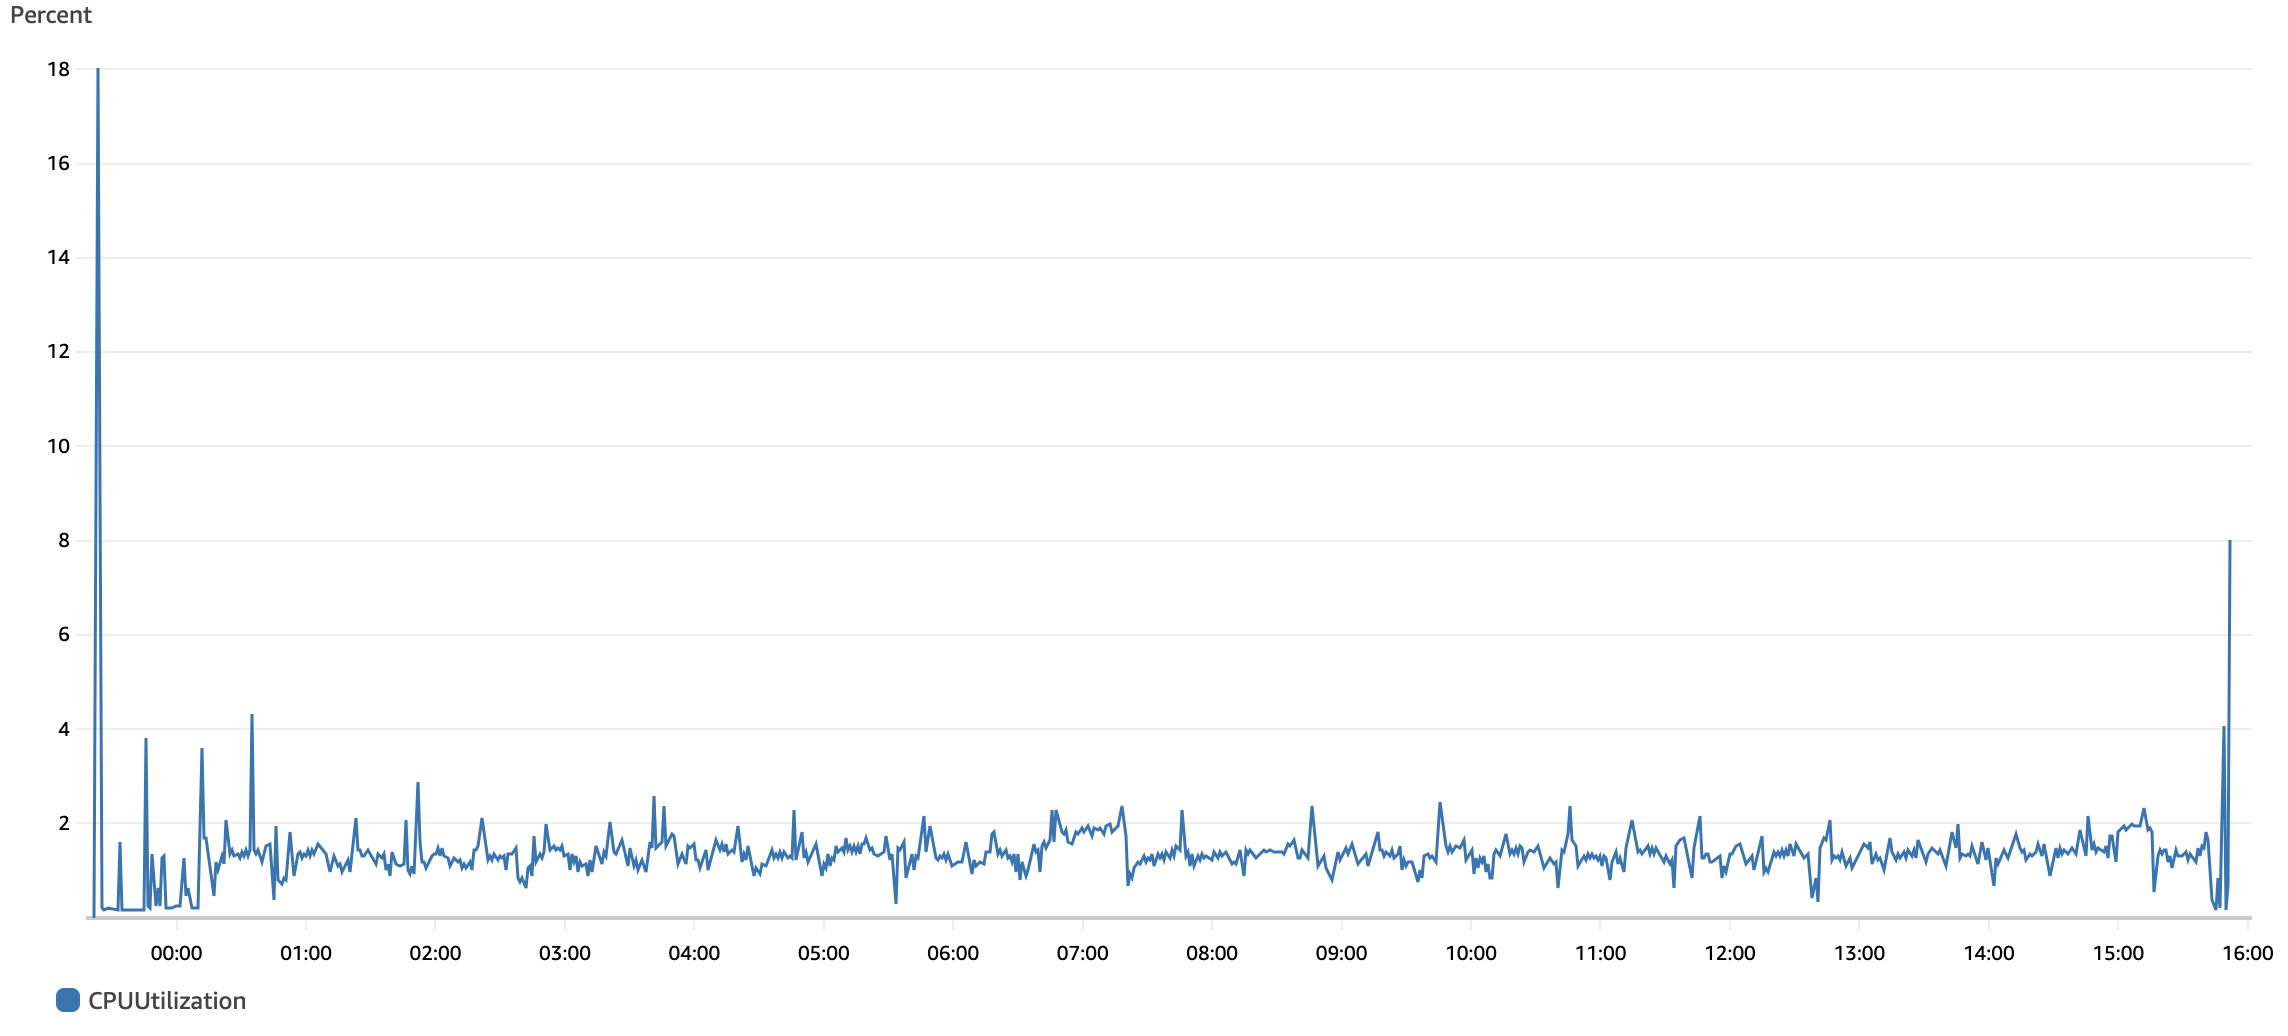
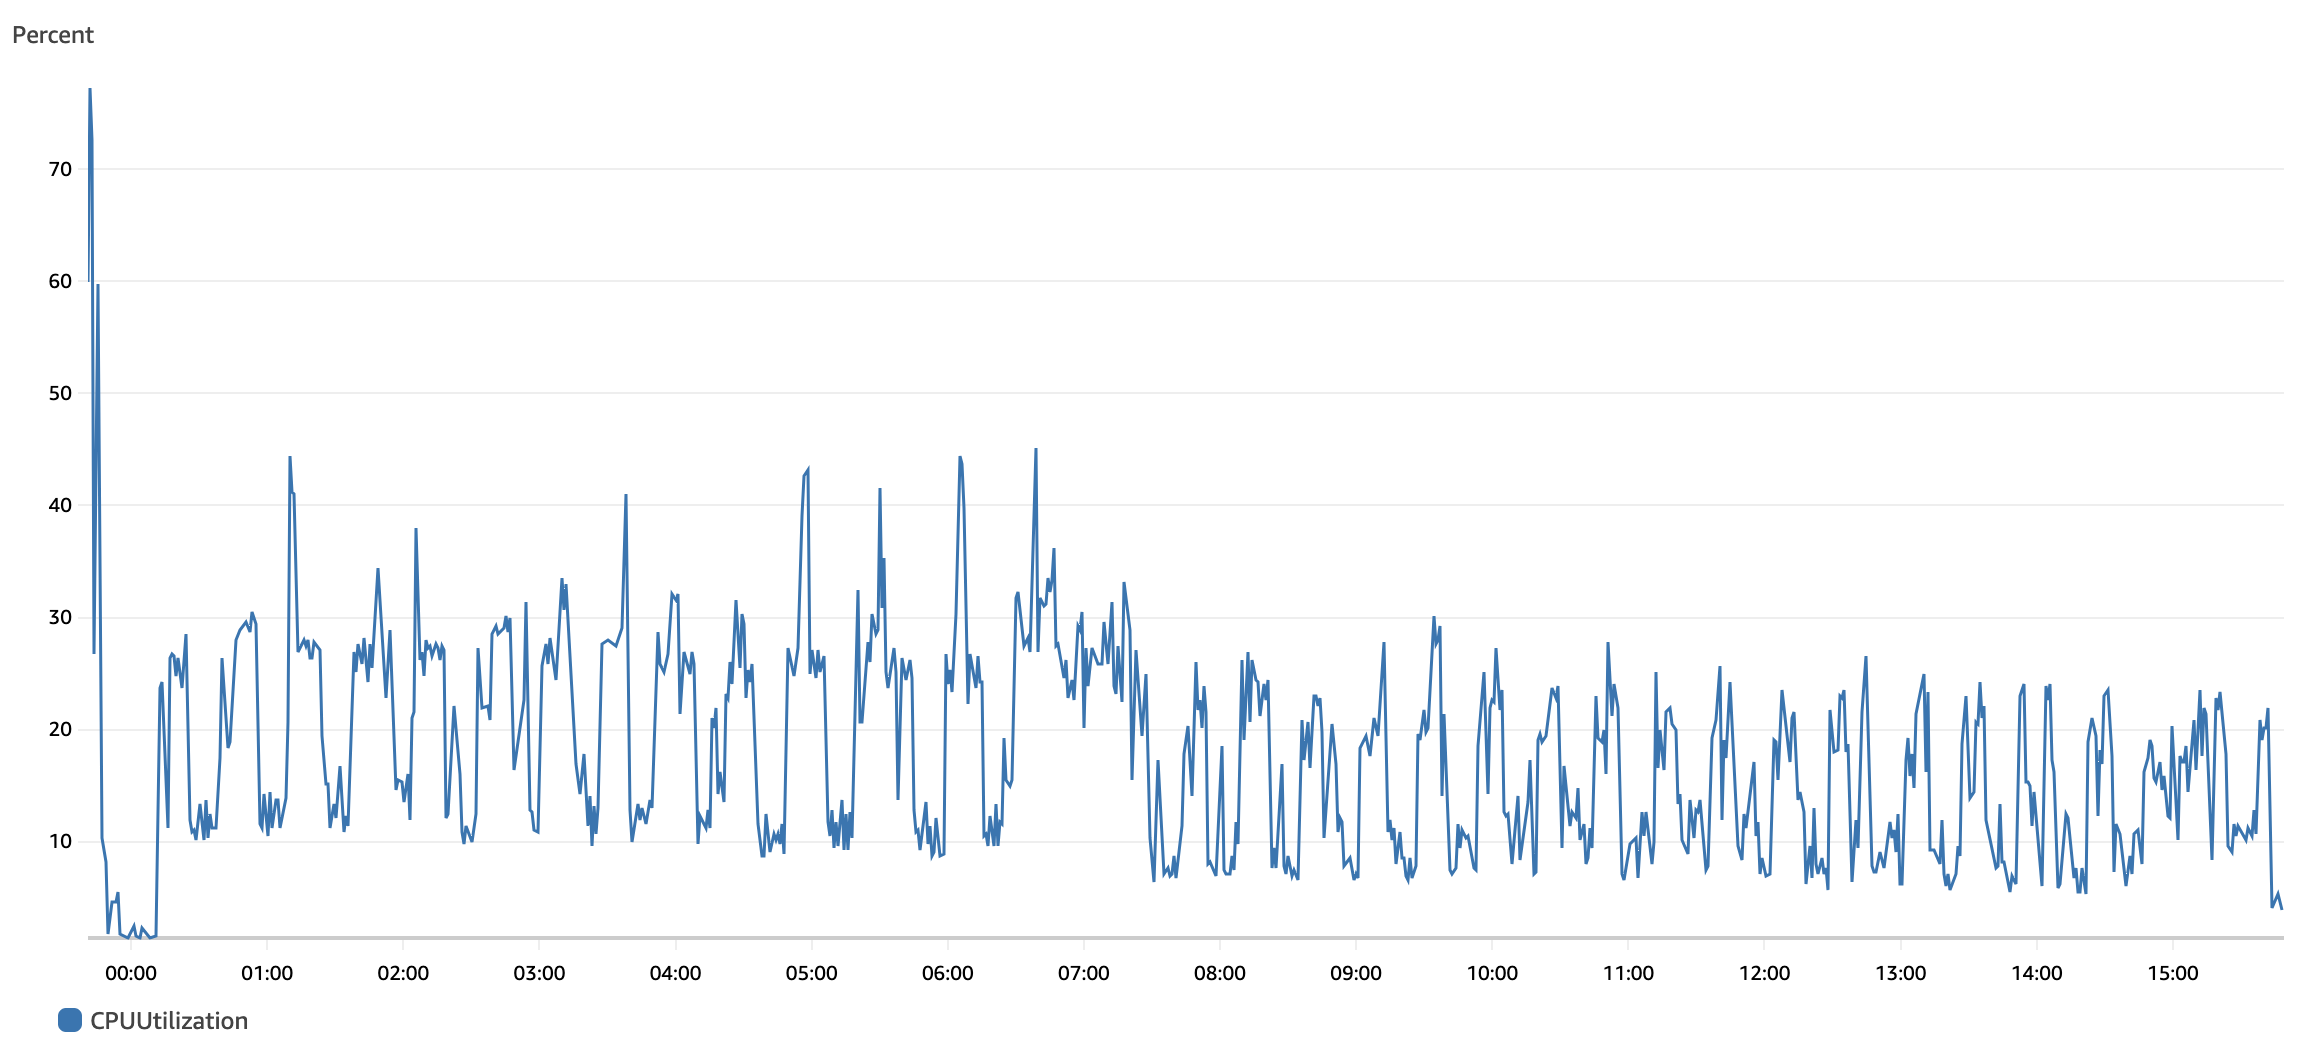
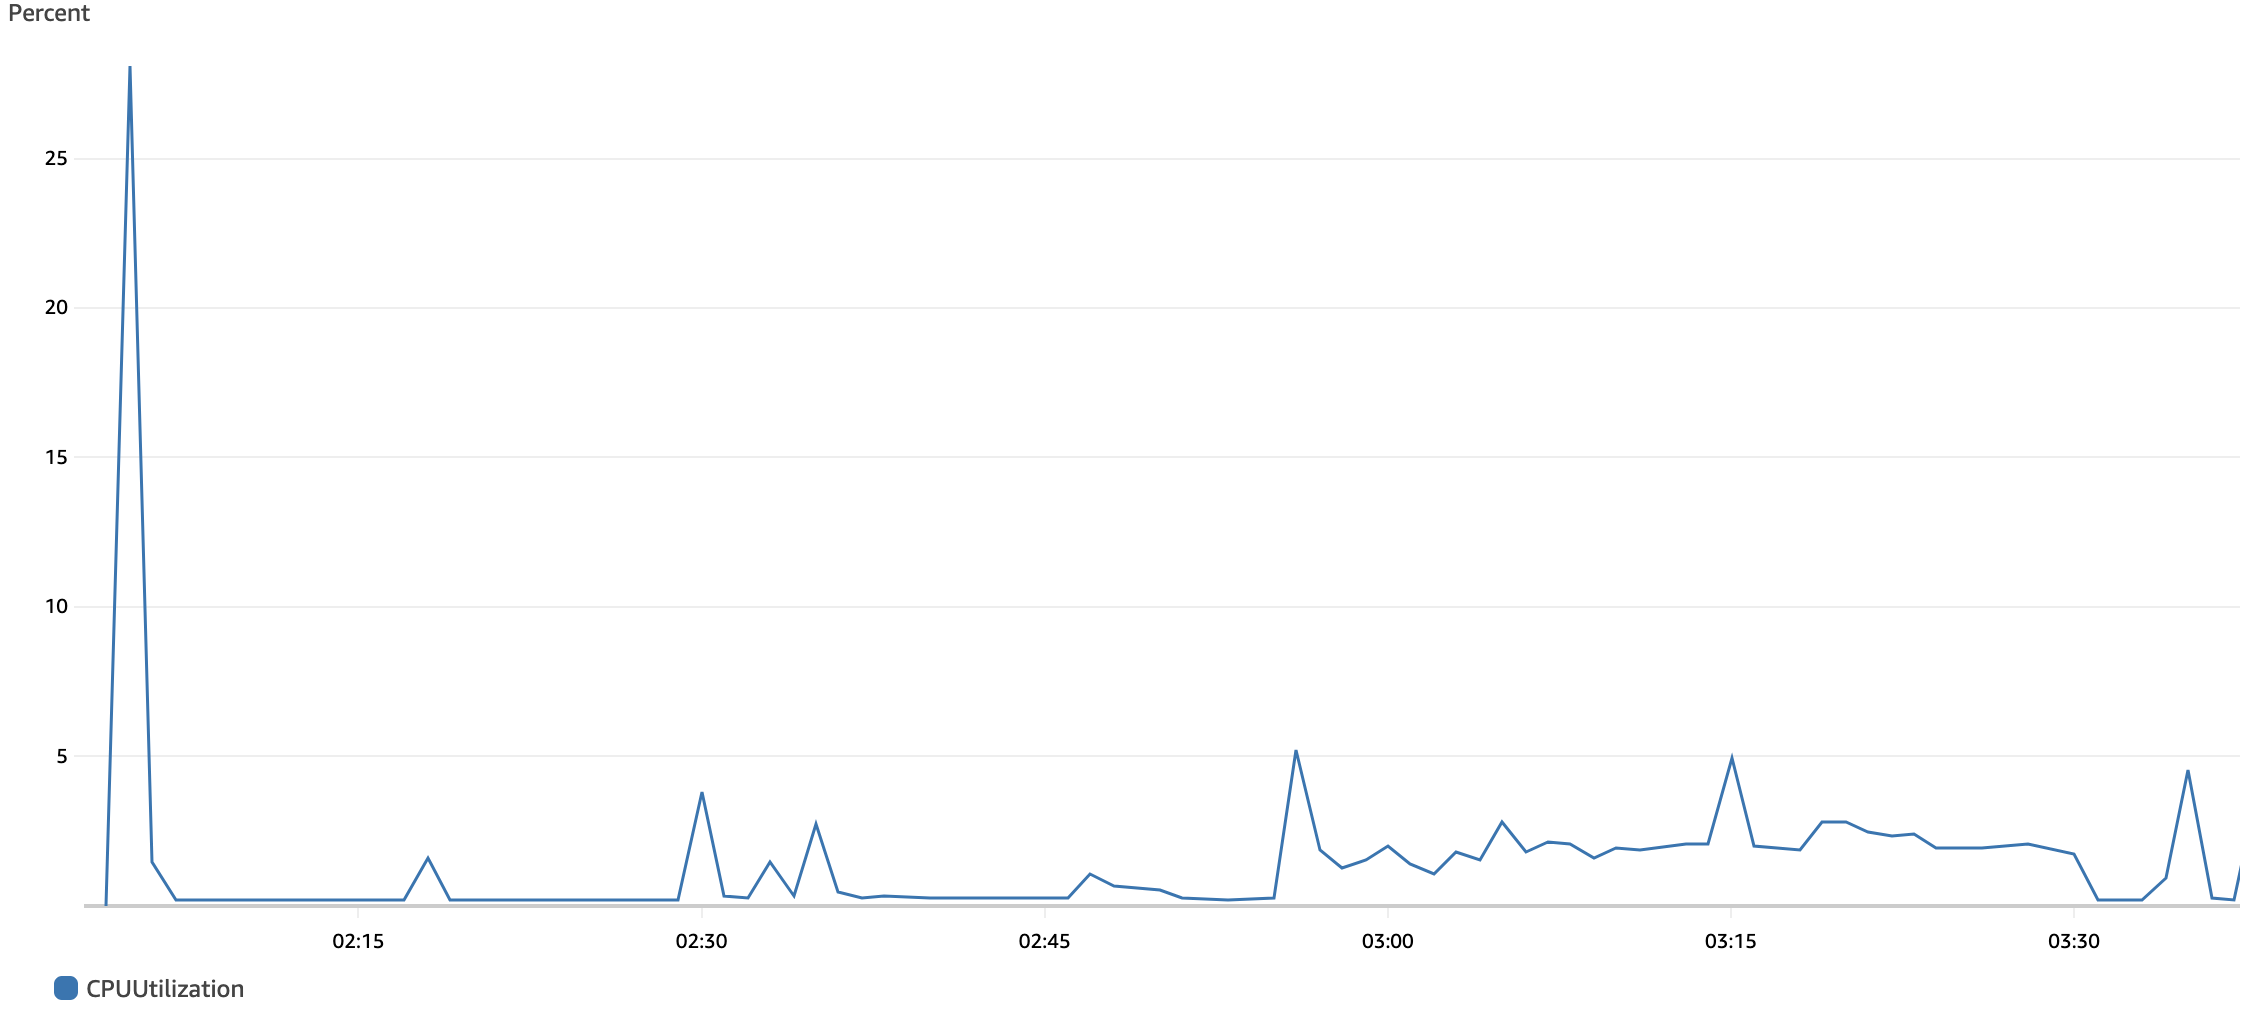
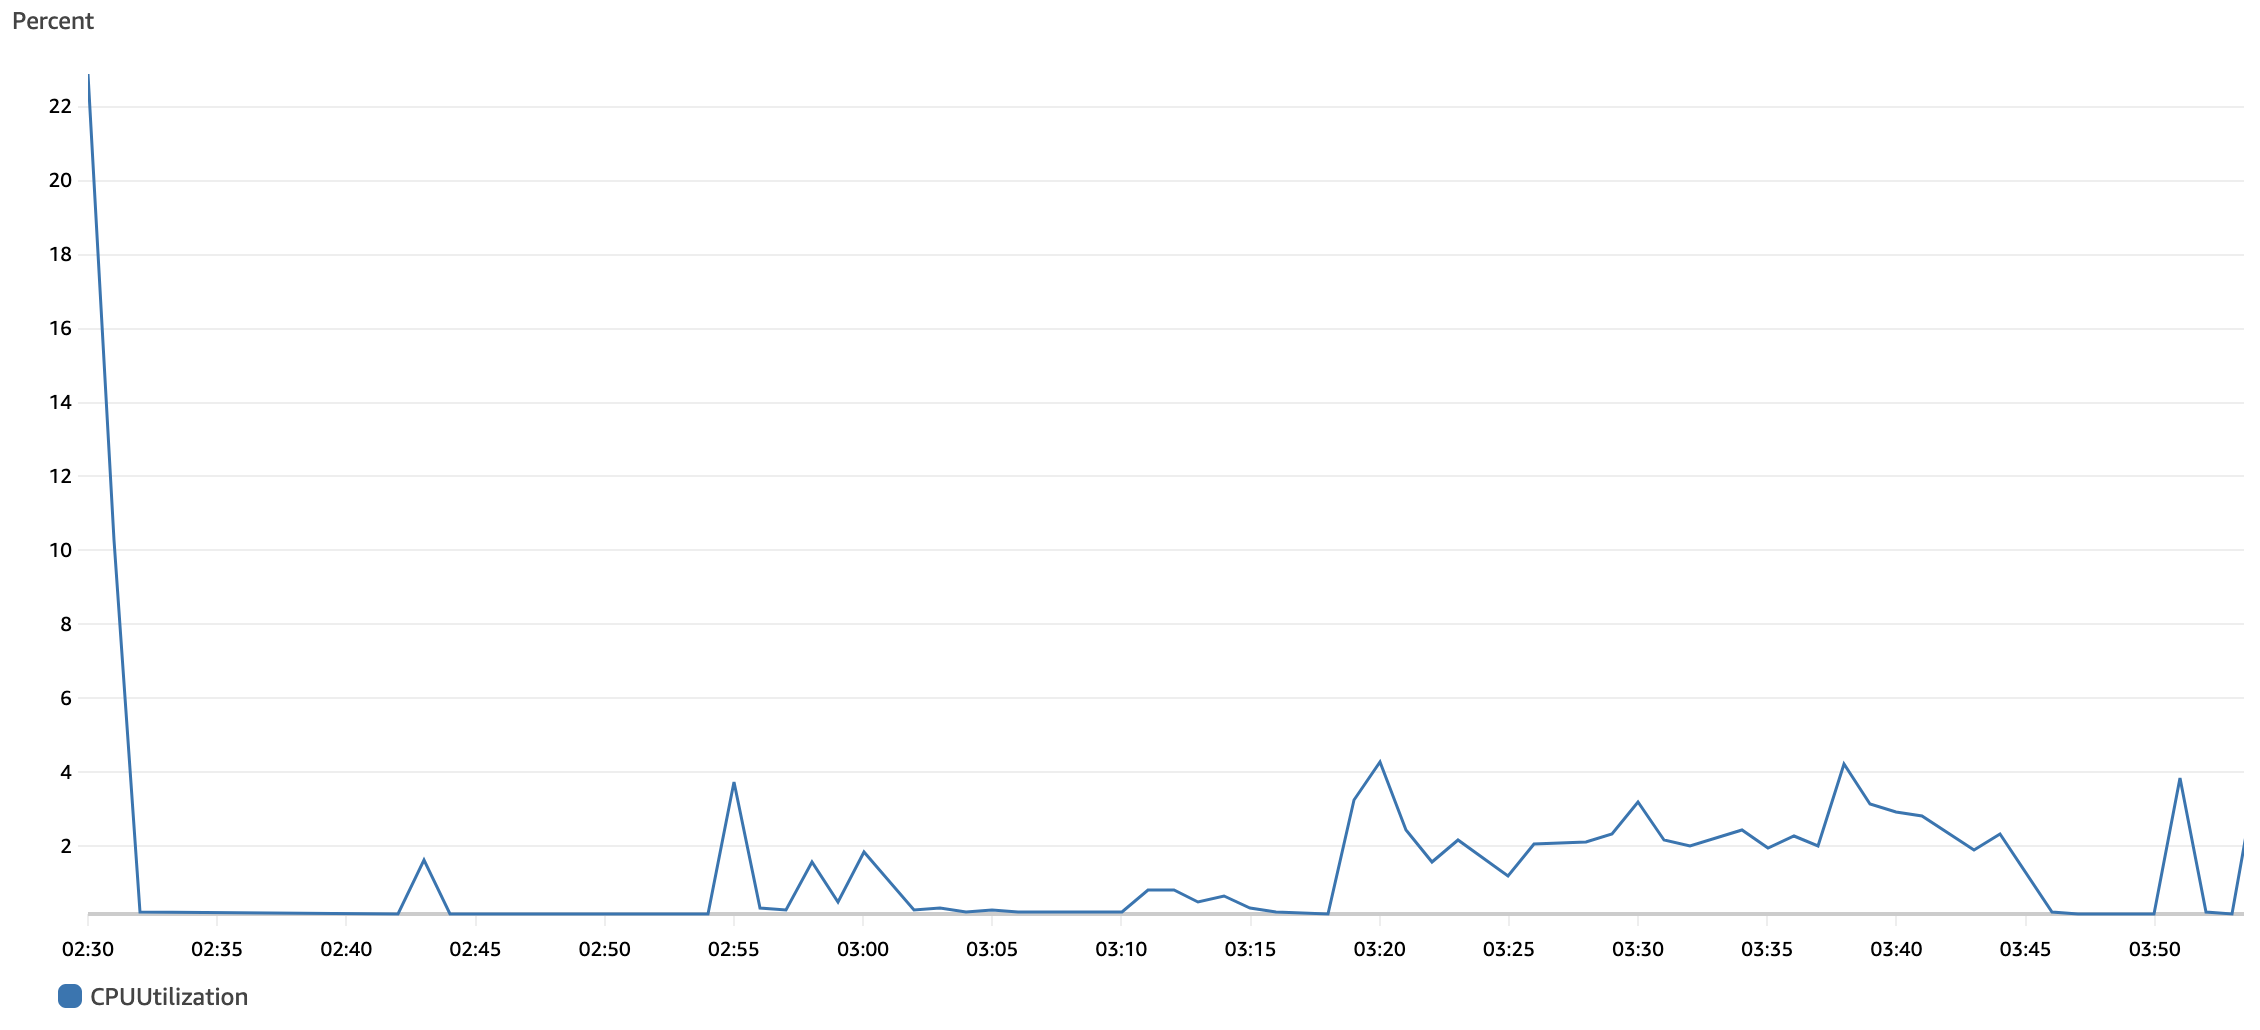
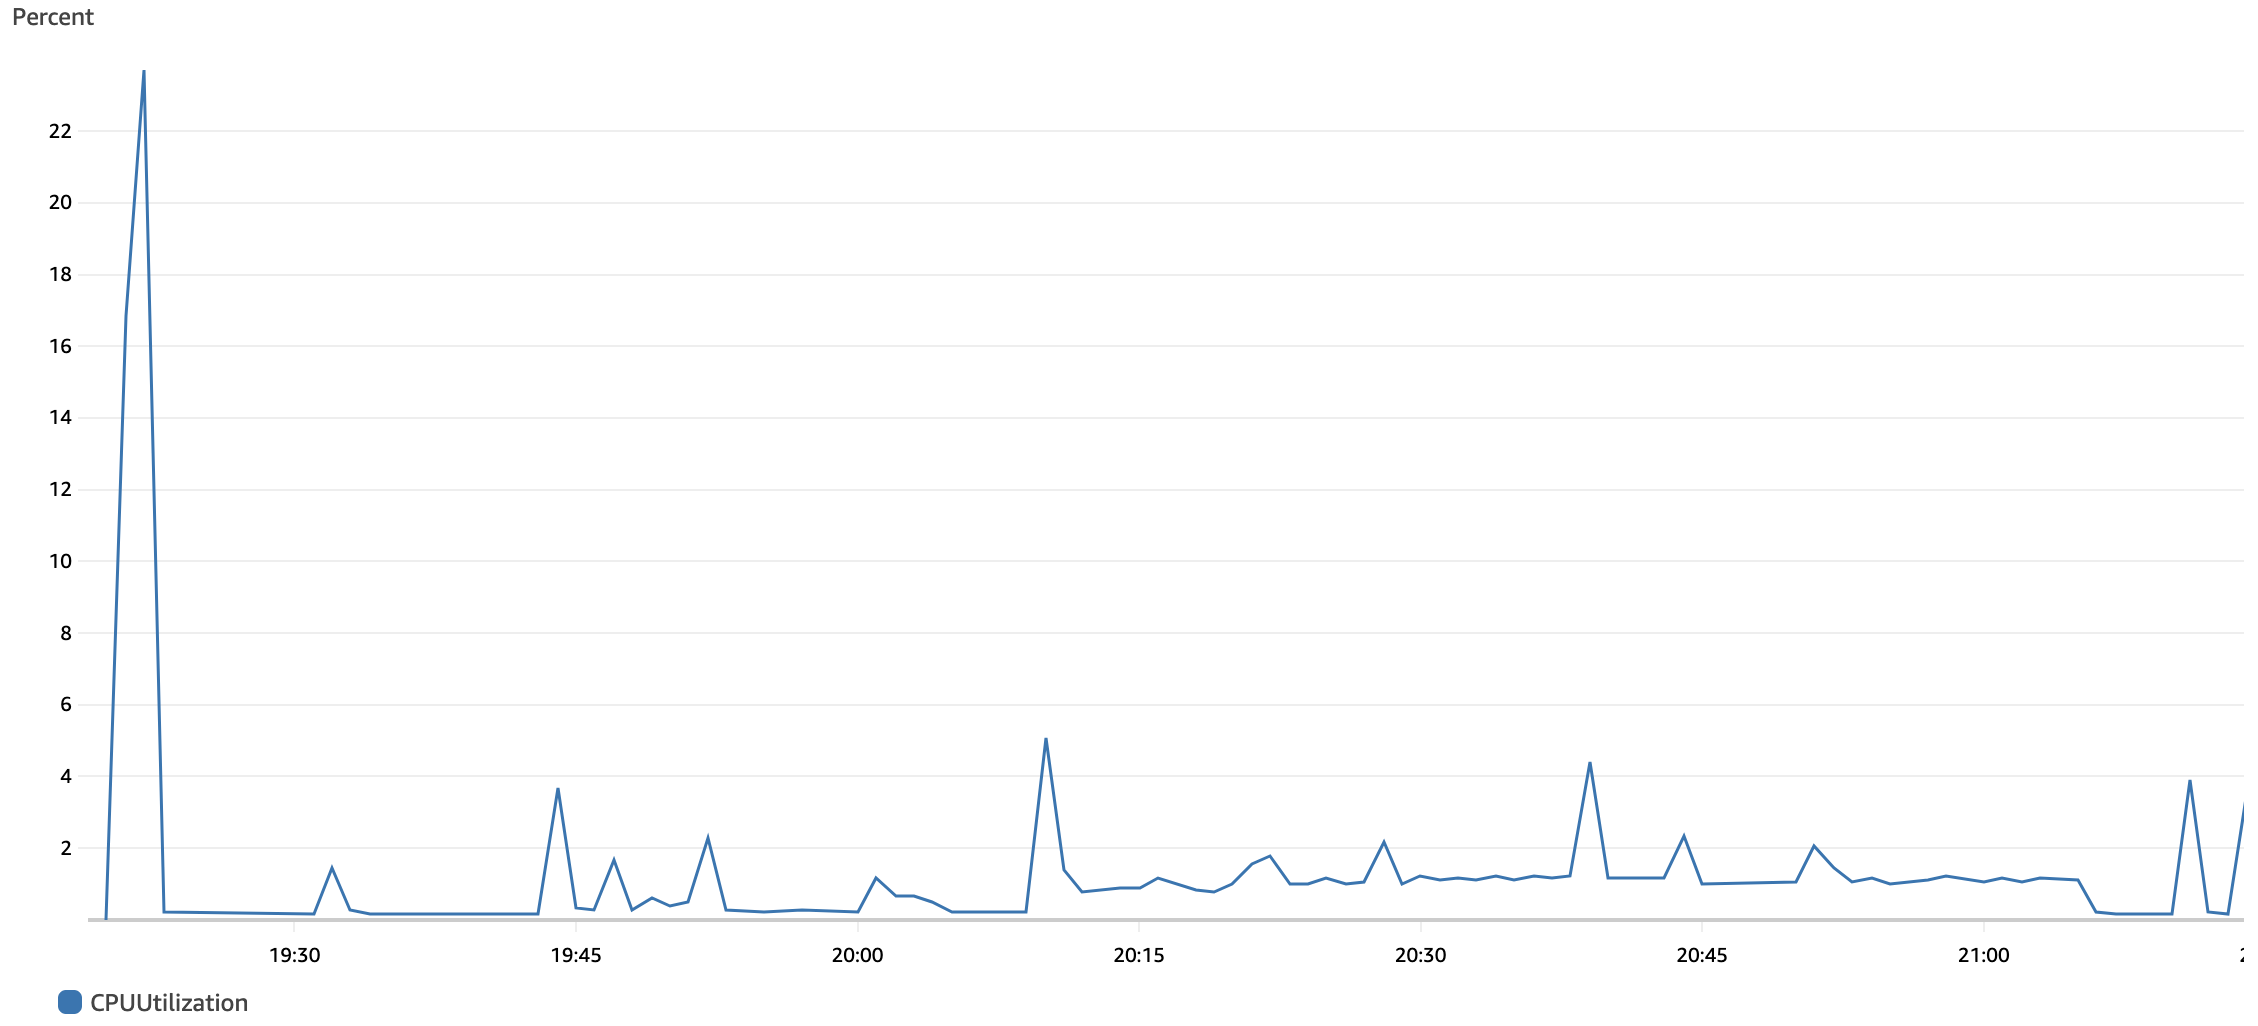
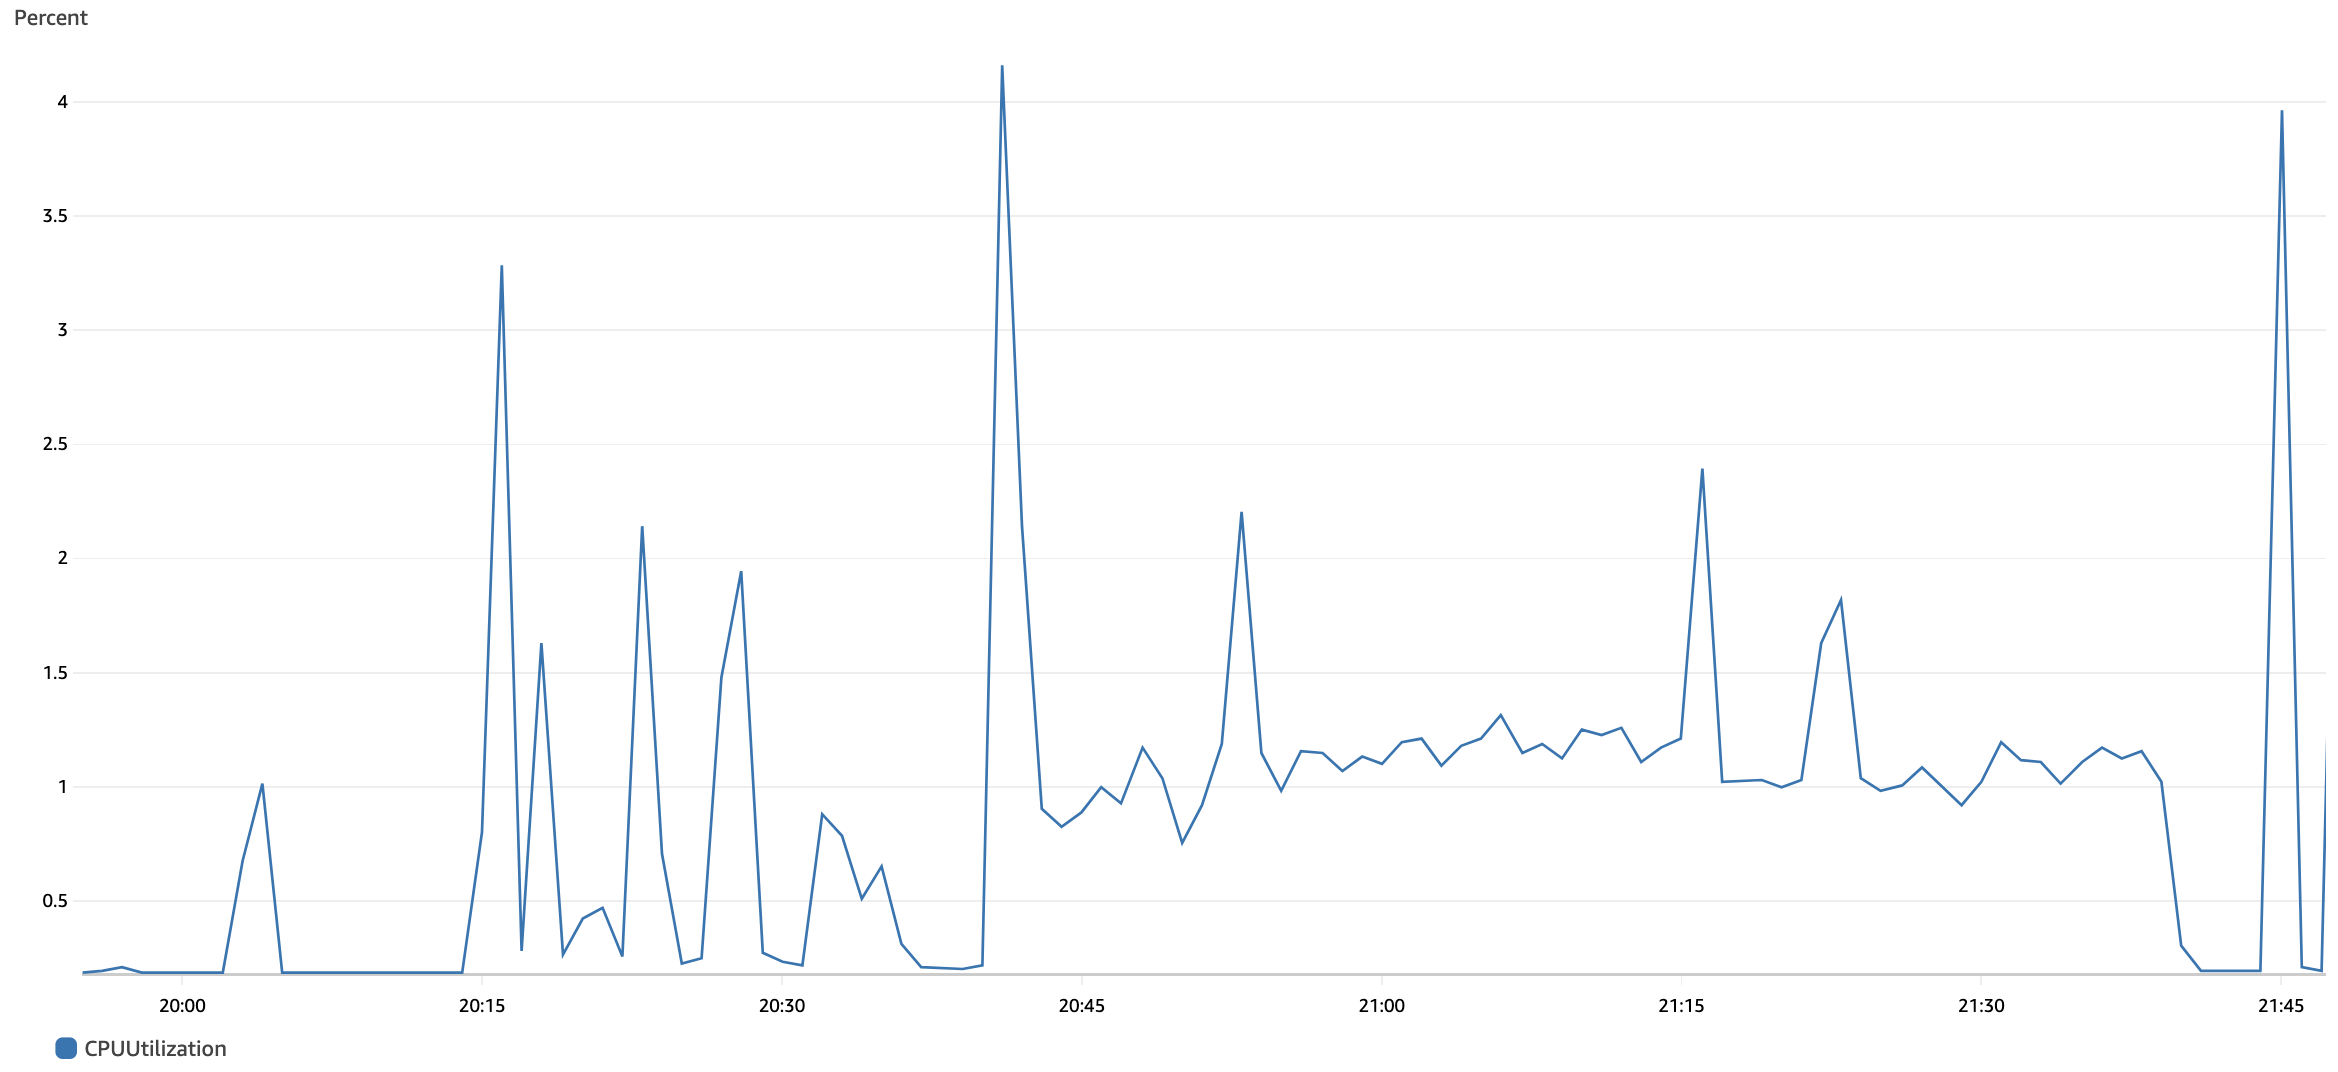
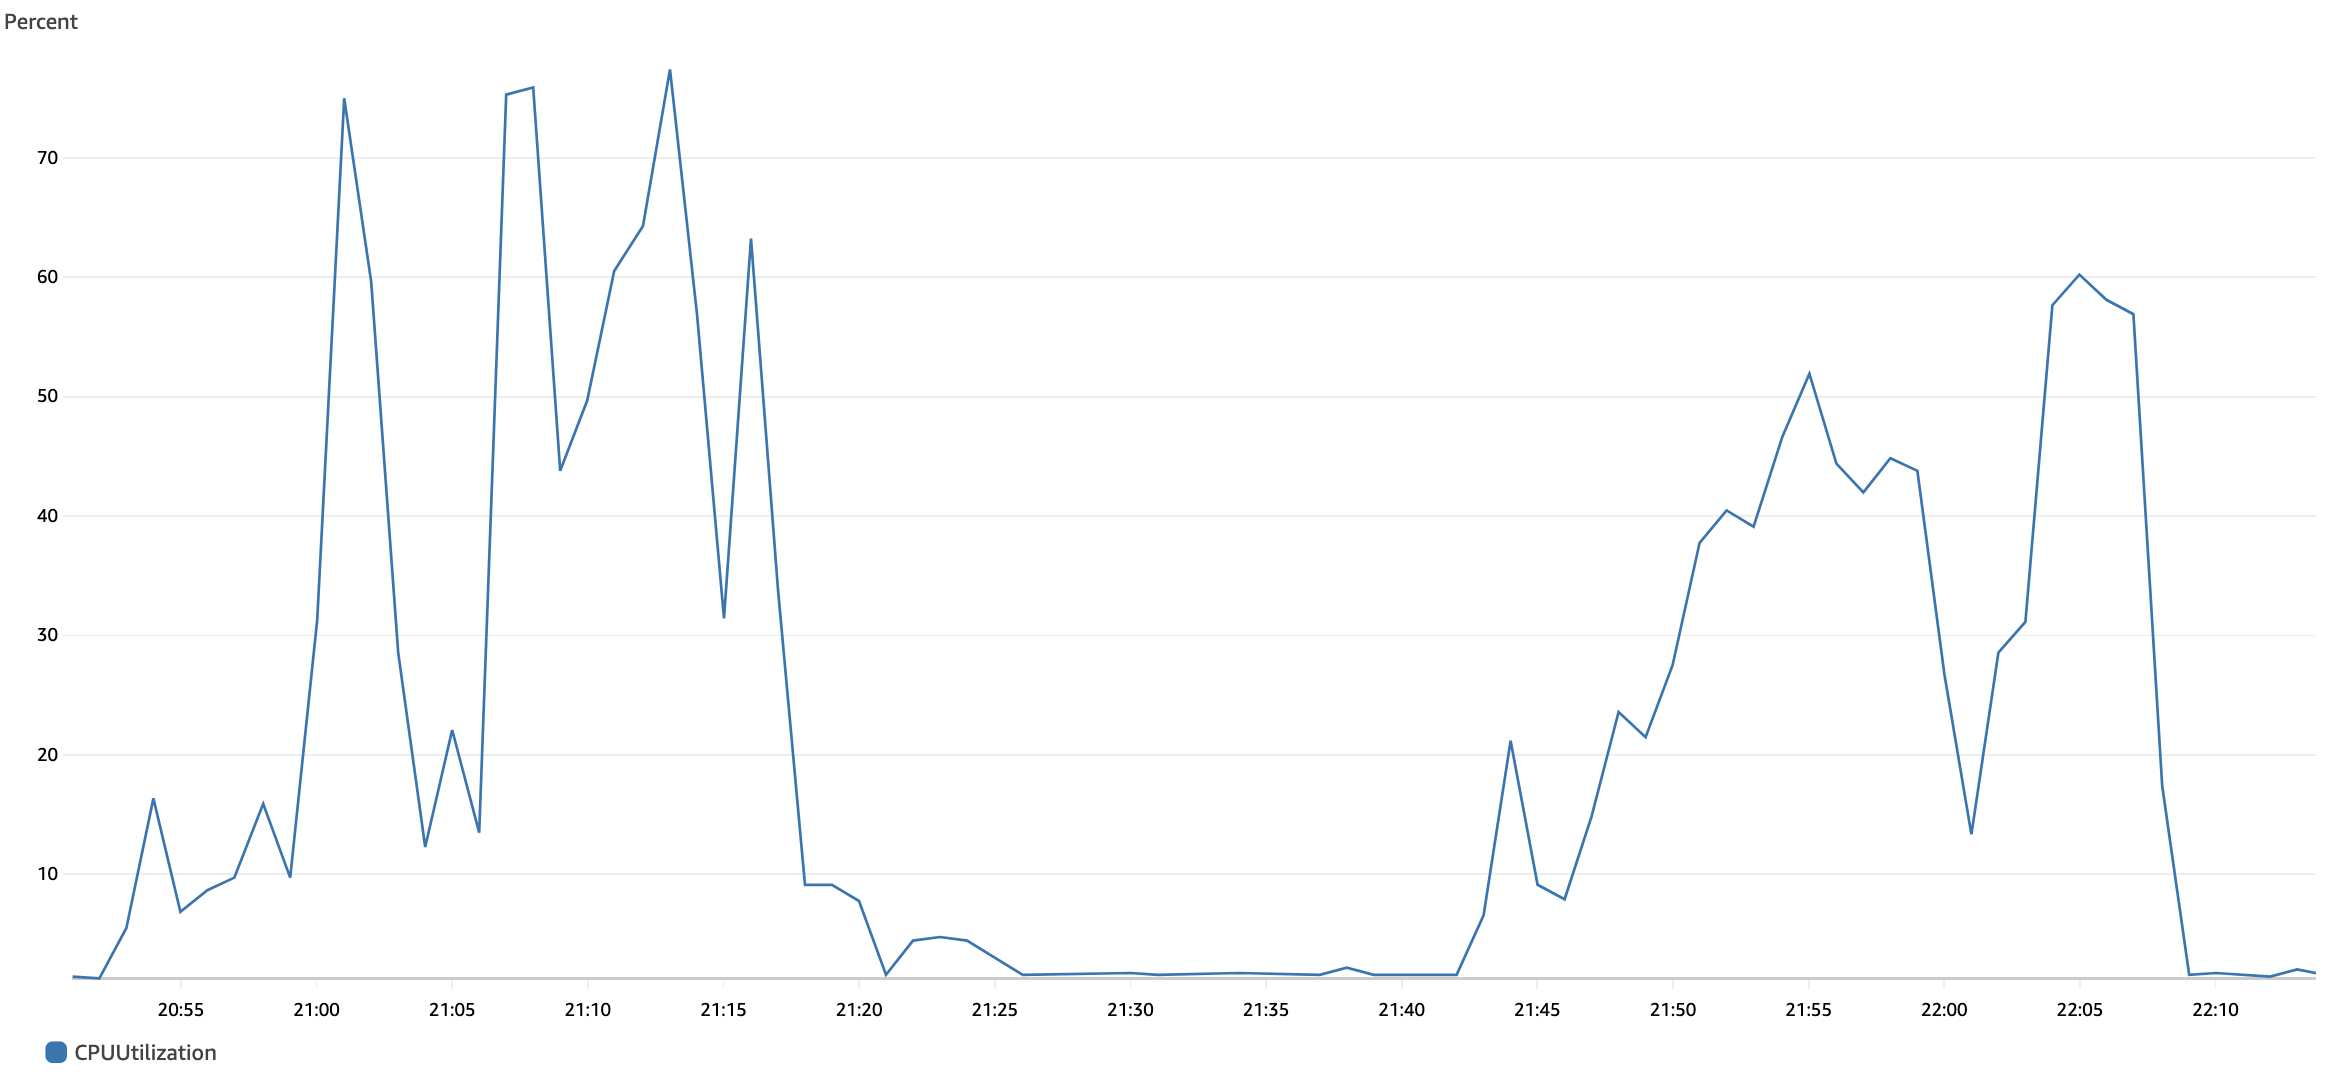
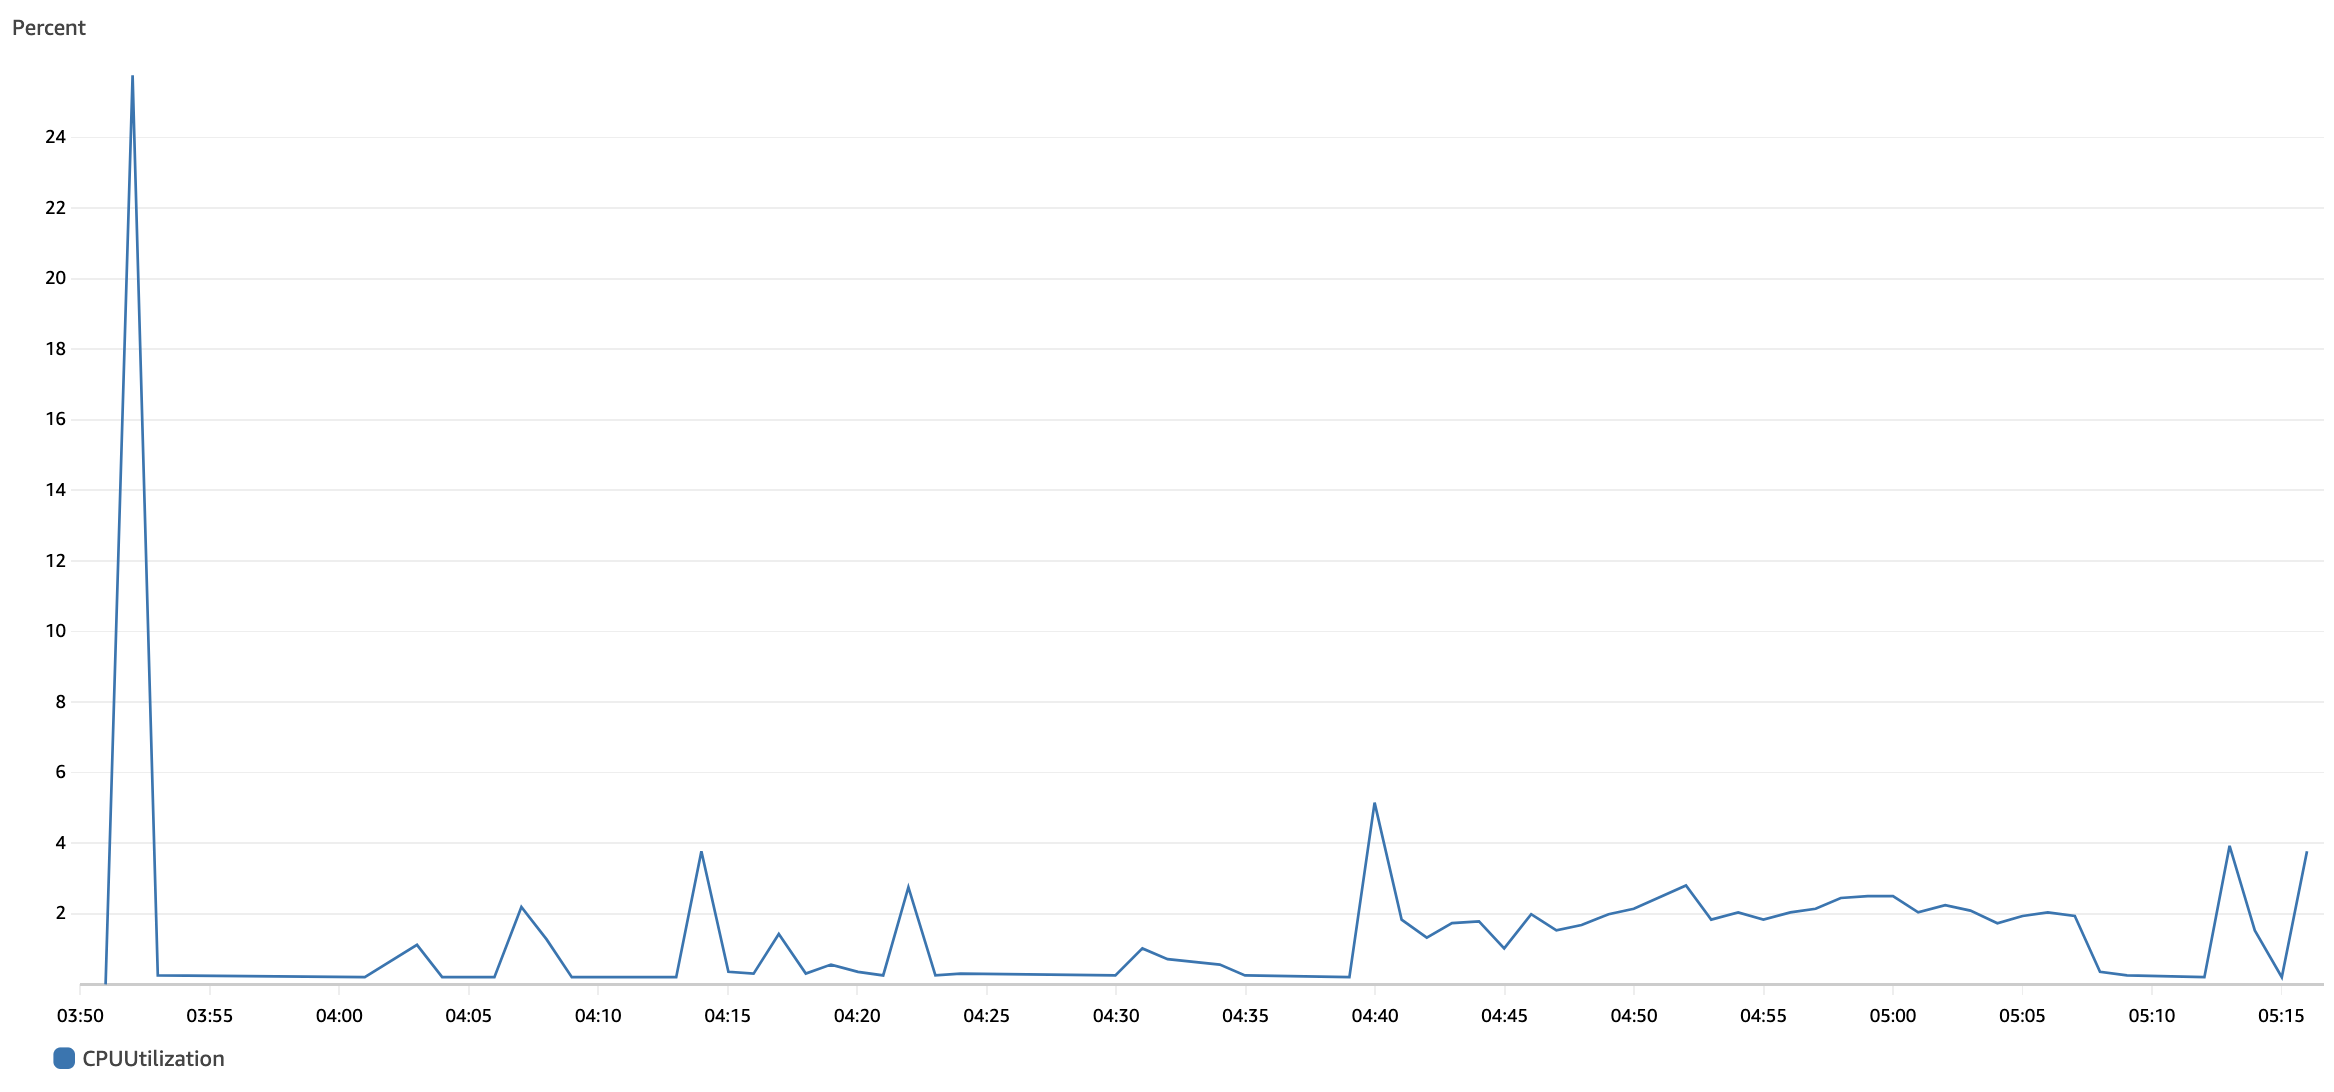
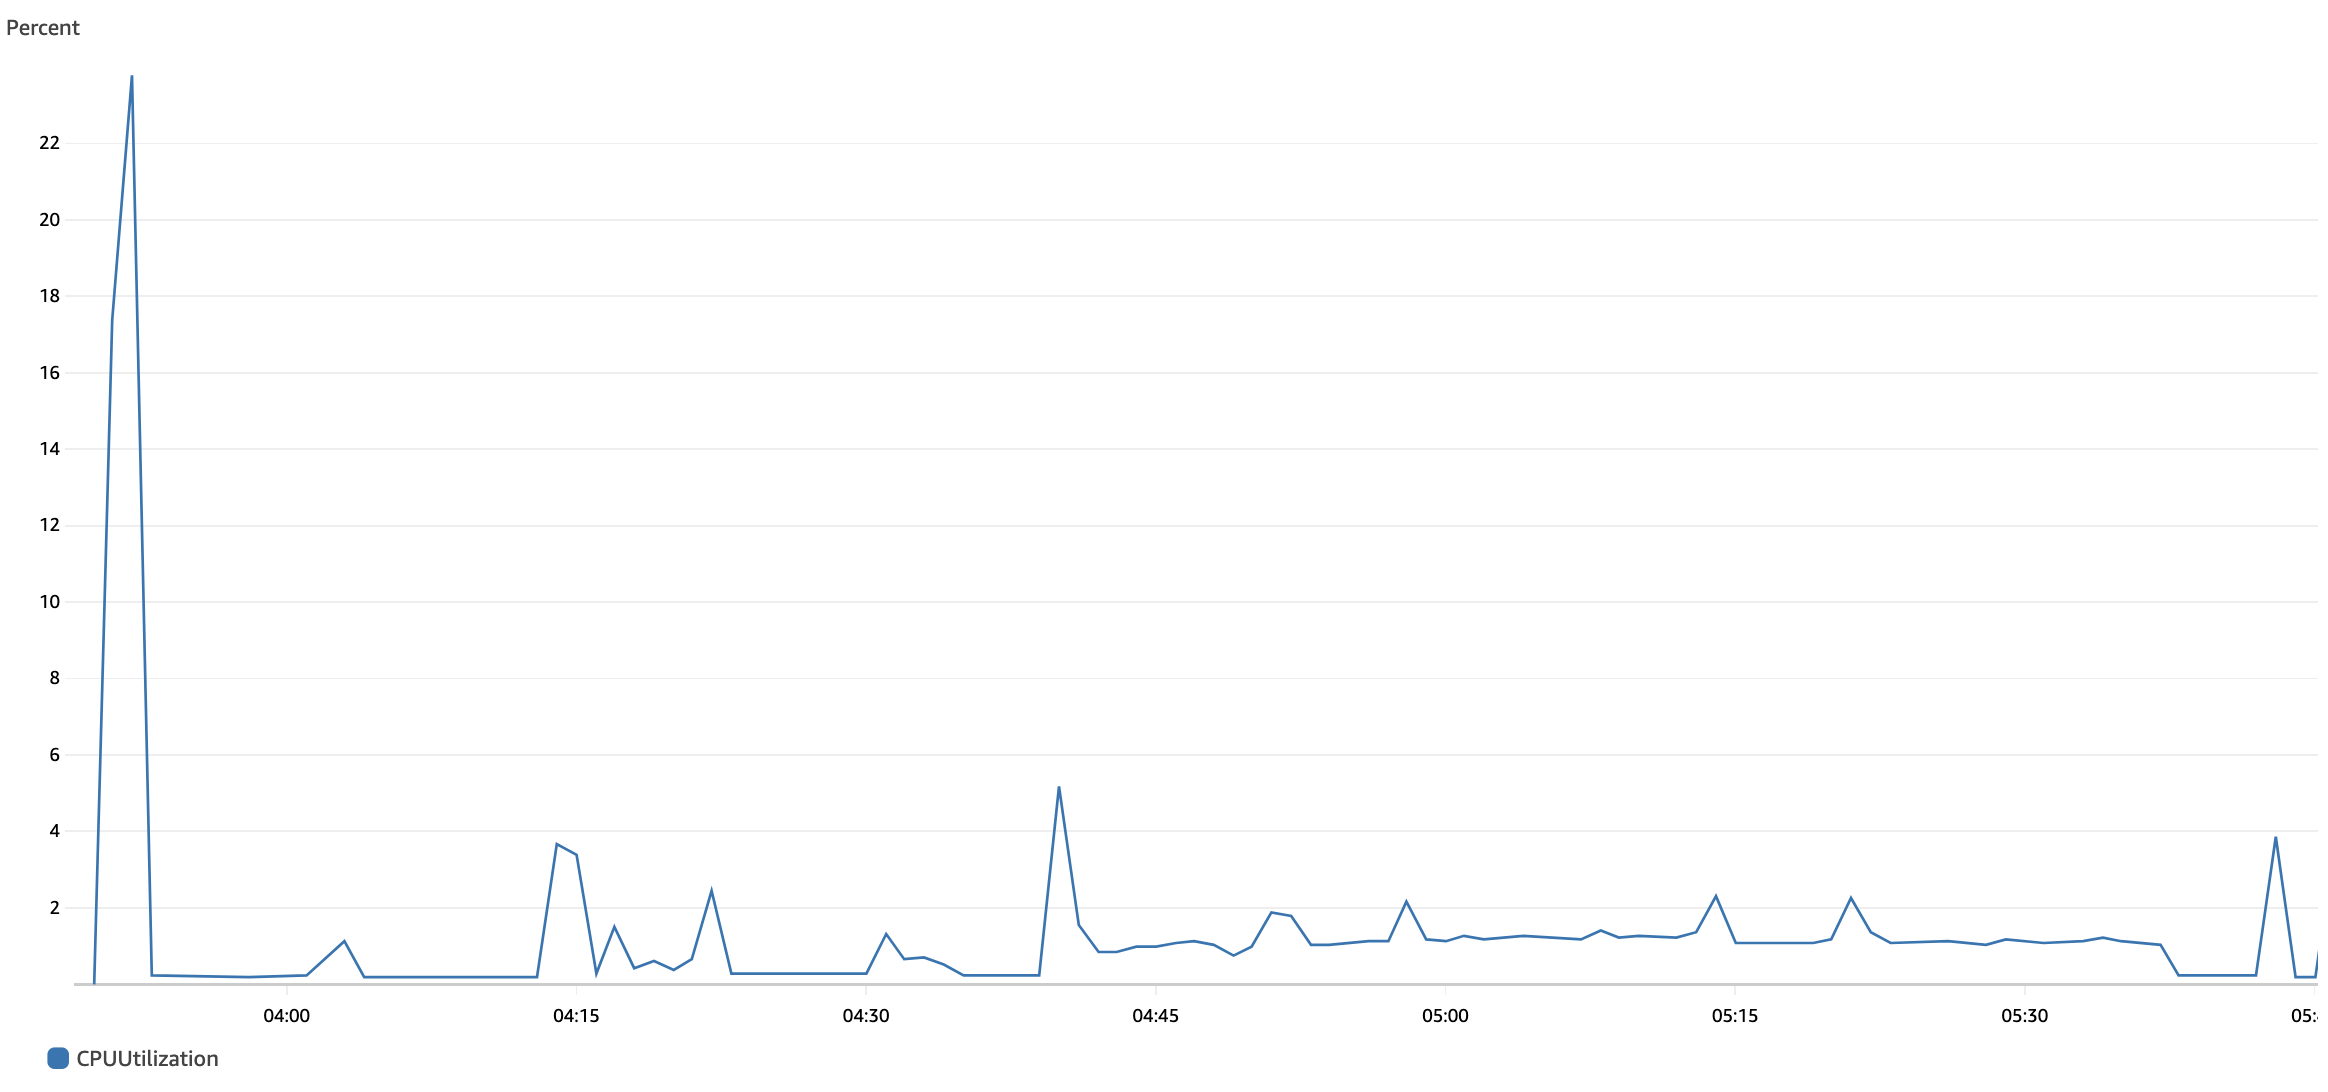
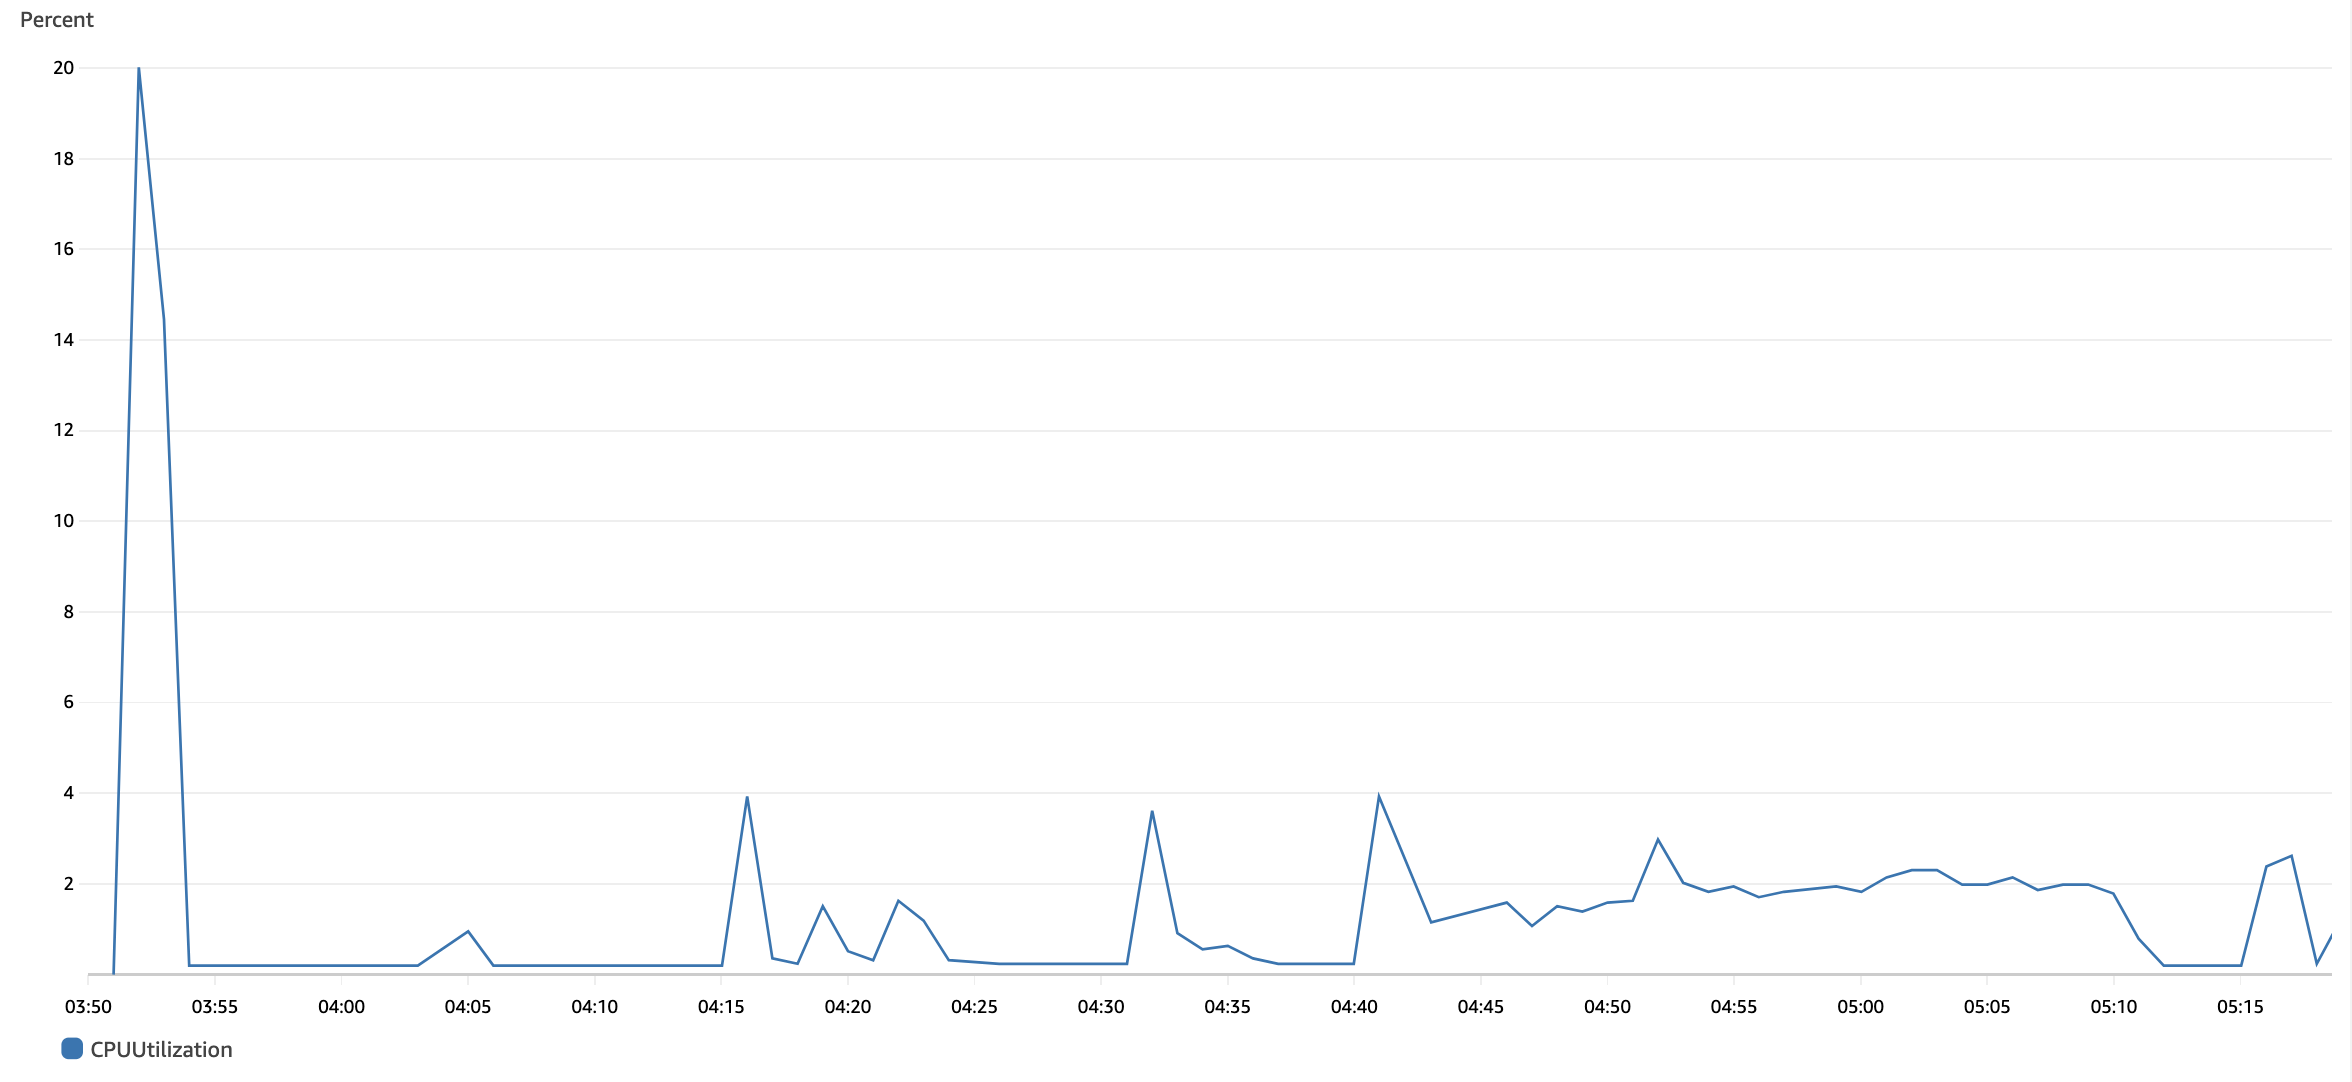
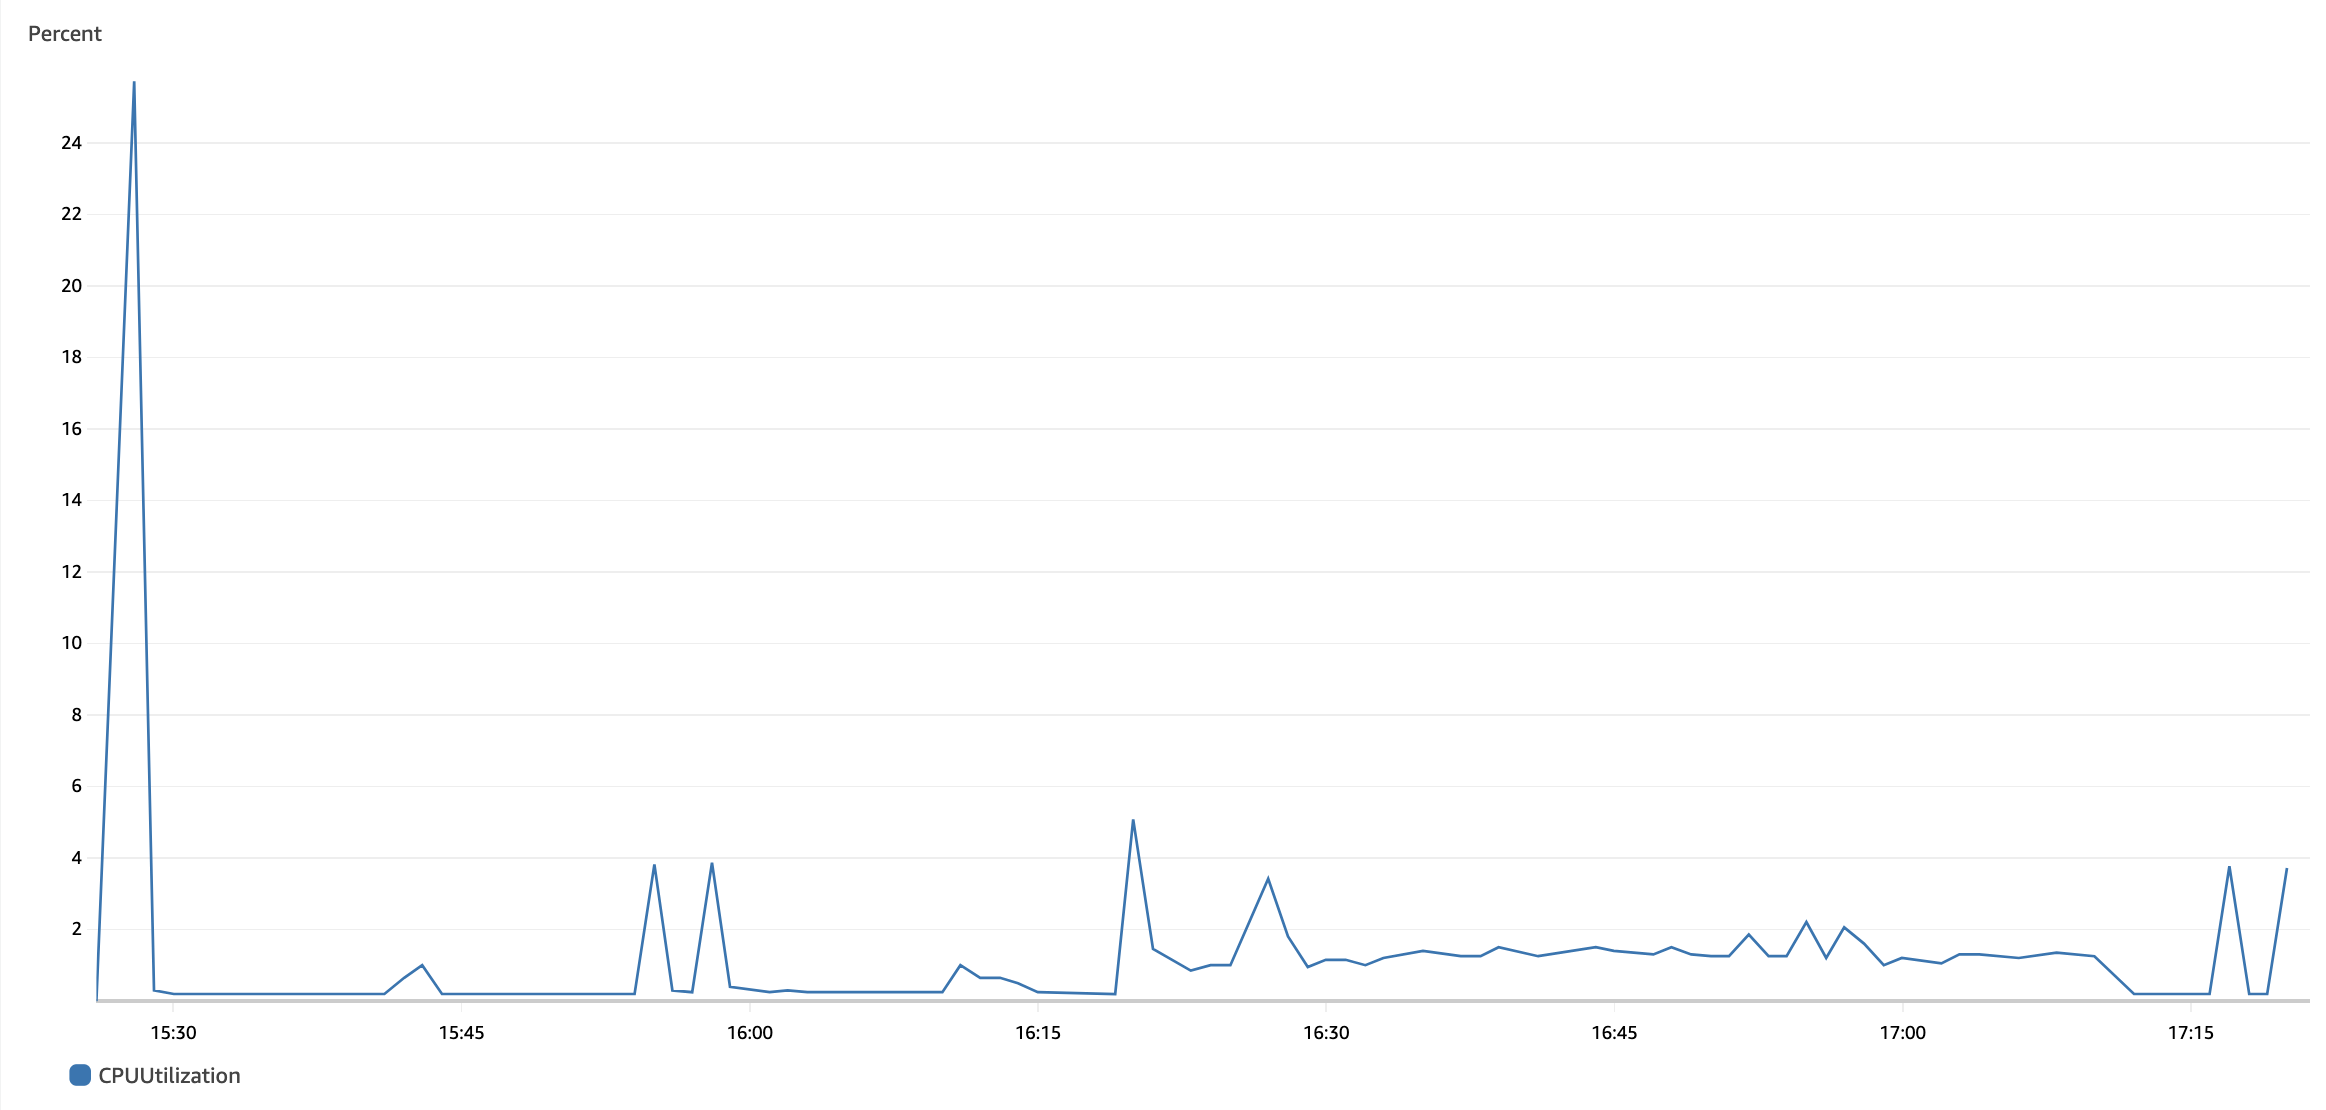
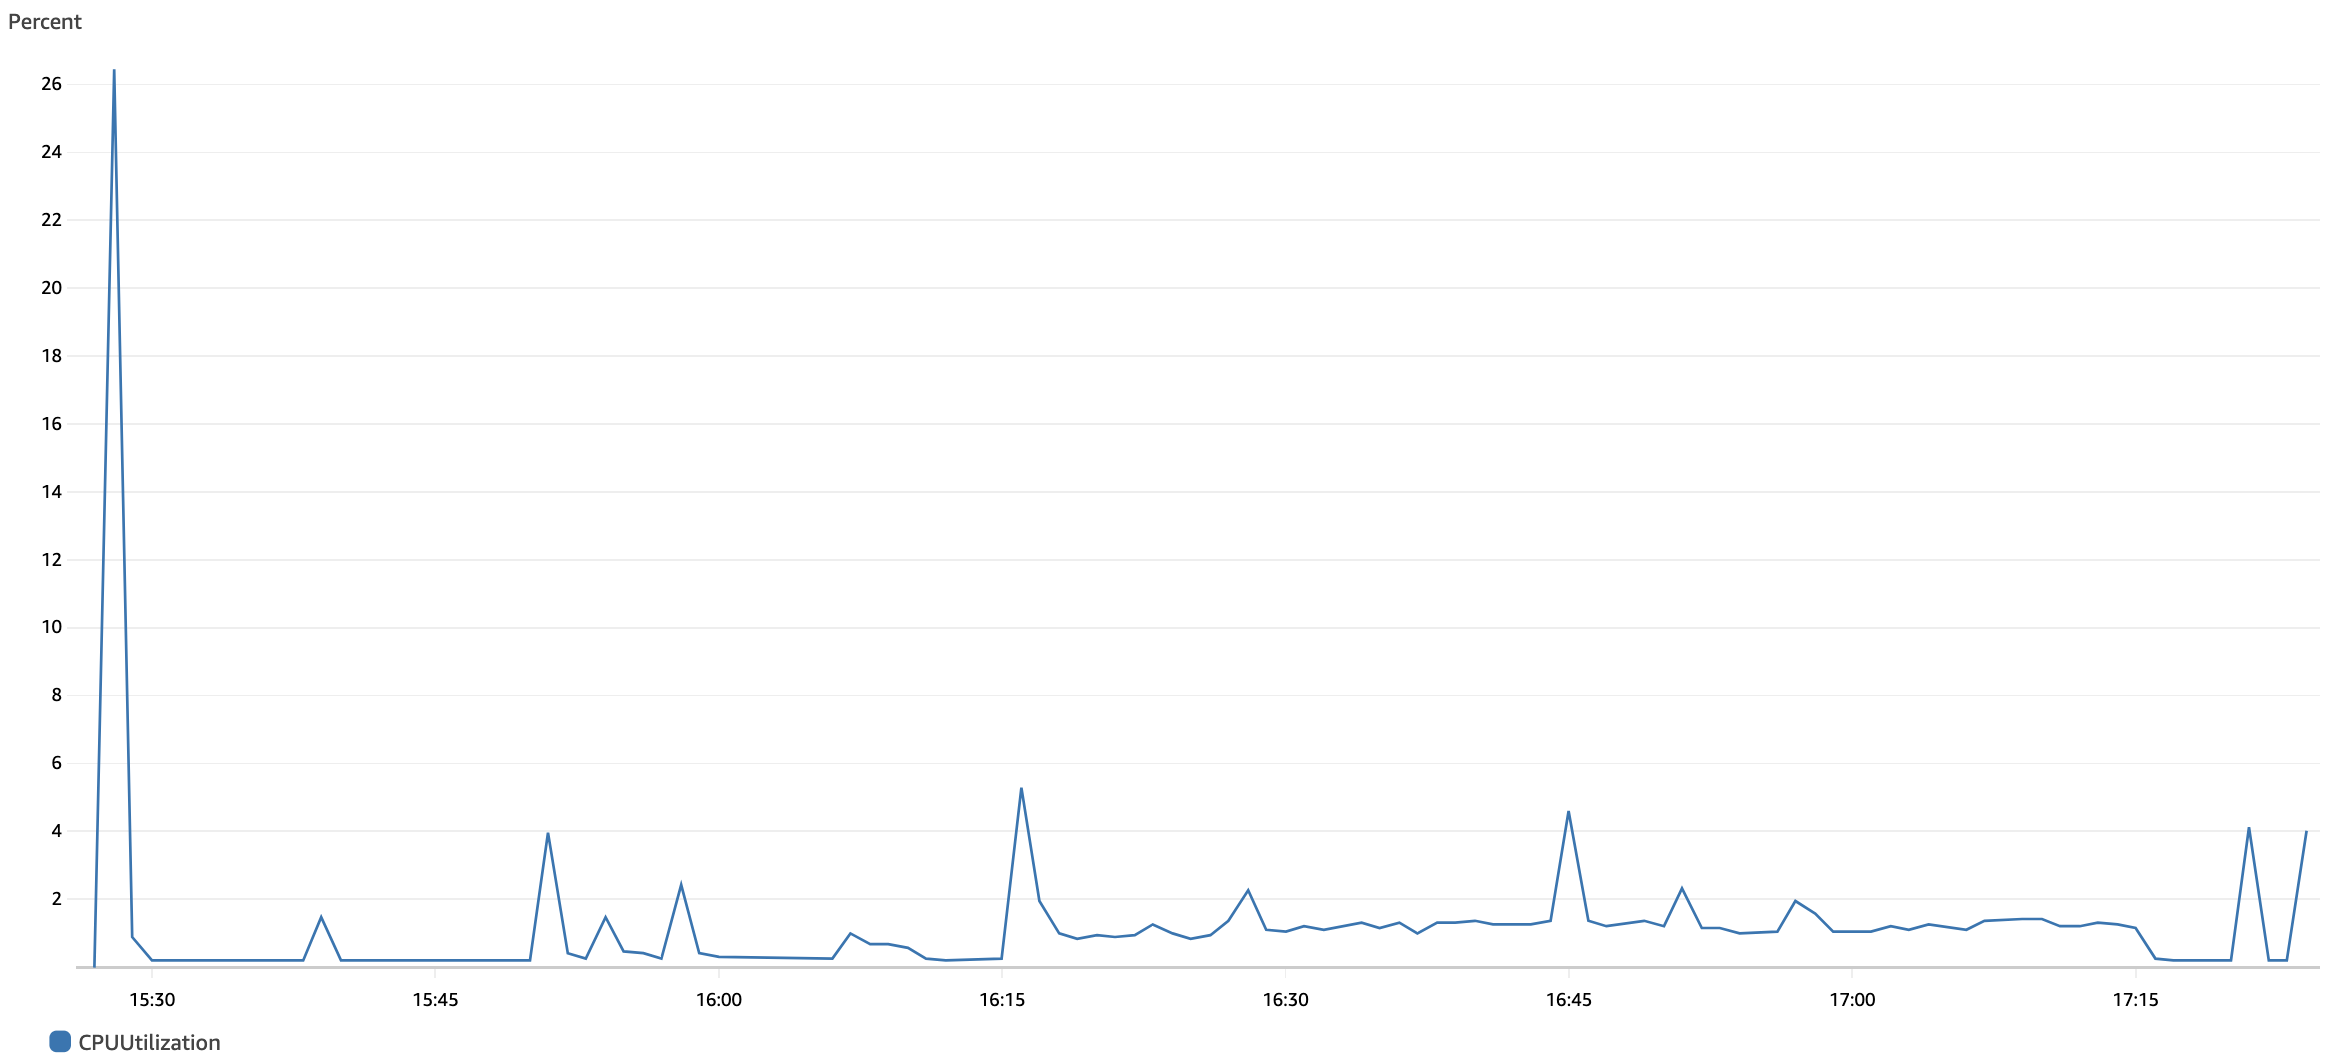
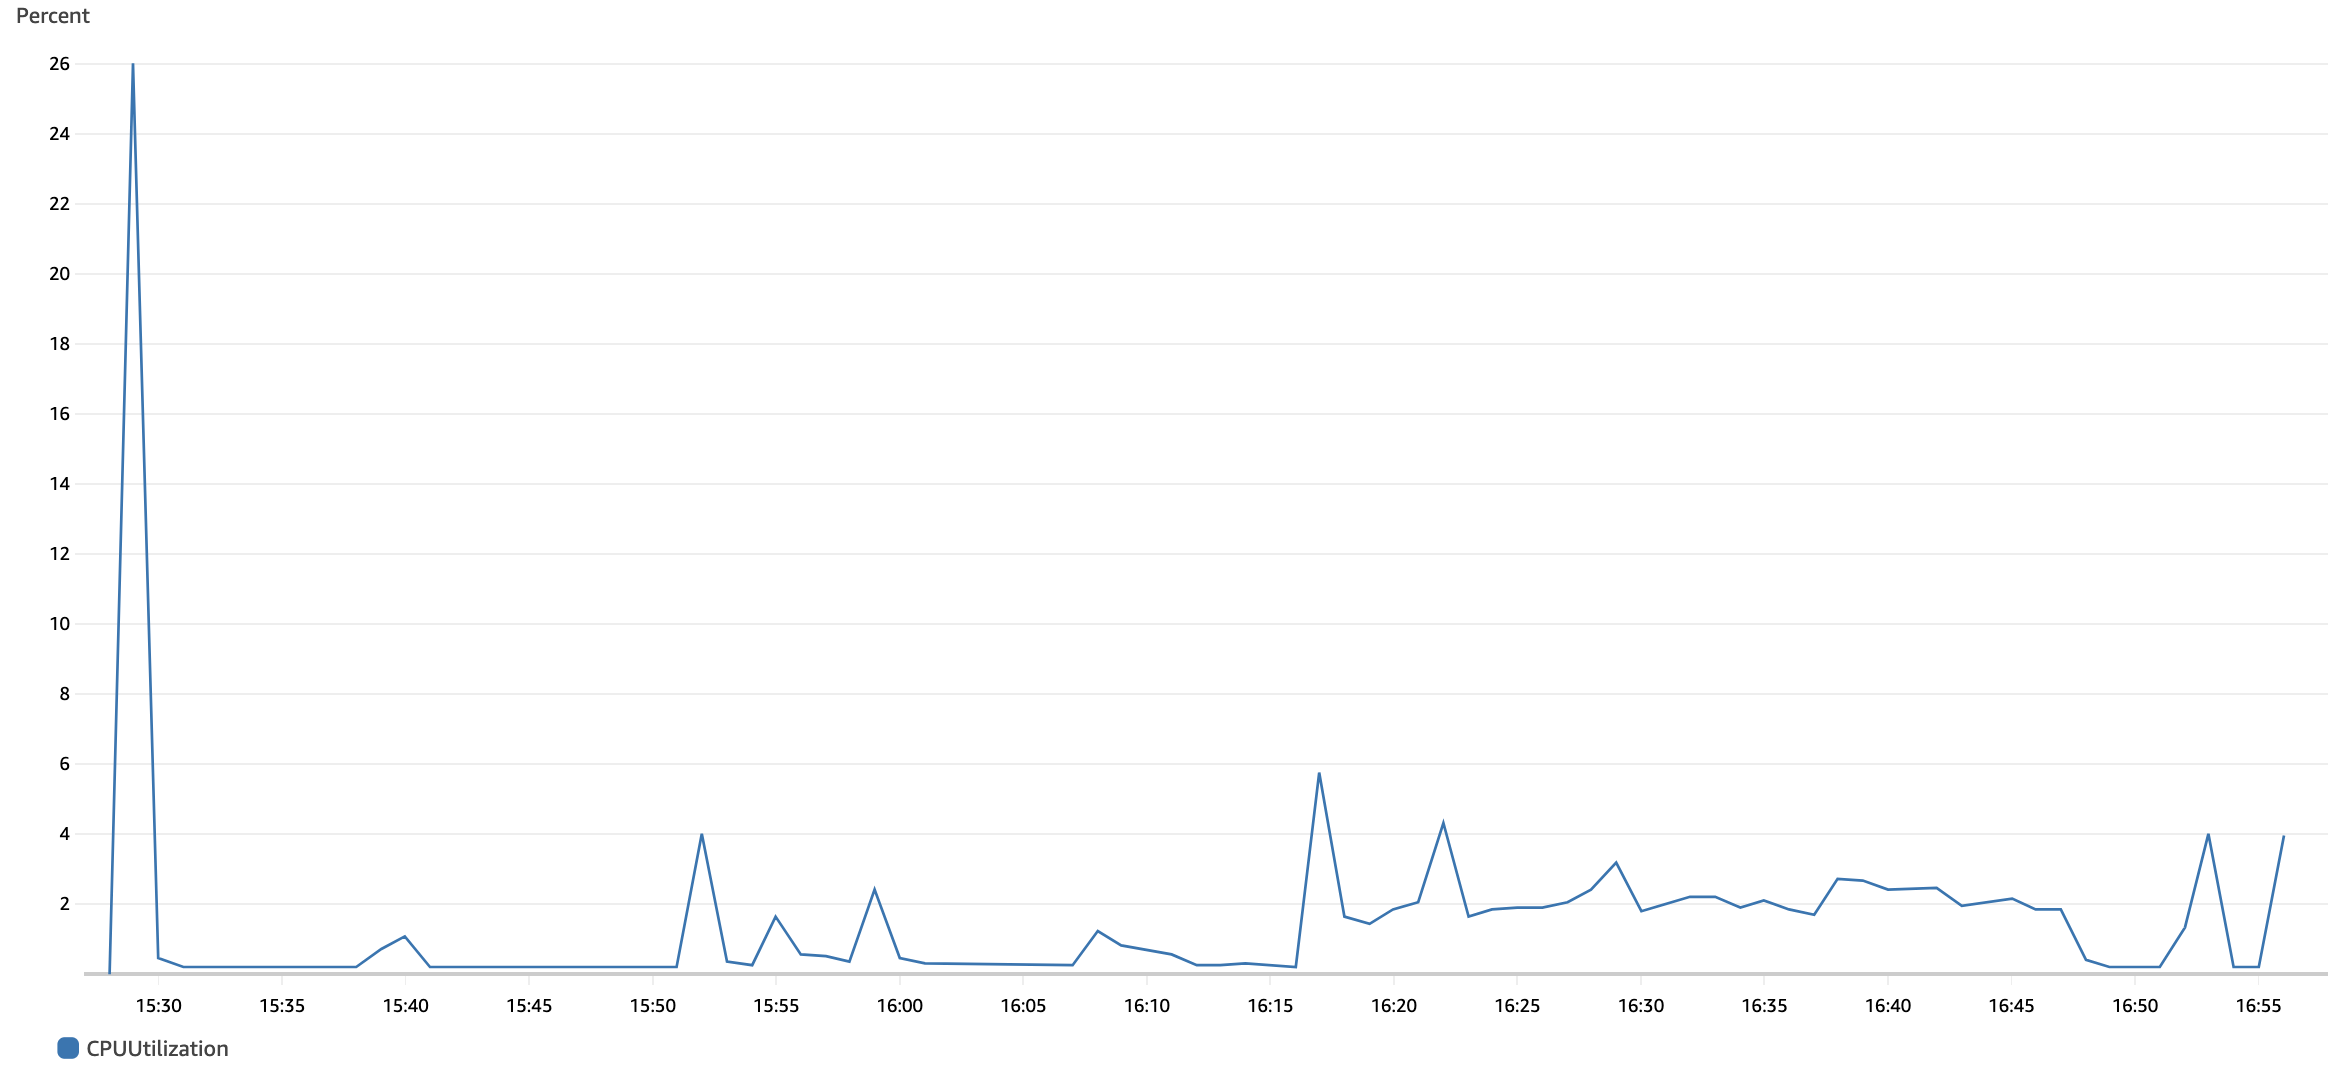
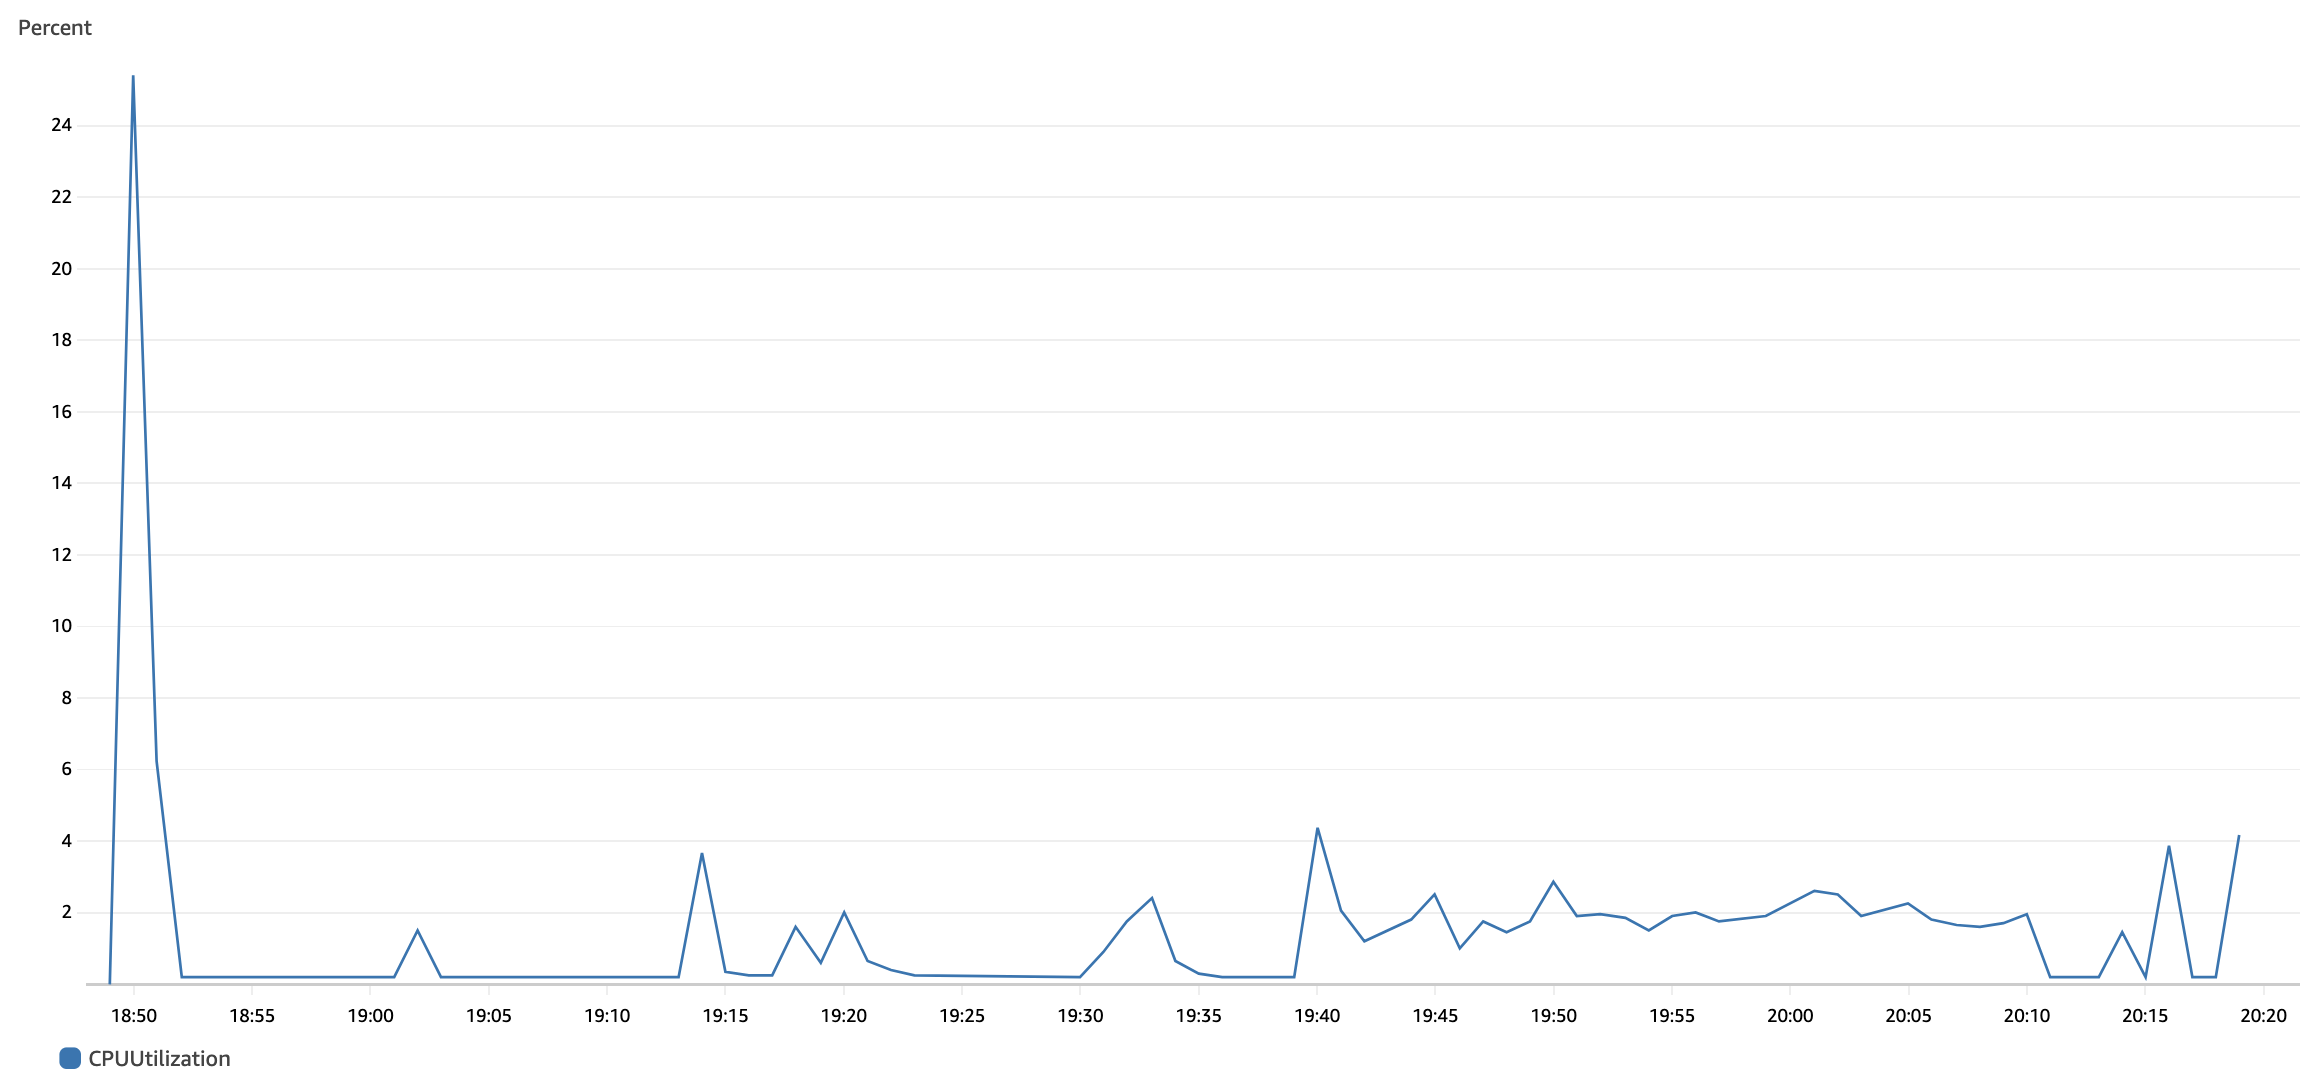
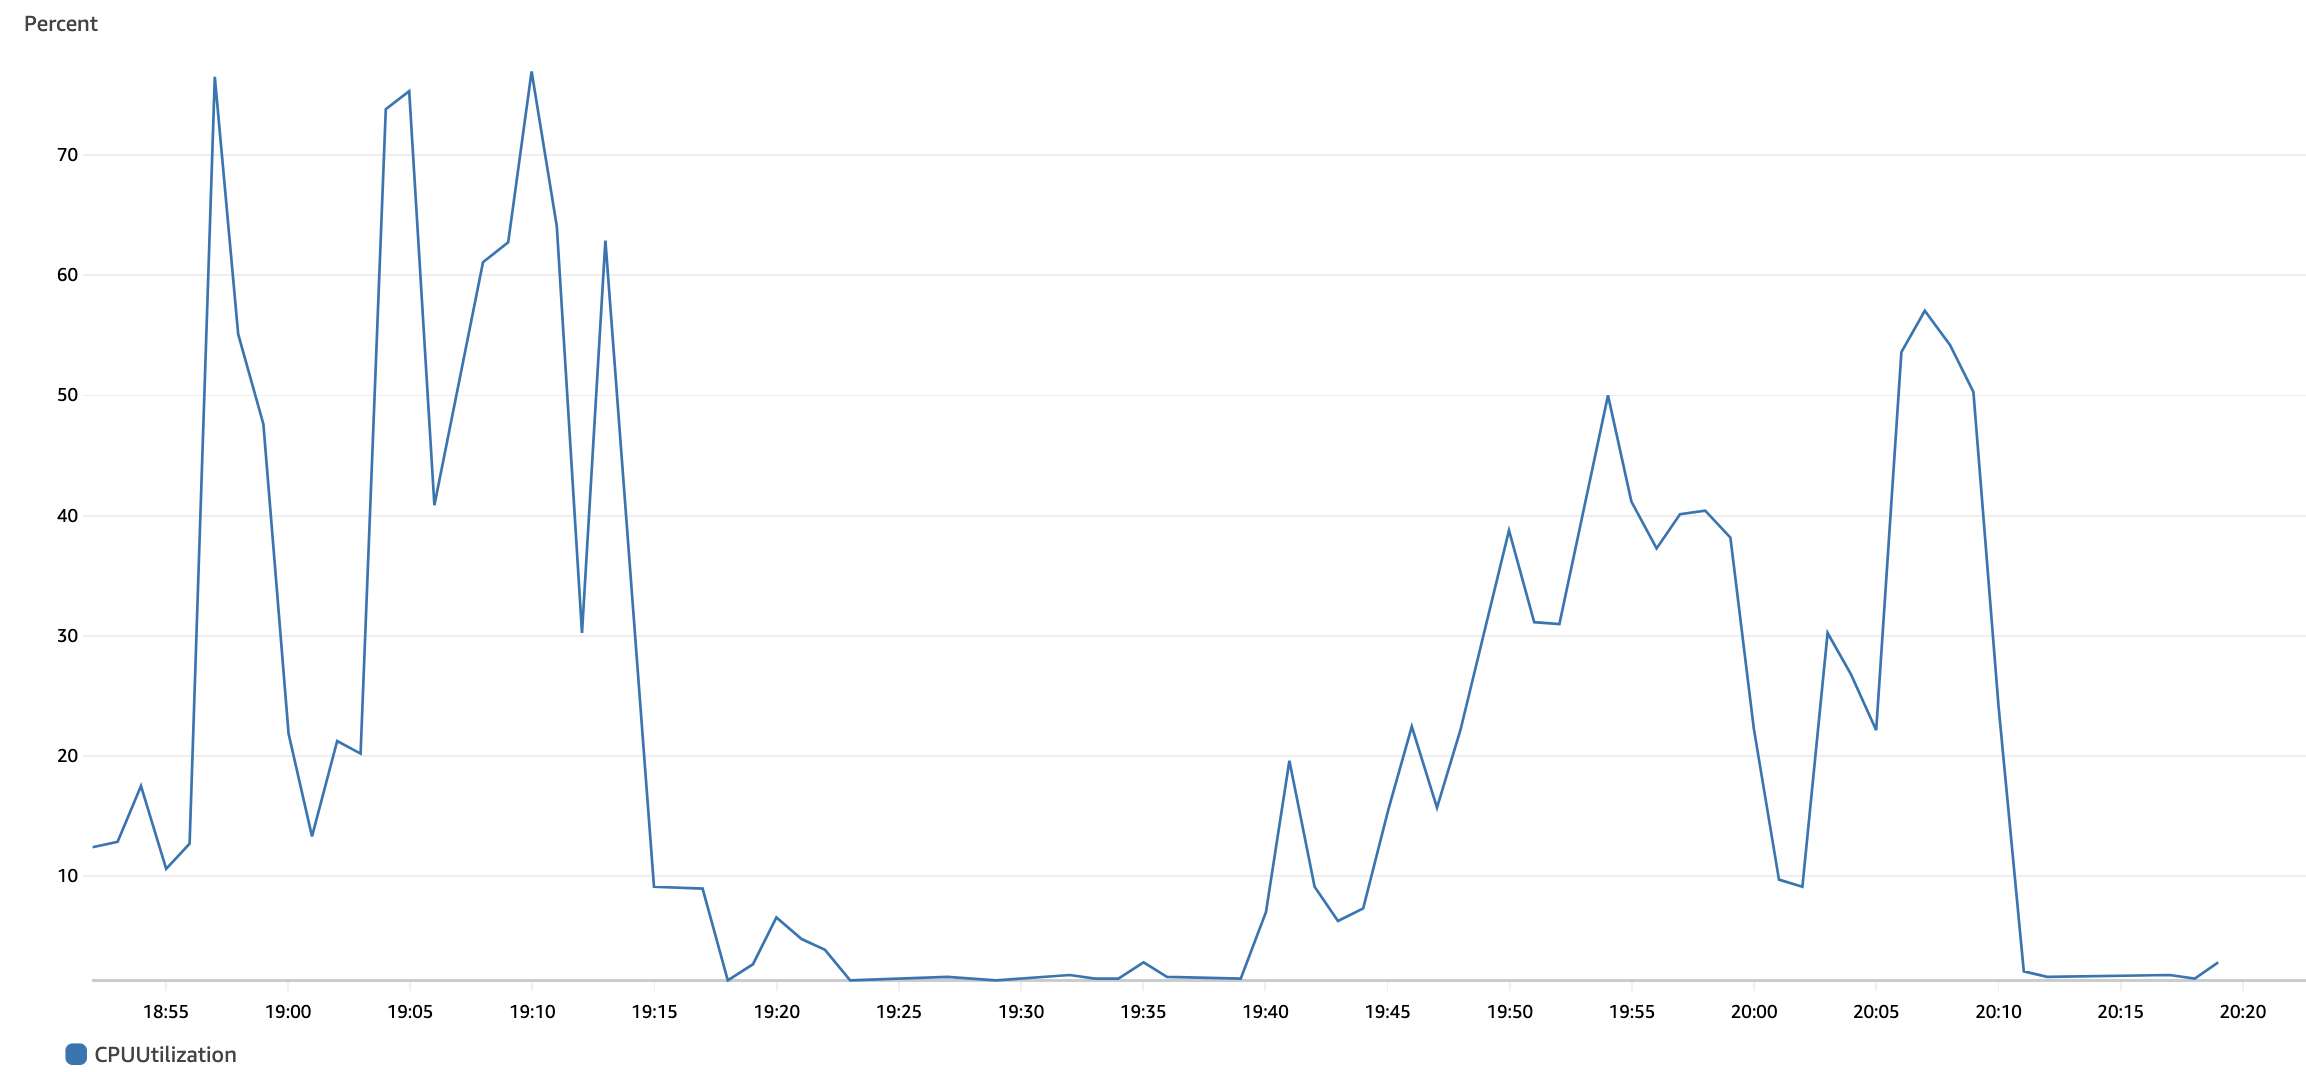
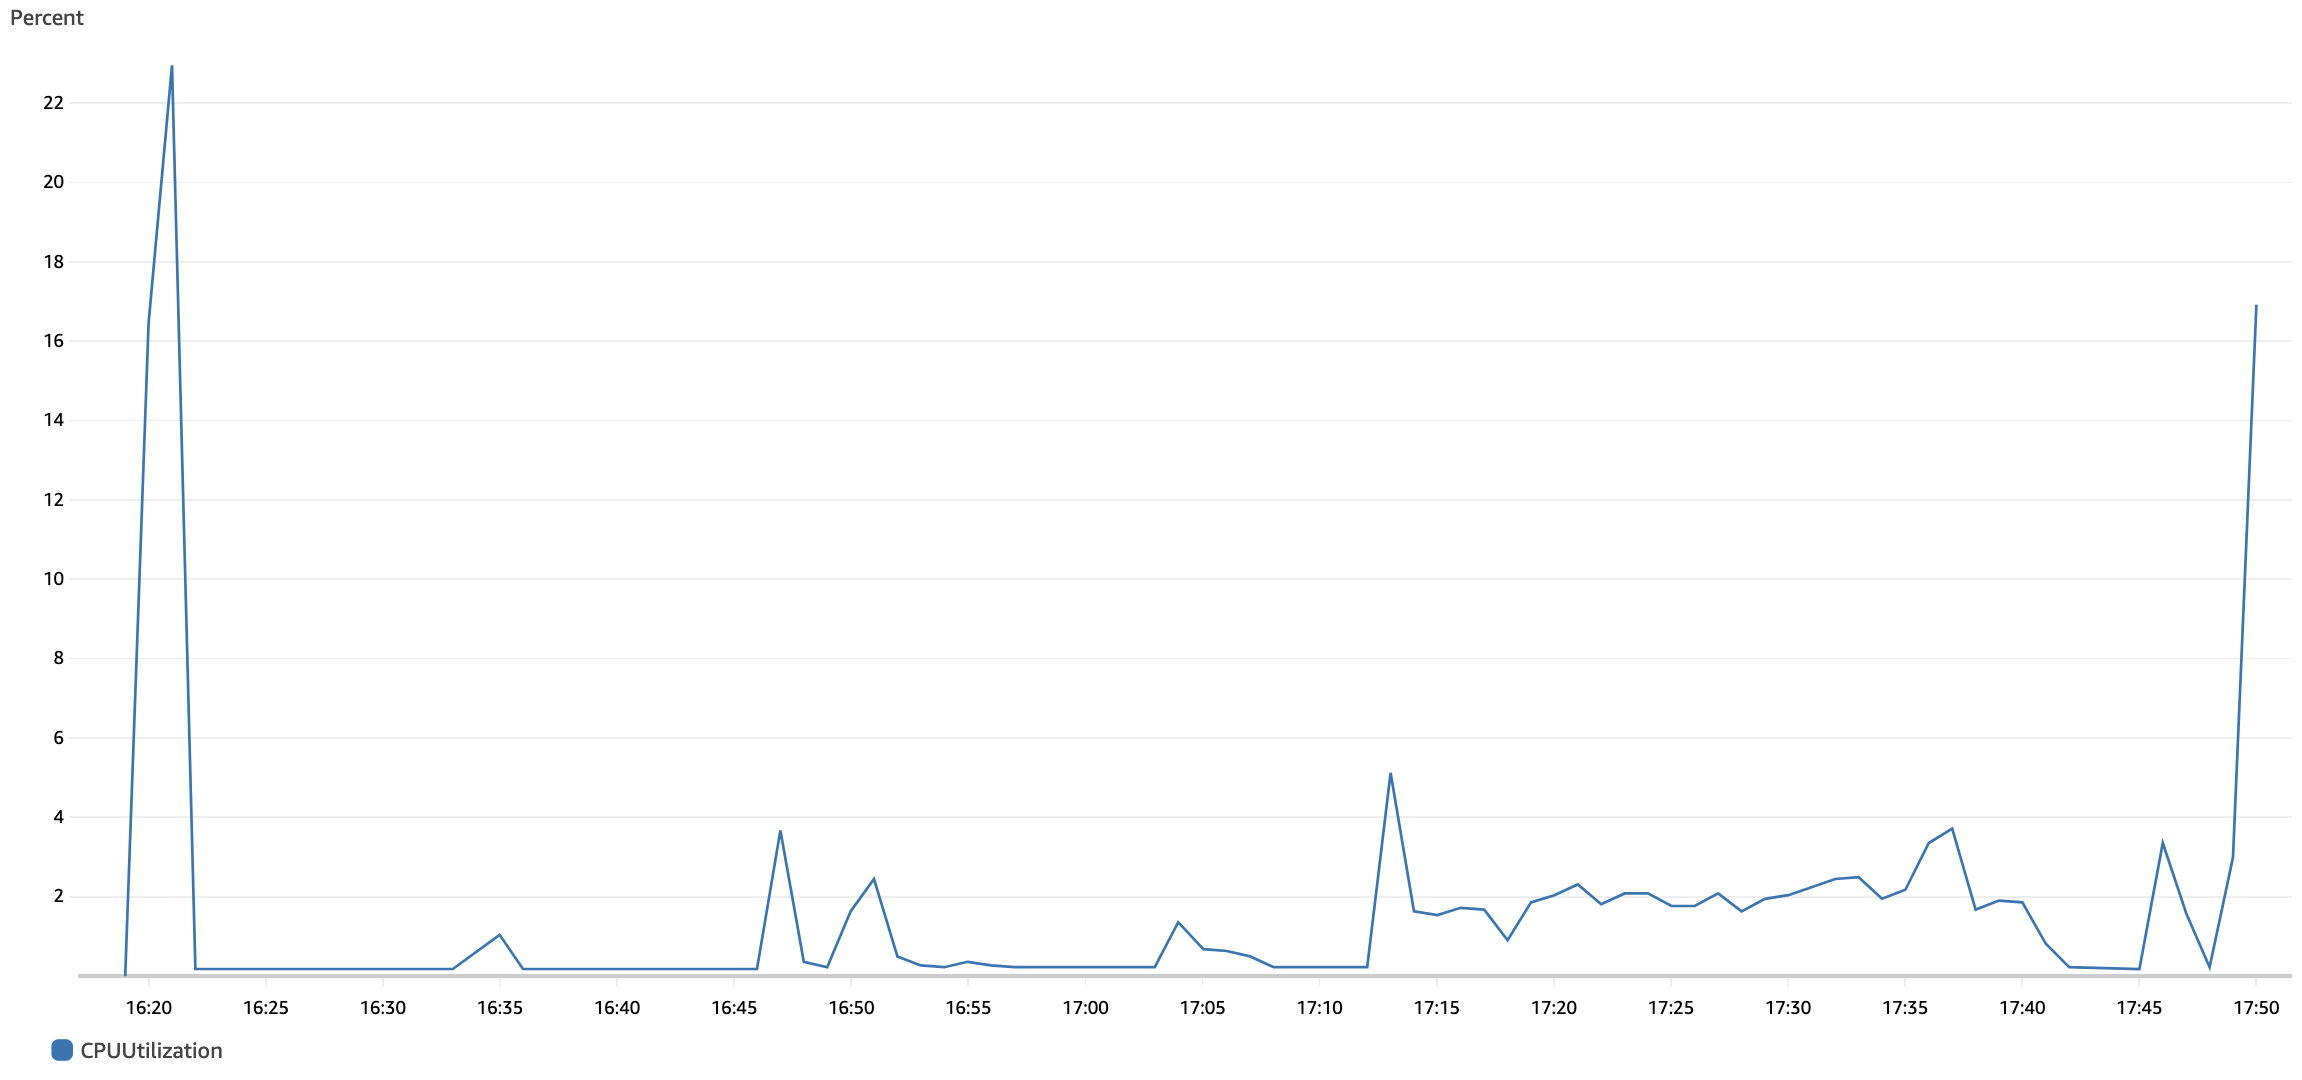
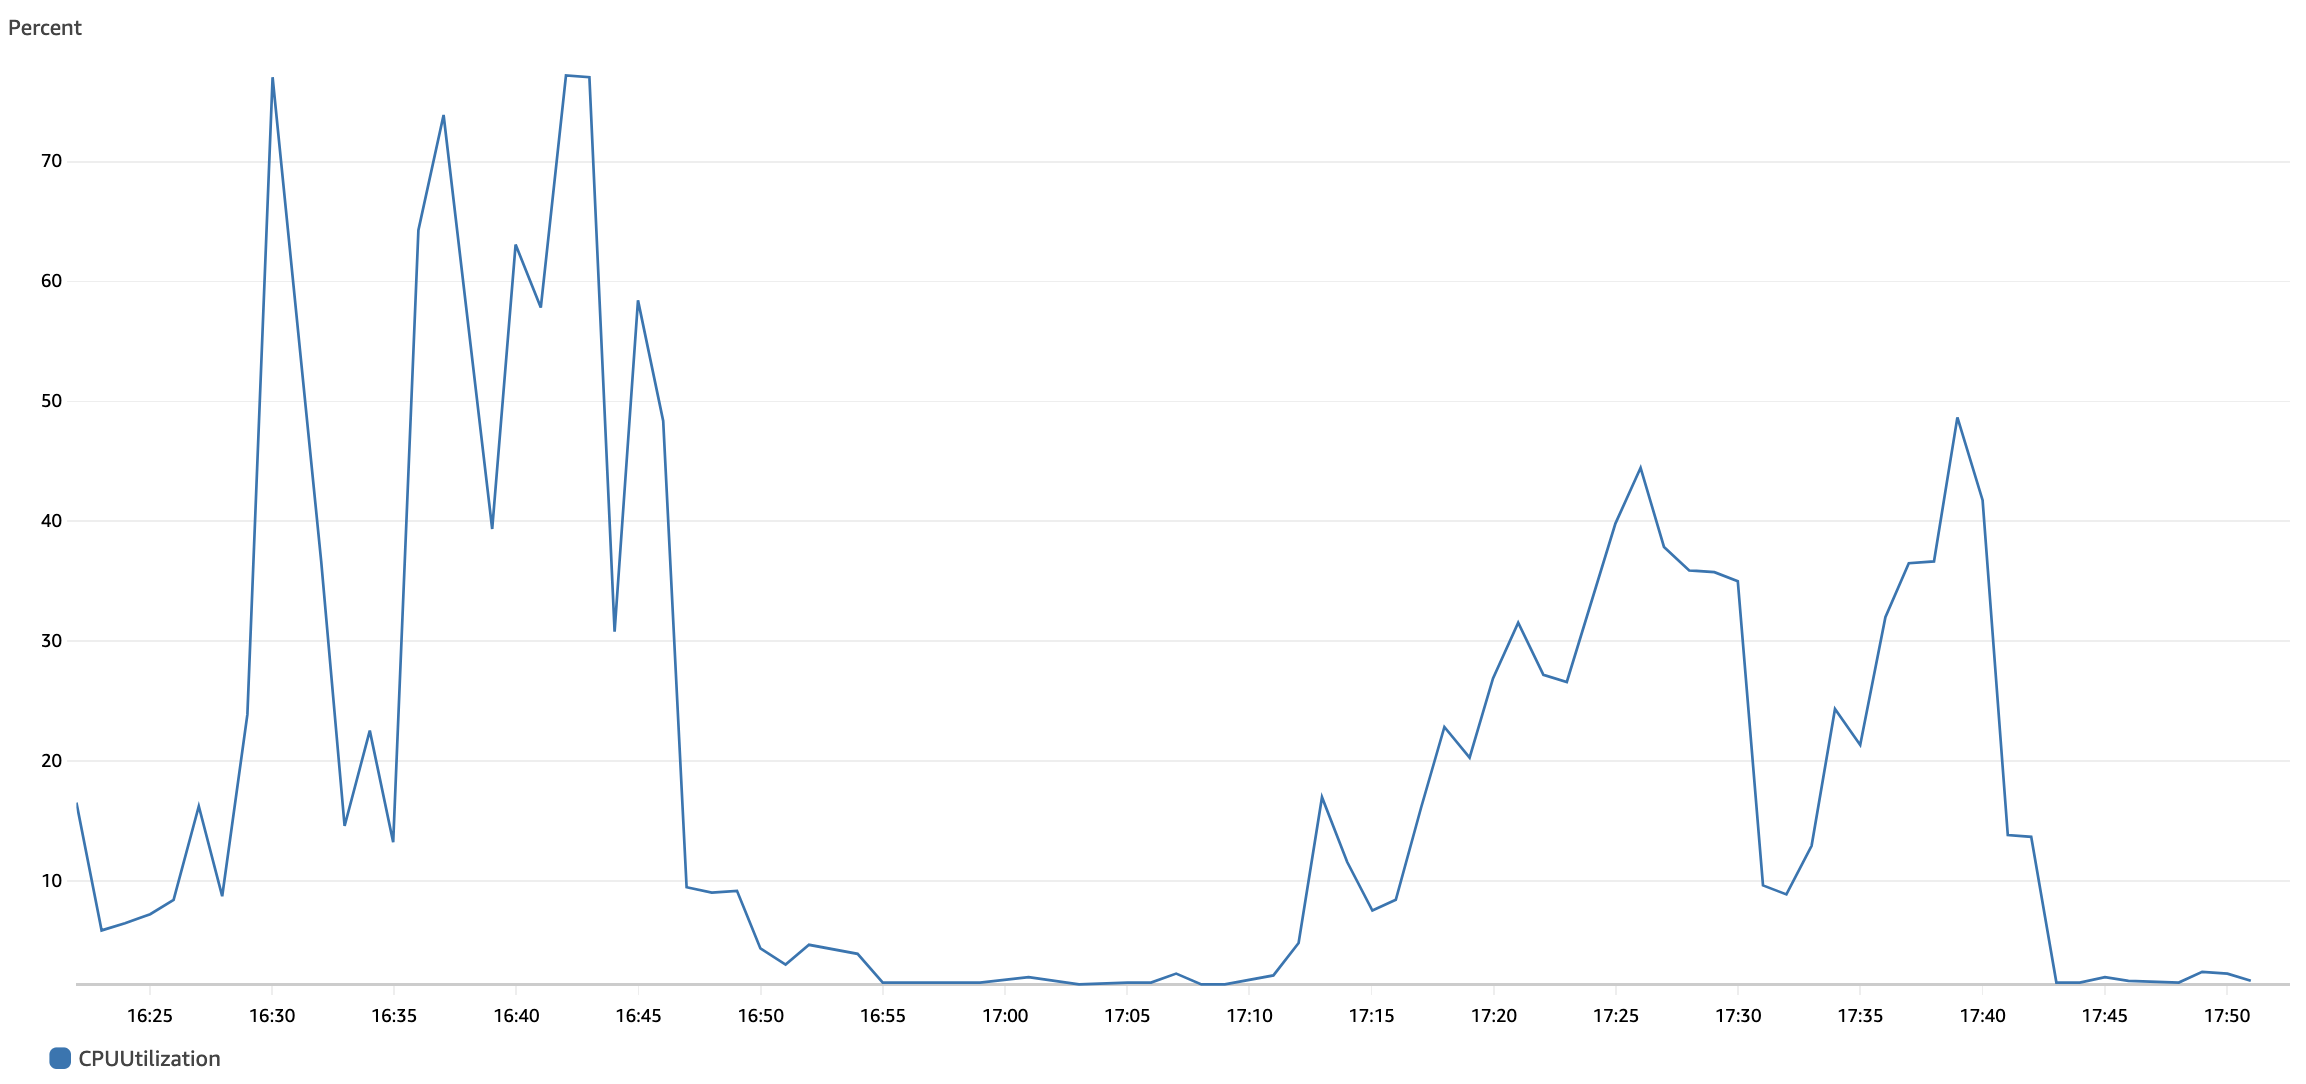
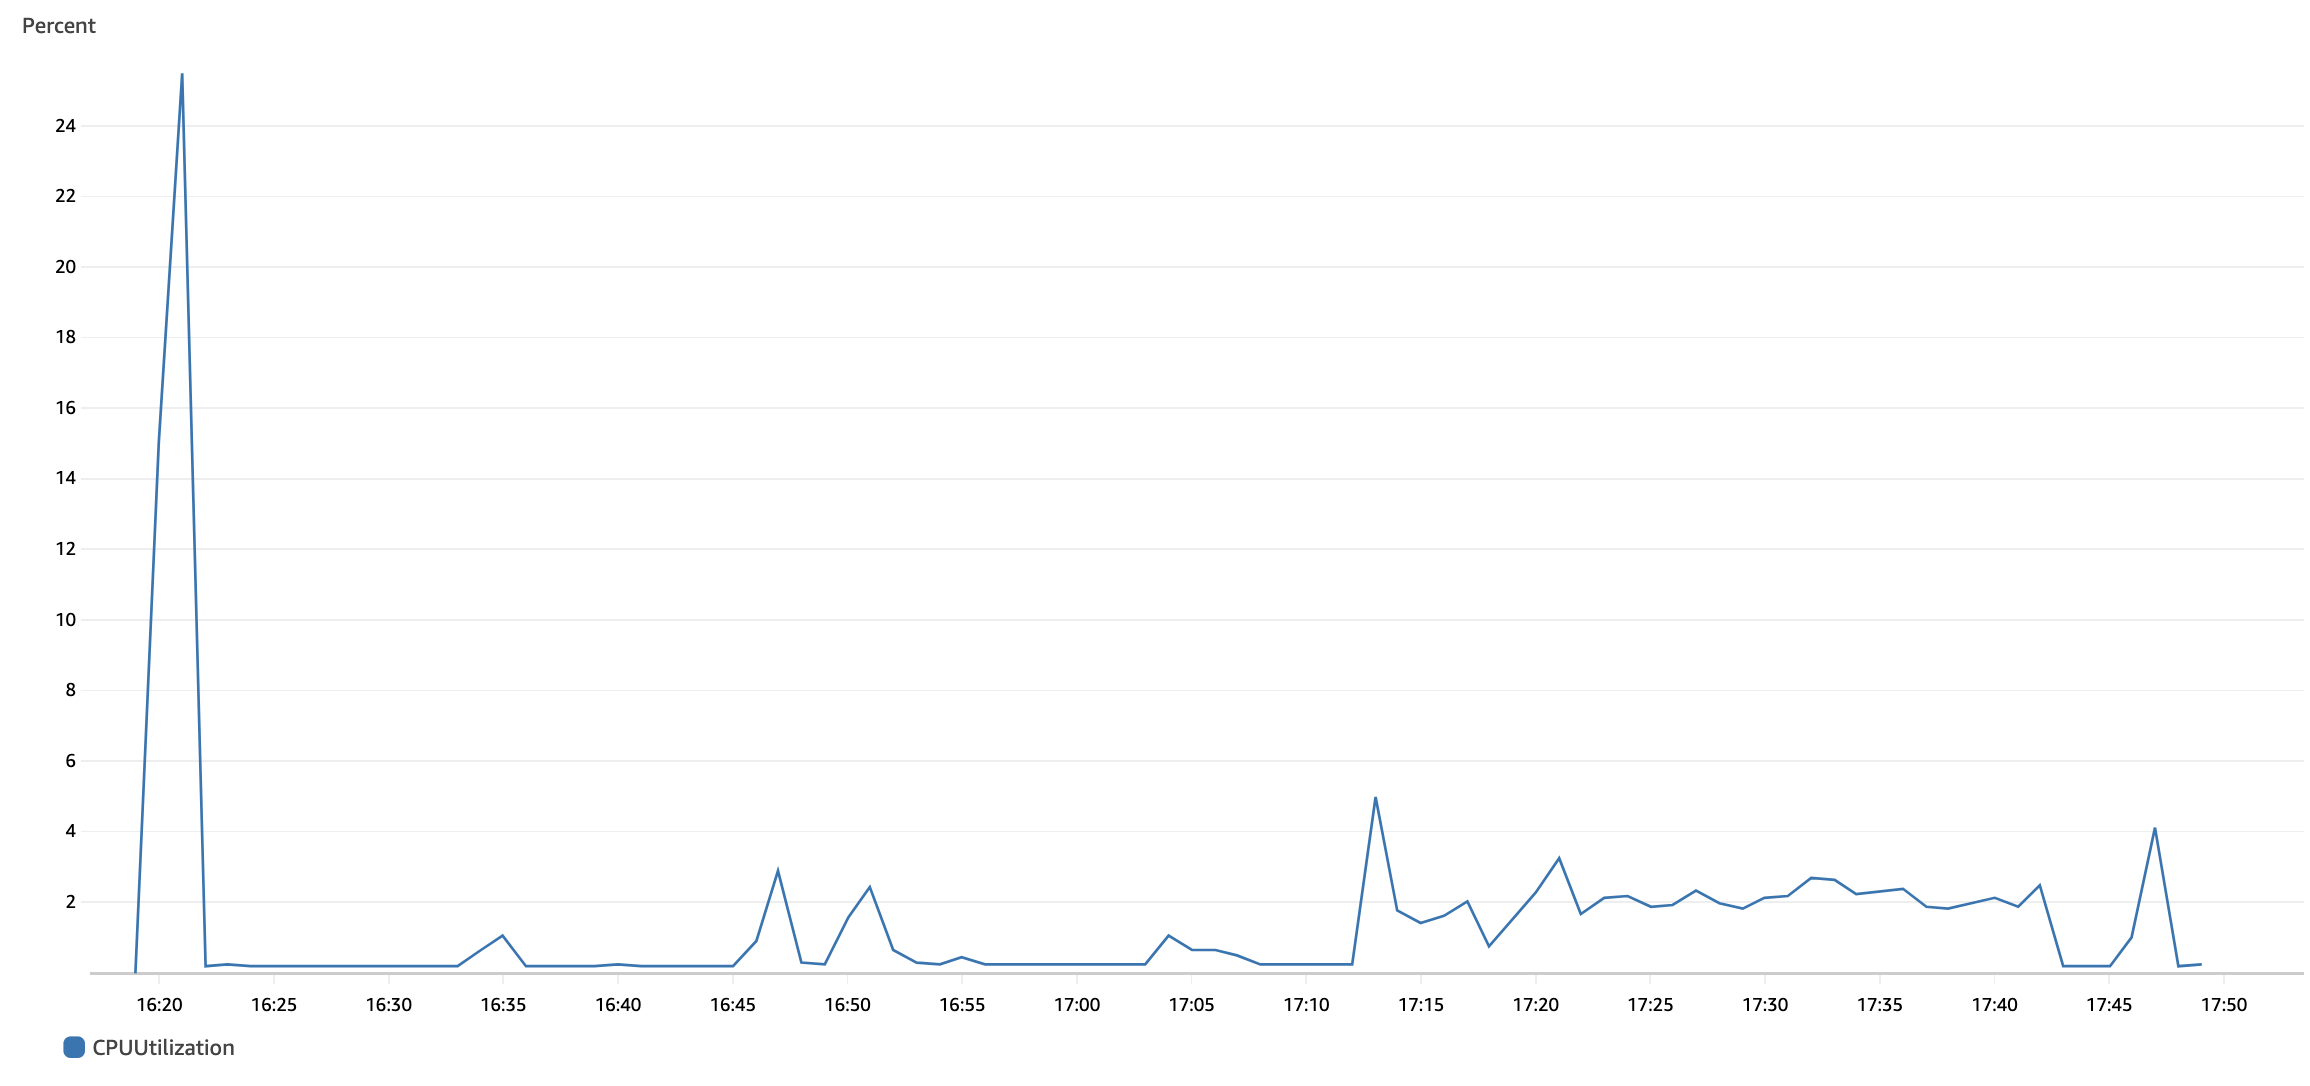
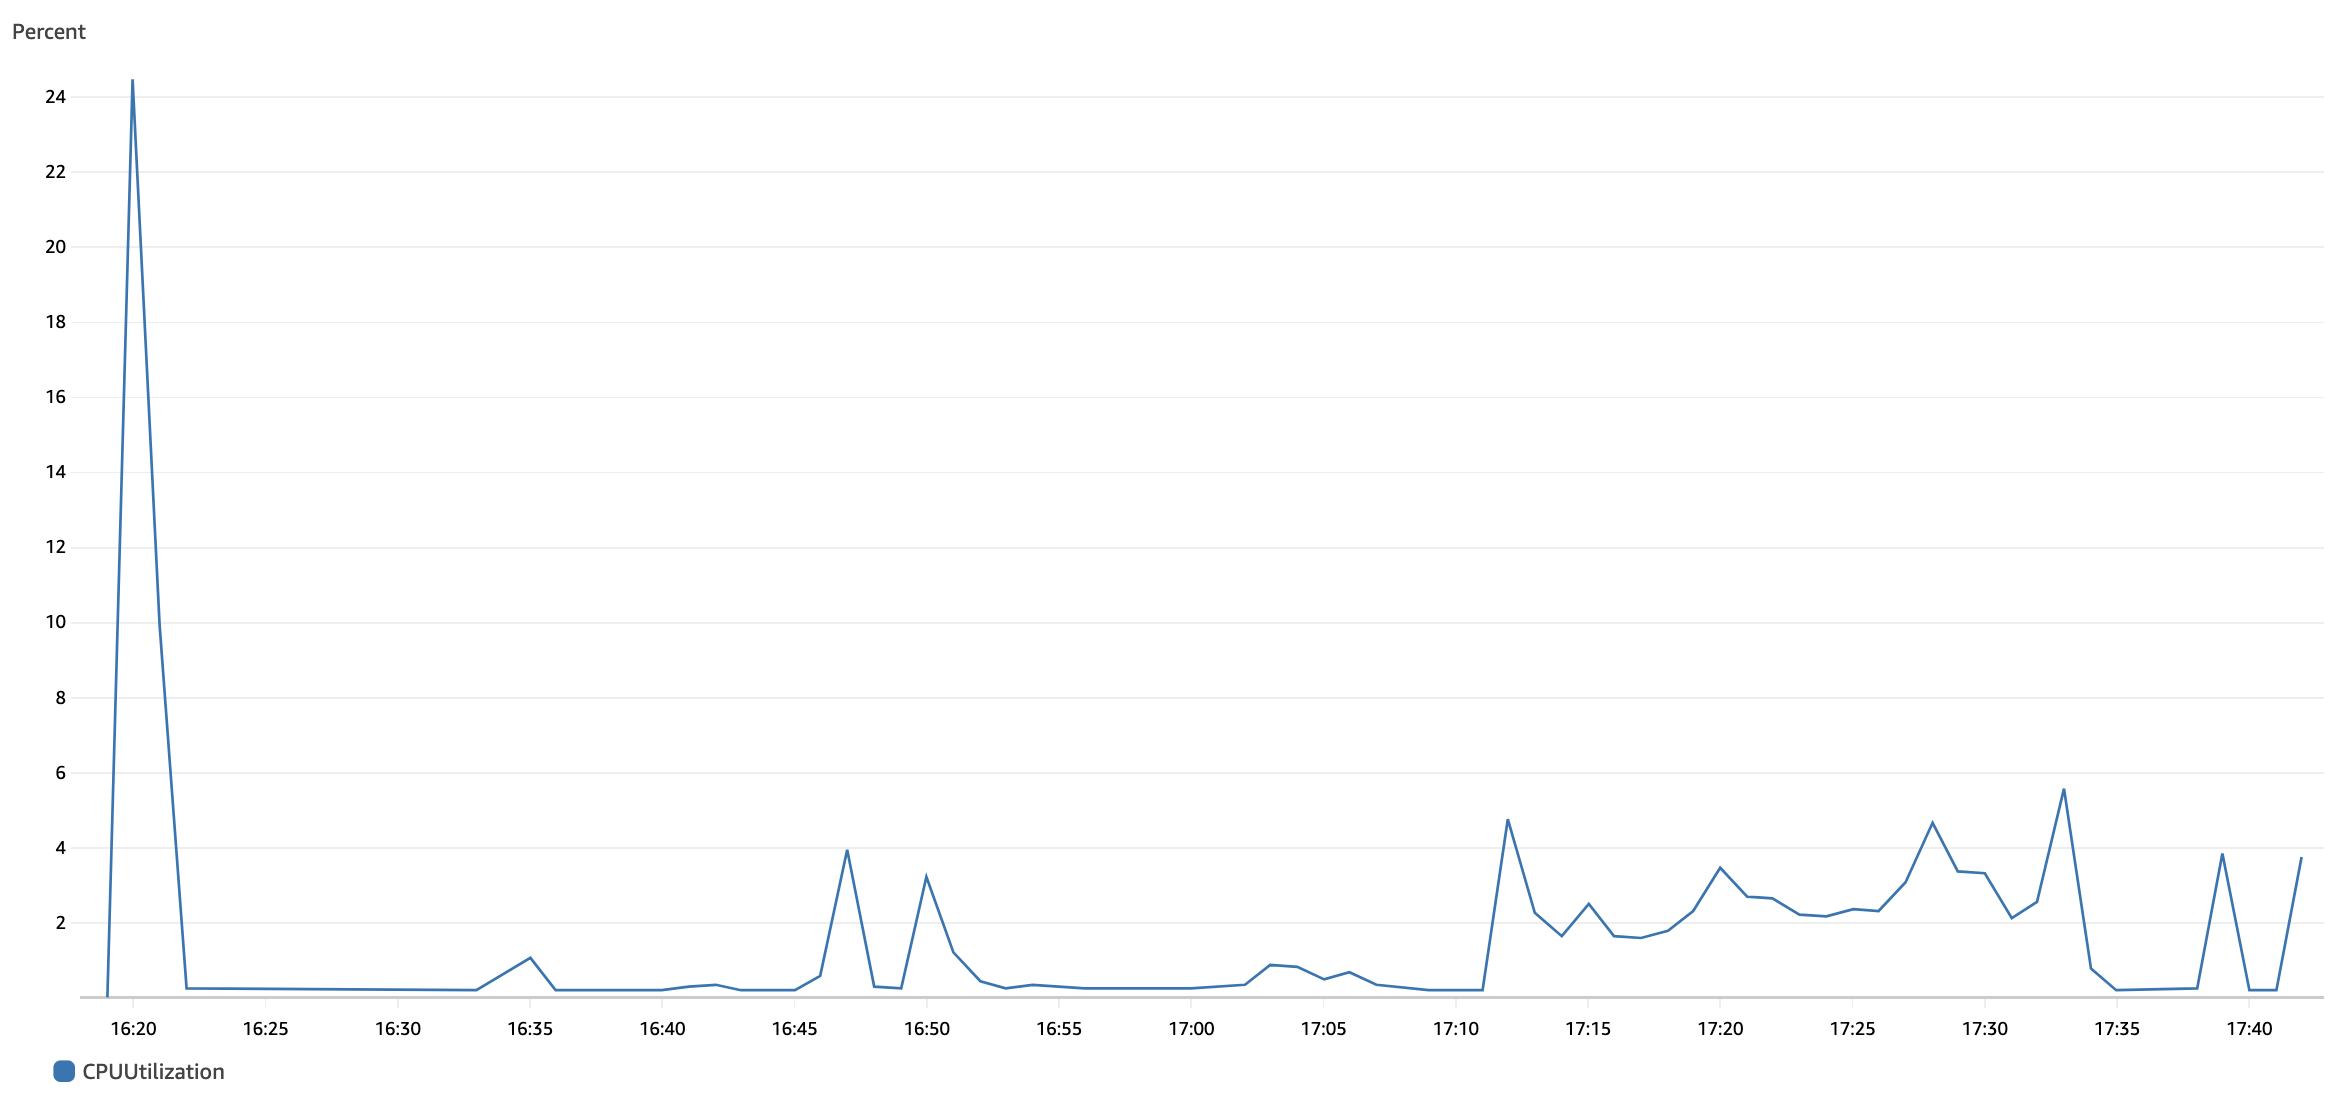
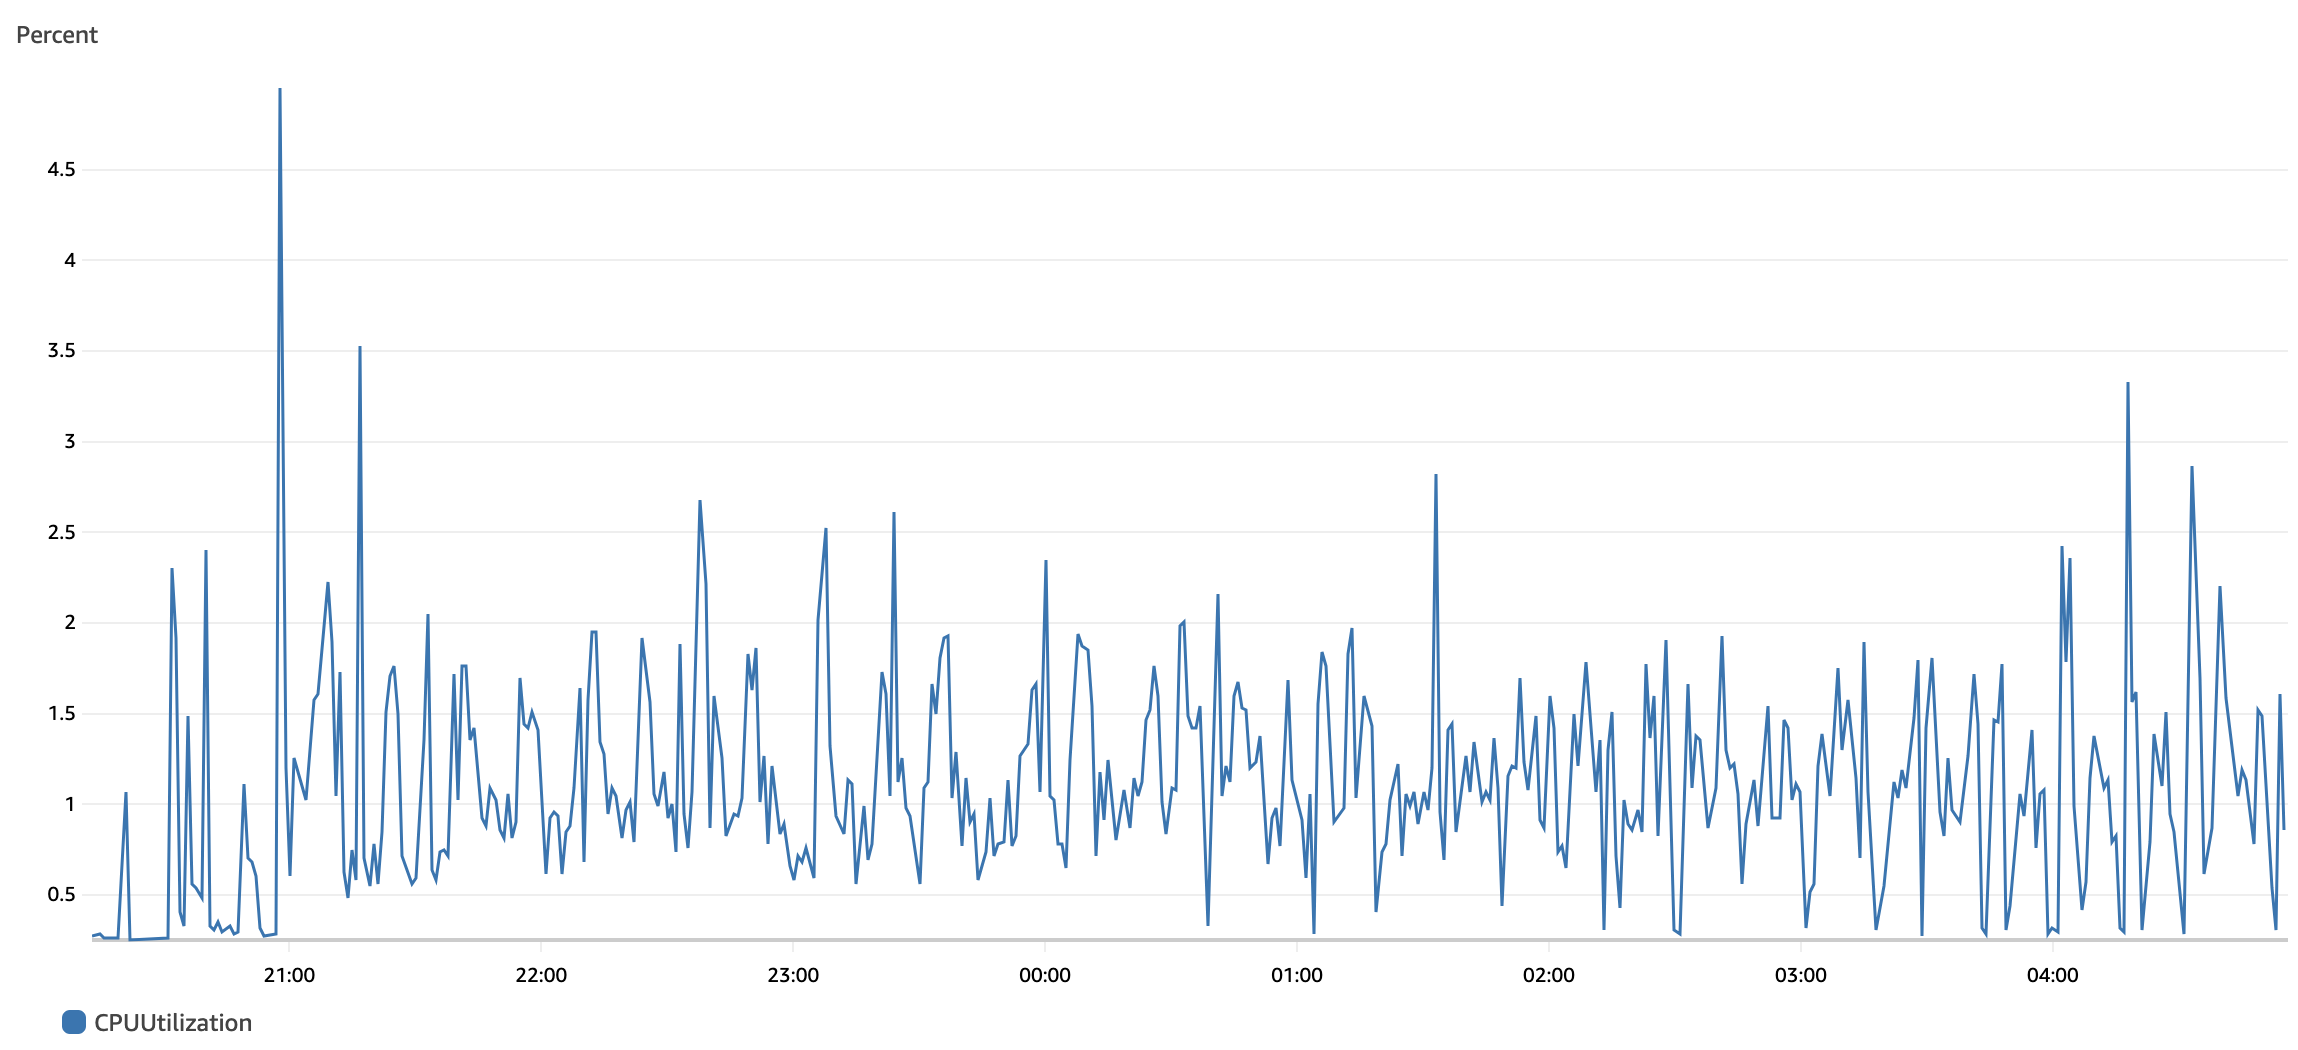
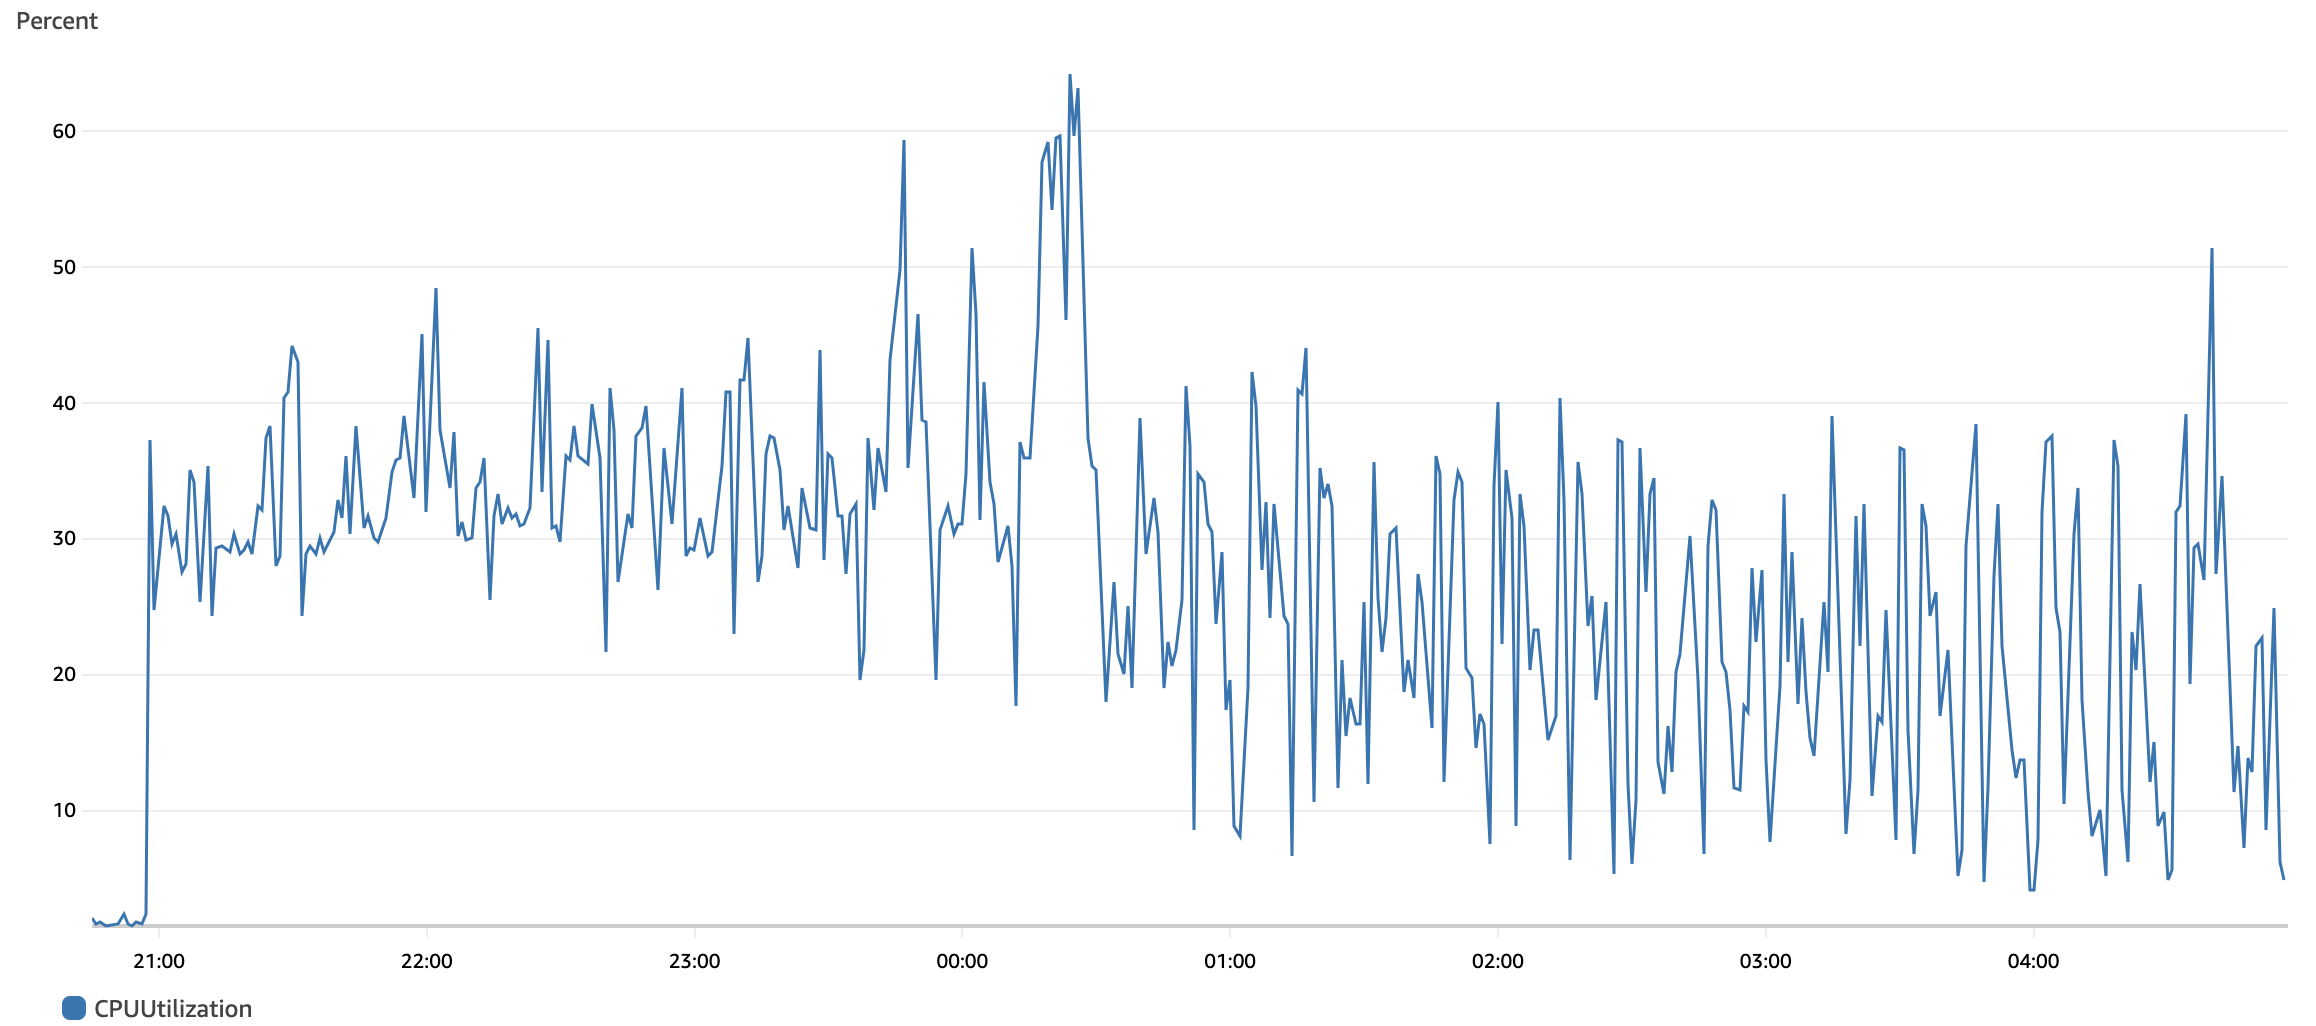
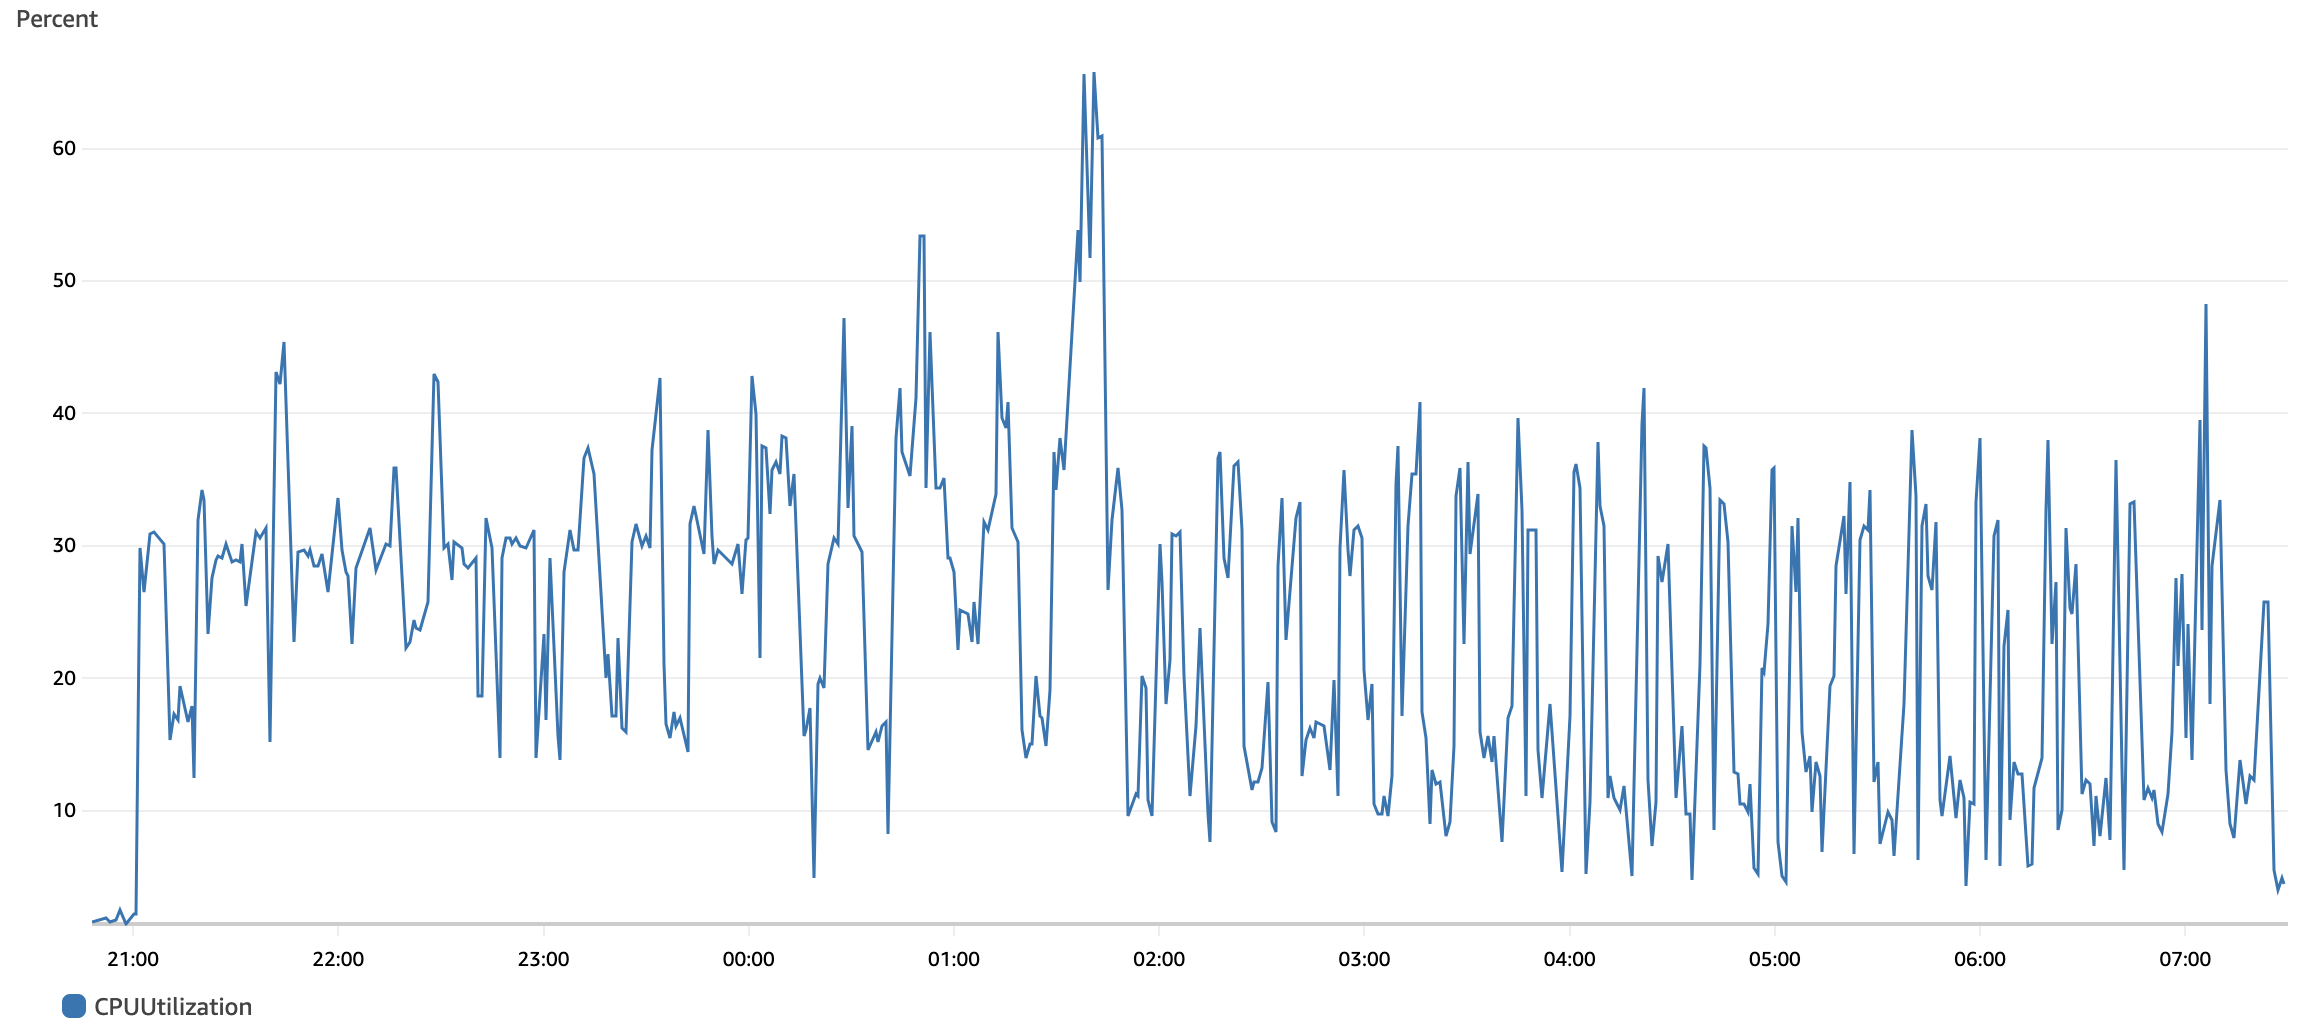
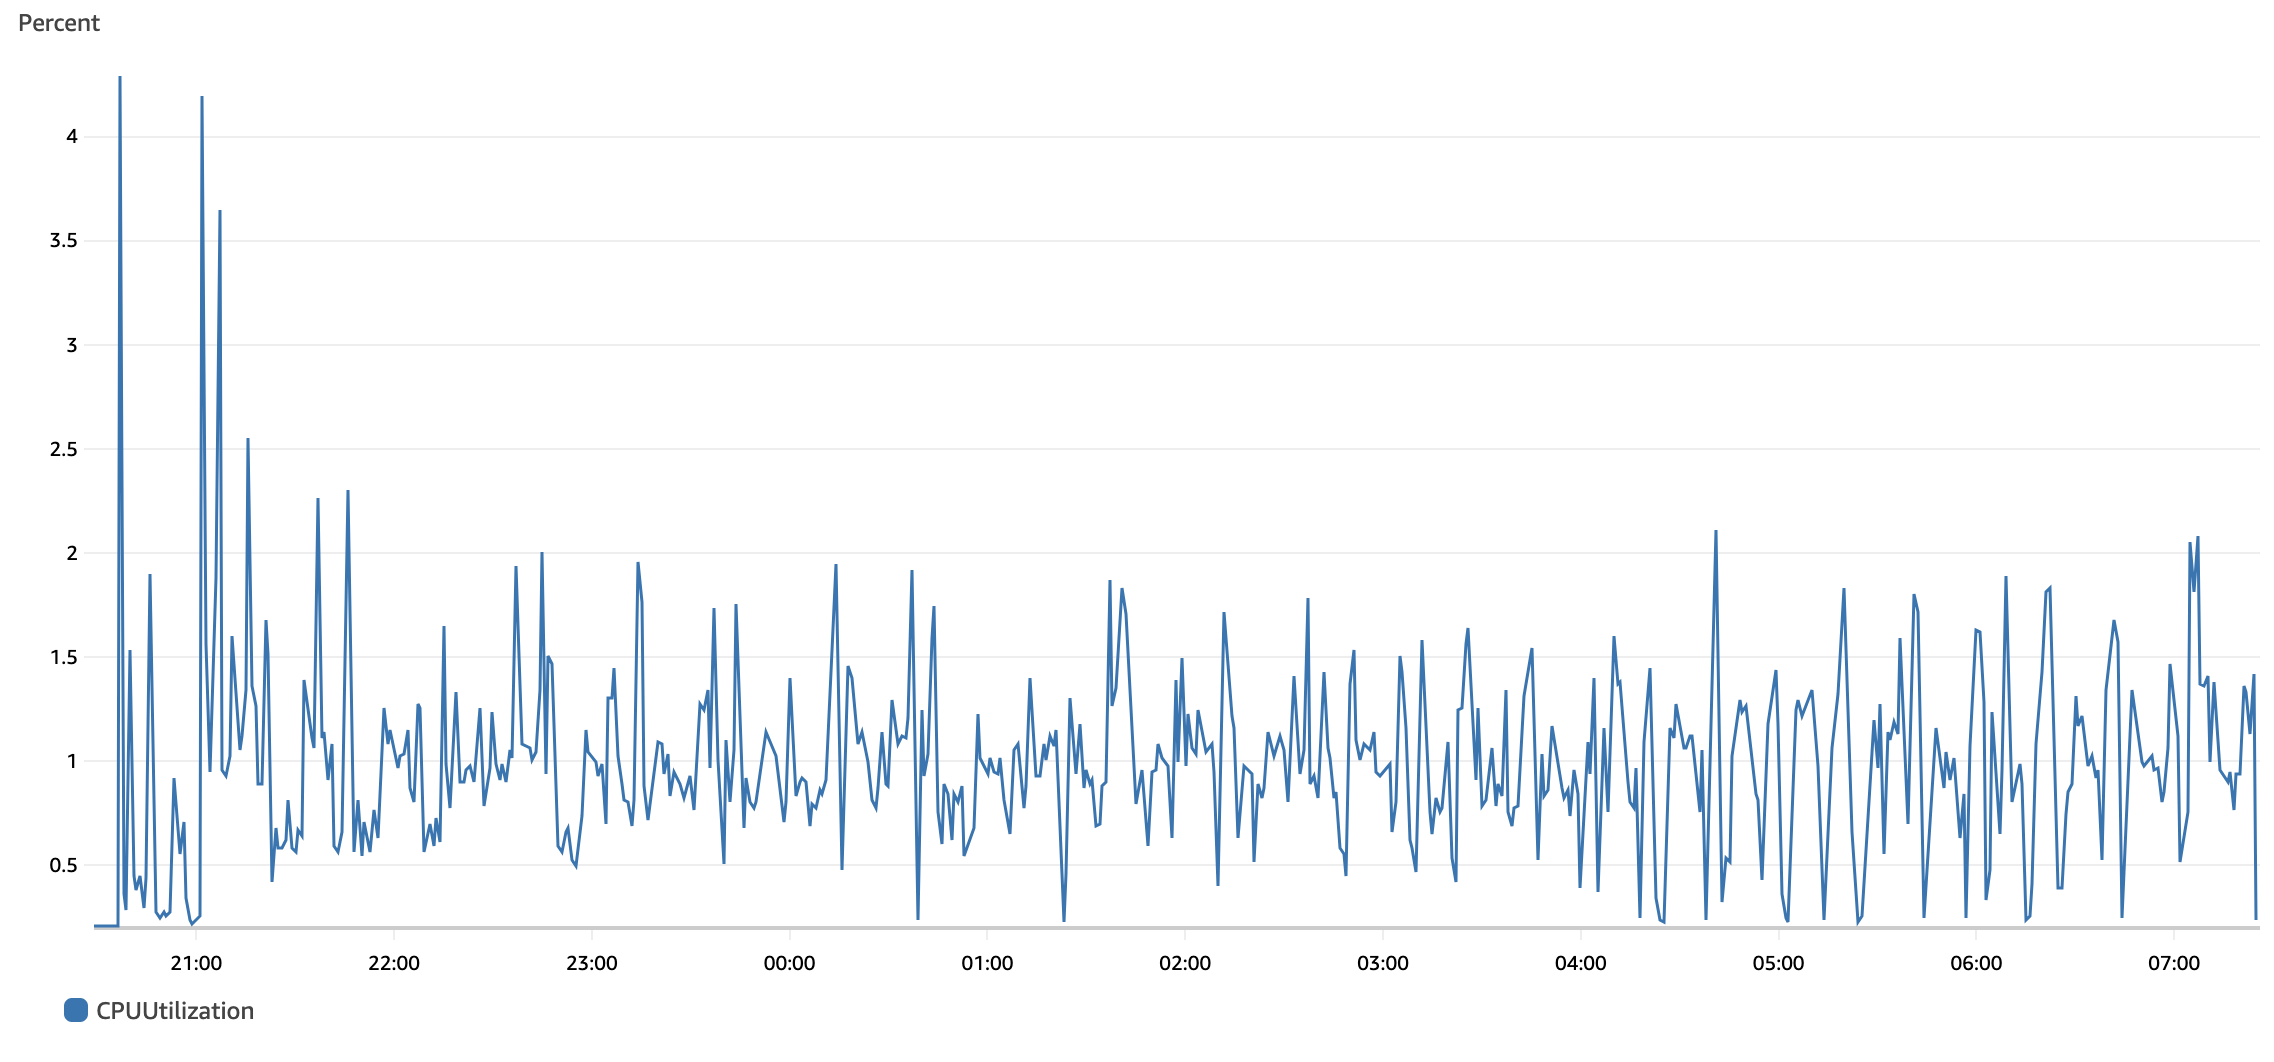
SQL-Based Cleanup
Select any of the chart images to view them in full size.
Test Execution | Elapsed Time | Avg. Time per component | CPU Avg. NXRM Node | CPU Avg. RDS | Observations | ||
|---|---|---|---|---|---|---|---|
1 | 7 hours, 57 minutes, and 12 seconds (28,632 seconds) | 8.7 ms |
|
|
| ||
2 | 10 hours, 23 minutes, and 37 seconds (37,417 seconds) | 11.4 ms |
|
|
| ||
3 | 10 hours, 22 minutes, and 35 seconds (37,355 seconds) | 11.4 ms |
|
|
| ||
4 | 10 hours, 7 minutes, and 27 seconds (36,447 seconds) | 11.1 ms |
|
|
|
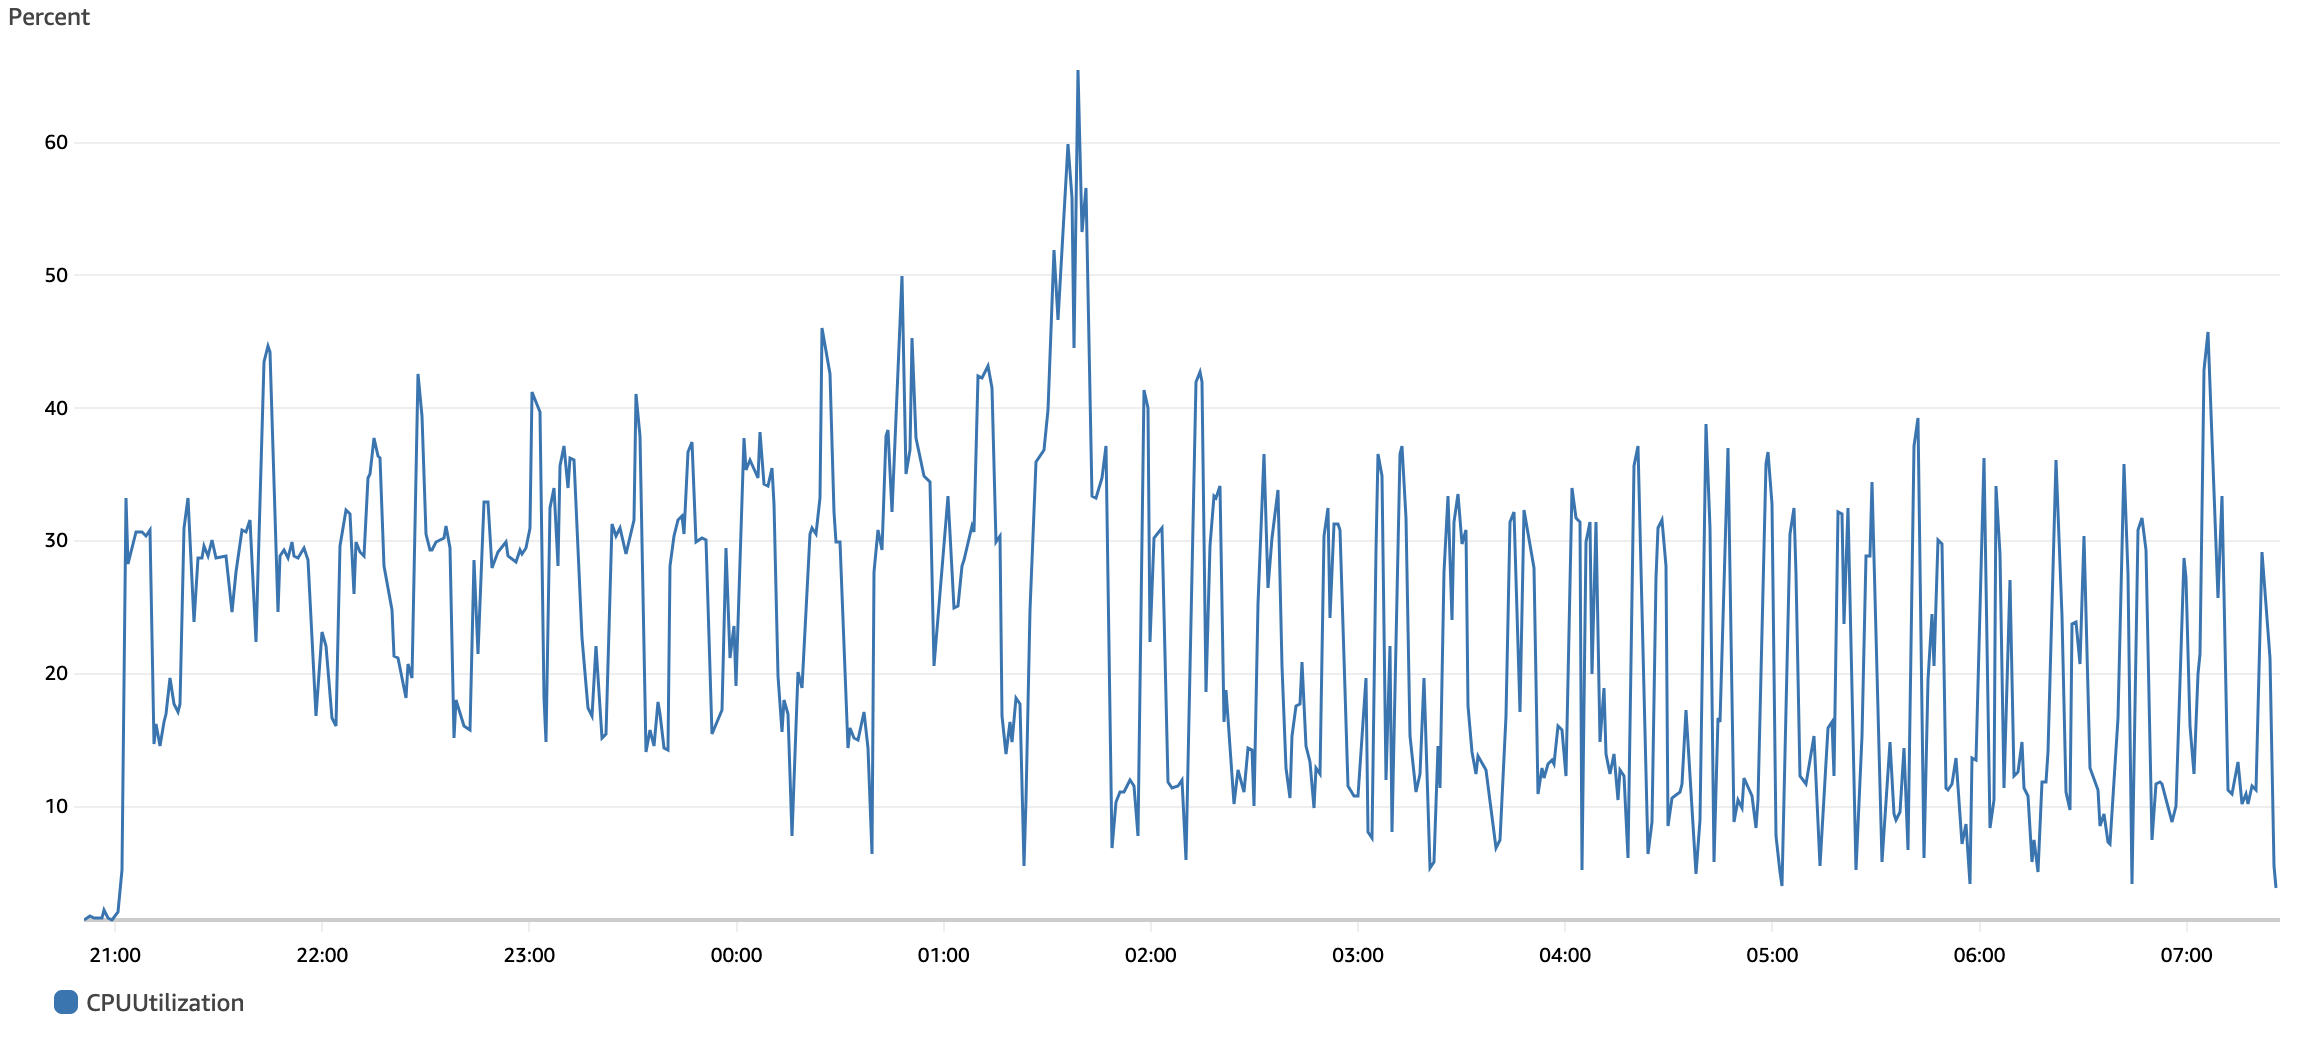
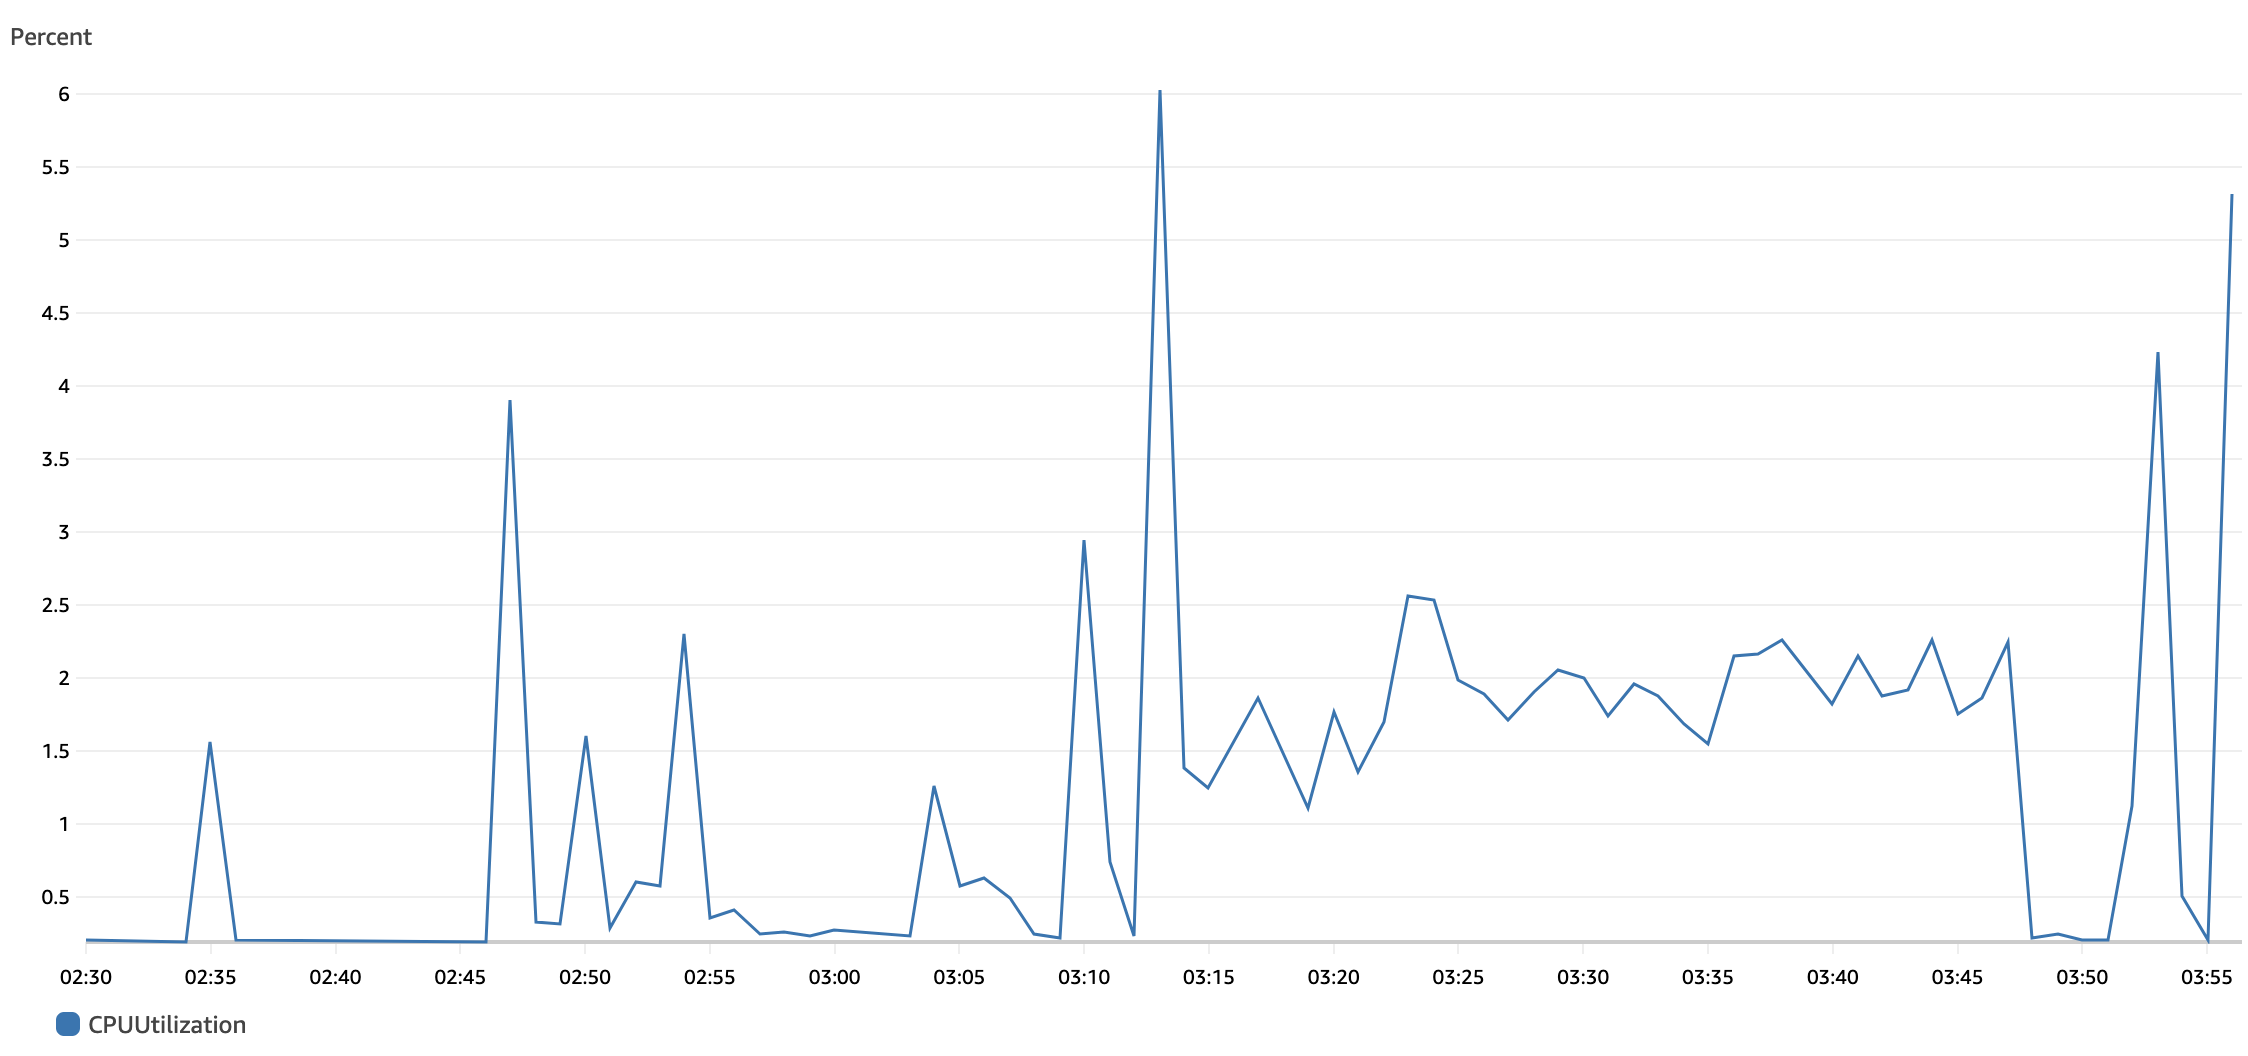
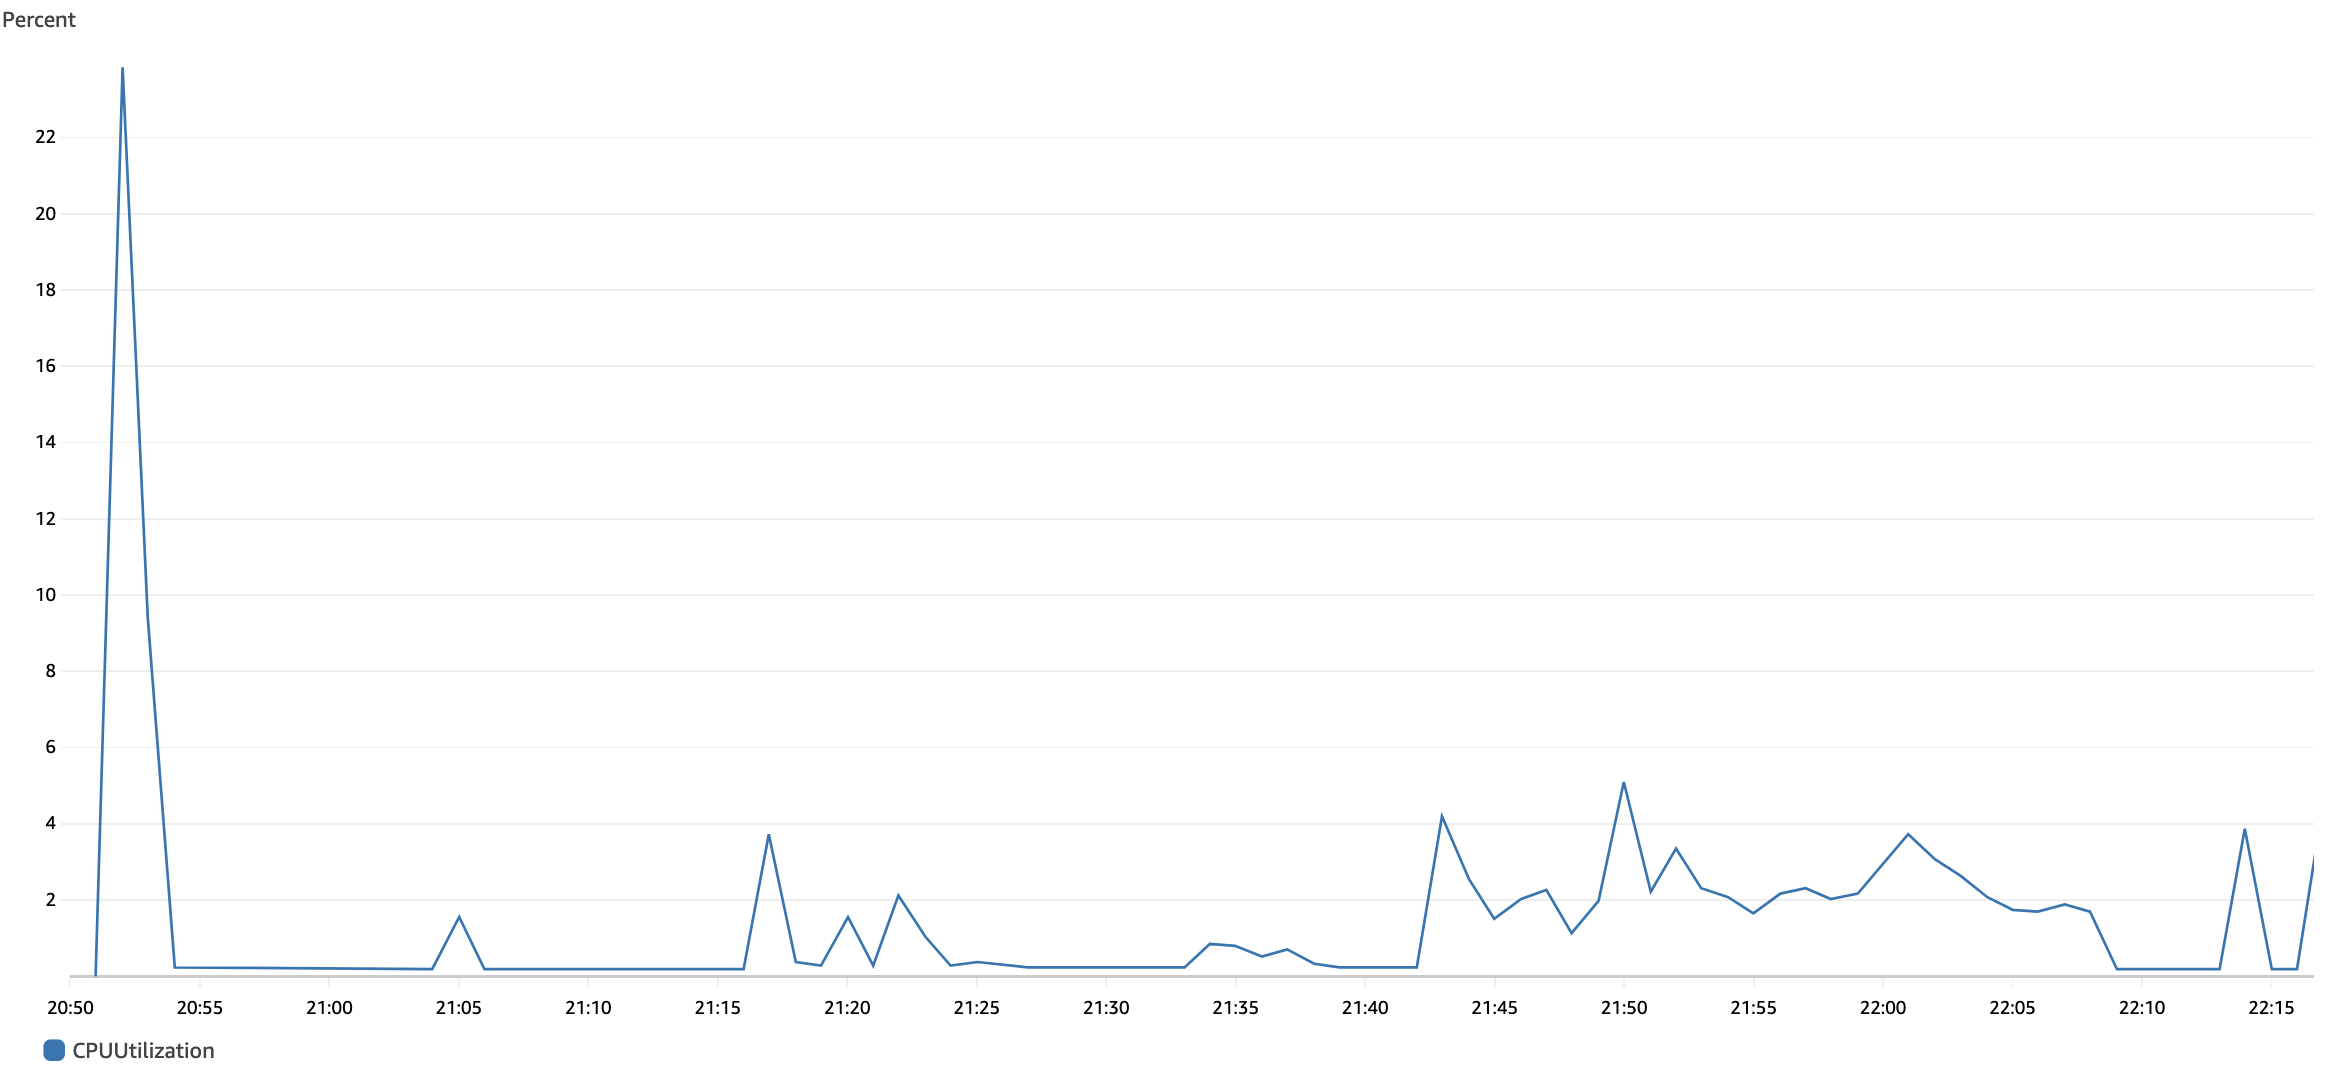
SQL-Based Cleanup with Retaining a Specified Version Range
Select the chart images to view them in full size.
Test Execution | Elapsed Time | Avg. Time per component | CPU Avg. NXRM Node | CPU Avg. RDS | Observations | ||
|---|---|---|---|---|---|---|---|
1 | 33 minutes, and 54 seconds (2,034 seconds) | 0.6 ms |
|
|
| ||
2 | 34 minutes, and 27 seconds (2,067 seconds) | 0.6 ms |
|
|
| ||
3 | 25 minutes, and 13 seconds (1,513) | 0.4 ms |
|
|
| ||
4 | 55 minutes, and 56 seconds (3,356 seconds) | 1.0 ms |
|
|
| ||
5 | 58 minutes, and 30 seconds (3,510 seconds) | 1.0 ms |
|
|
| ||
6 | 25 minutes, and 13 seconds (1,513 seconds) | 0.4 ms |
|
|
| ||
7 | 27 minutes, and 47 seconds (1,667 seconds) | 0.5 ms |
|
|
| ||
8 | 57 minutes, and 59 seconds (3,479 seconds) | 1.0 ms |
|
|
| ||
9 | 29 minutes, and 49 seconds (1,789 seconds) | 0.5 ms |
|
|
| ||
10 | 51 minutes, and 50 seconds (3,110 seconds) | 0.9 ms |
|
|
| ||
11 | 1 hours, 0 minutes, and 1 seconds (3,601 seconds) | 1.1 ms |
|
|
| ||
12 | 30 minutes, and 50 seconds (1,850 seconds) | 0.5 ms |
|
|
| ||
13 | 56 minutes, and 27 seconds (3,387 seconds) | 1.0 ms |
|
|
| ||
14 | 30 minutes, and 20 seconds (1,820 seconds) | 0.5 ms |
|
|
| ||
15 | 34 minutes, and 56 seconds (2,096 seconds) | 0.6 ms |
|
|
| ||
16 | 28 minutes, and 16 seconds (1,696 seconds) | 0.5 ms |
|
|
| ||
17 | 28 minutes, and 17 seconds (1,697 seconds) | 0.5 ms |
|
|
| ||
18 | 21 minutes, and 37 seconds (1,297 seconds) | 0.4 ms |
|
|
|