Legal Risk Trends
About the Data
Data Refresh Frequency: Updated daily at 1:00 pm UTC
Displays Data for: All open violations (regardless of the date they were opened) and resolved violations on or after January 1, 2024. For new installations, data will be visible within a week after the first scan.
To view historical data (generated before January 1, 2024) version 188 or higher is required.
Minimum Requirements: Applications must be scanned at least once, after upgrade to version 184. The dashboard currently shows data related to violations and remediations that are discovered after upgrade to version 184.
Overview
The Legal Risk Trends dashboard helps you keep a pulse on how your applications handle open-source legal risks over time. It draws on data gathered by Sonatype Lifecycle as it detects policy violations and tracks remediation activities at every stage of your development pipeline. By charting your team’s Fix Rate and Mean Time to Remediate (MTTR), you’ll quickly see whether you’re meeting your risk-management benchmarks, and where processes might need tightening.
With clear side-by-side views of violation counts and average remediation times, you can judge both the volume and severity of legal exposures in one glance. If your MTTR stays comfortably within your targets, you might choose to adjust Lifecycle policies from “Fail” to “Warn,” avoiding unnecessary release blockages while keeping risk under control.
Digging deeper into MTTR trends also uncovers which vulnerabilities are taking the longest to resolve, and which policy threat levels demand your immediate attention. Armed with that insight, you can fine-tune your remediation playbook and ensure your teams focus first on the highest-risk issues lurking in your open-source dependencies.
The Legal Risk Trends dashboard displays the following metrics:
Explore Your Legal Risk Trends Dashboard
Our dynamic dashboard lets you drill into your application’s legal risk profile with a rich set of filters. Narrow your view by date range, organization, application (and its category), policy threat level, development stage, violation type, security policy name, component type, remediation status, or waiver reason.
Violation Types
Legacy
Non-Legacy
Remediation Status
Fixed
Open
Waived
Waiver Reasons
Acknowledged violation
Mitigated externally
No upgrade path
Not reachable
Not exploitable
Researching
Other
Development Stages
Build (default)
Release
Stage-release
Compliance
Source
Use these controls to slice and dice your risk data, hone in on trouble spots, and track progress across your teams and projects.
The build stage is selected by default.

Note
If the values mentioned above are not displayed in the customer filter section, it means the customer does not have applications containing that information.
Example: If a customer says, “I don’t see the release stage in the filter,” it is because none of their scanned applications include release-stage data. The same logic applies to the other filters.
Cross-filtering is disabled. Users cannot click on any part of the dashboard to apply a filter.
Daily Open Violations - License Threat Group
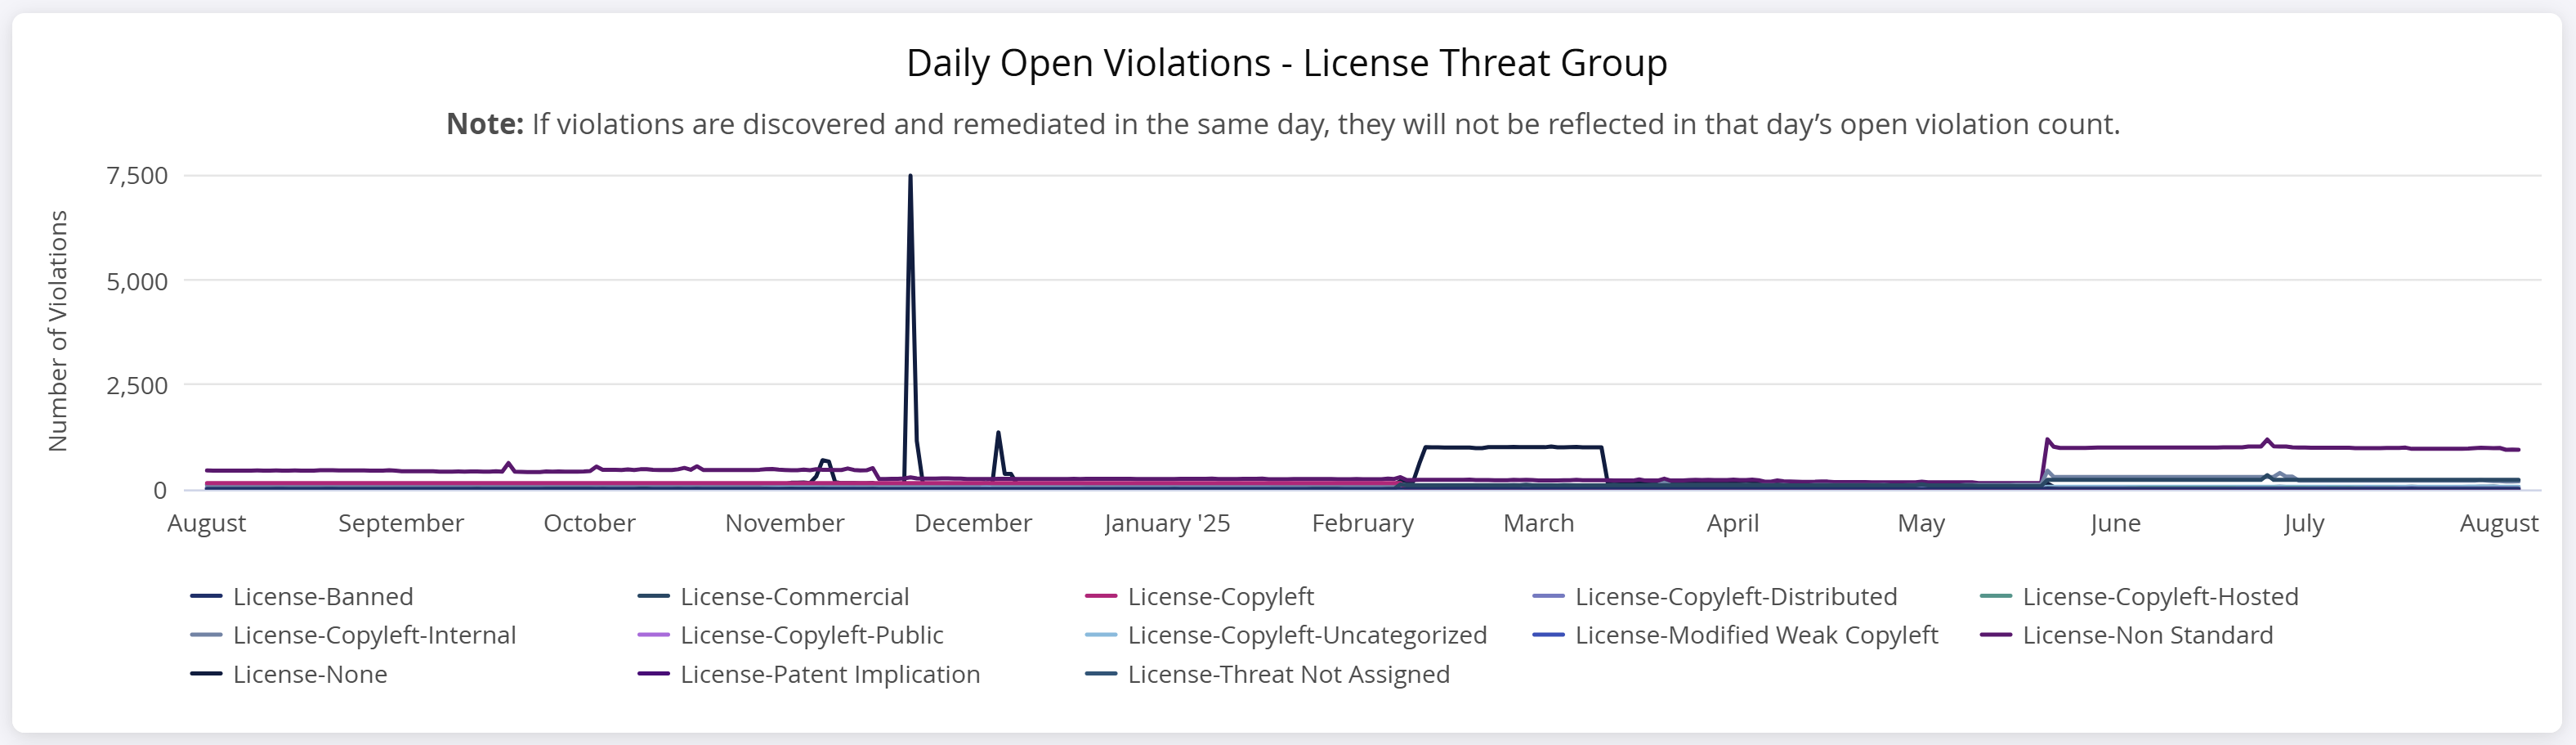
The Daily Open Violation - License Threat Group chart displays the number of violations that were open on each day, across all applications that match the selected filters.
Open violations are counted based on their status and duration of being open. If a violation is detected and remains unresolved, it continues to count as open for each day it remains unremediated.
This chart does not include violations that are both detected and remediated on the same day.
More Examples:
A violation that was opened on 30/11/2024 and has not been fixed or waived, will count as 1 open violation every day from 30/11/2024 until now.
A violation that was opened on 30/11/2023 and waived/remediated on 30/11/2024, will count as 1 open violation for each day between 30/11/2023 and 30/11/2024.
A violation that was opened and fixed/remediated on the same day (30/11/2023) will not appear in the chart.
A violation that was opened on 30/11/2023, waived on 30/12/2023, and fixed on 30/01/2024, will count as 1 open violation for each day between 30/11/2023 and 30/12/2023.
Daily Open Violation
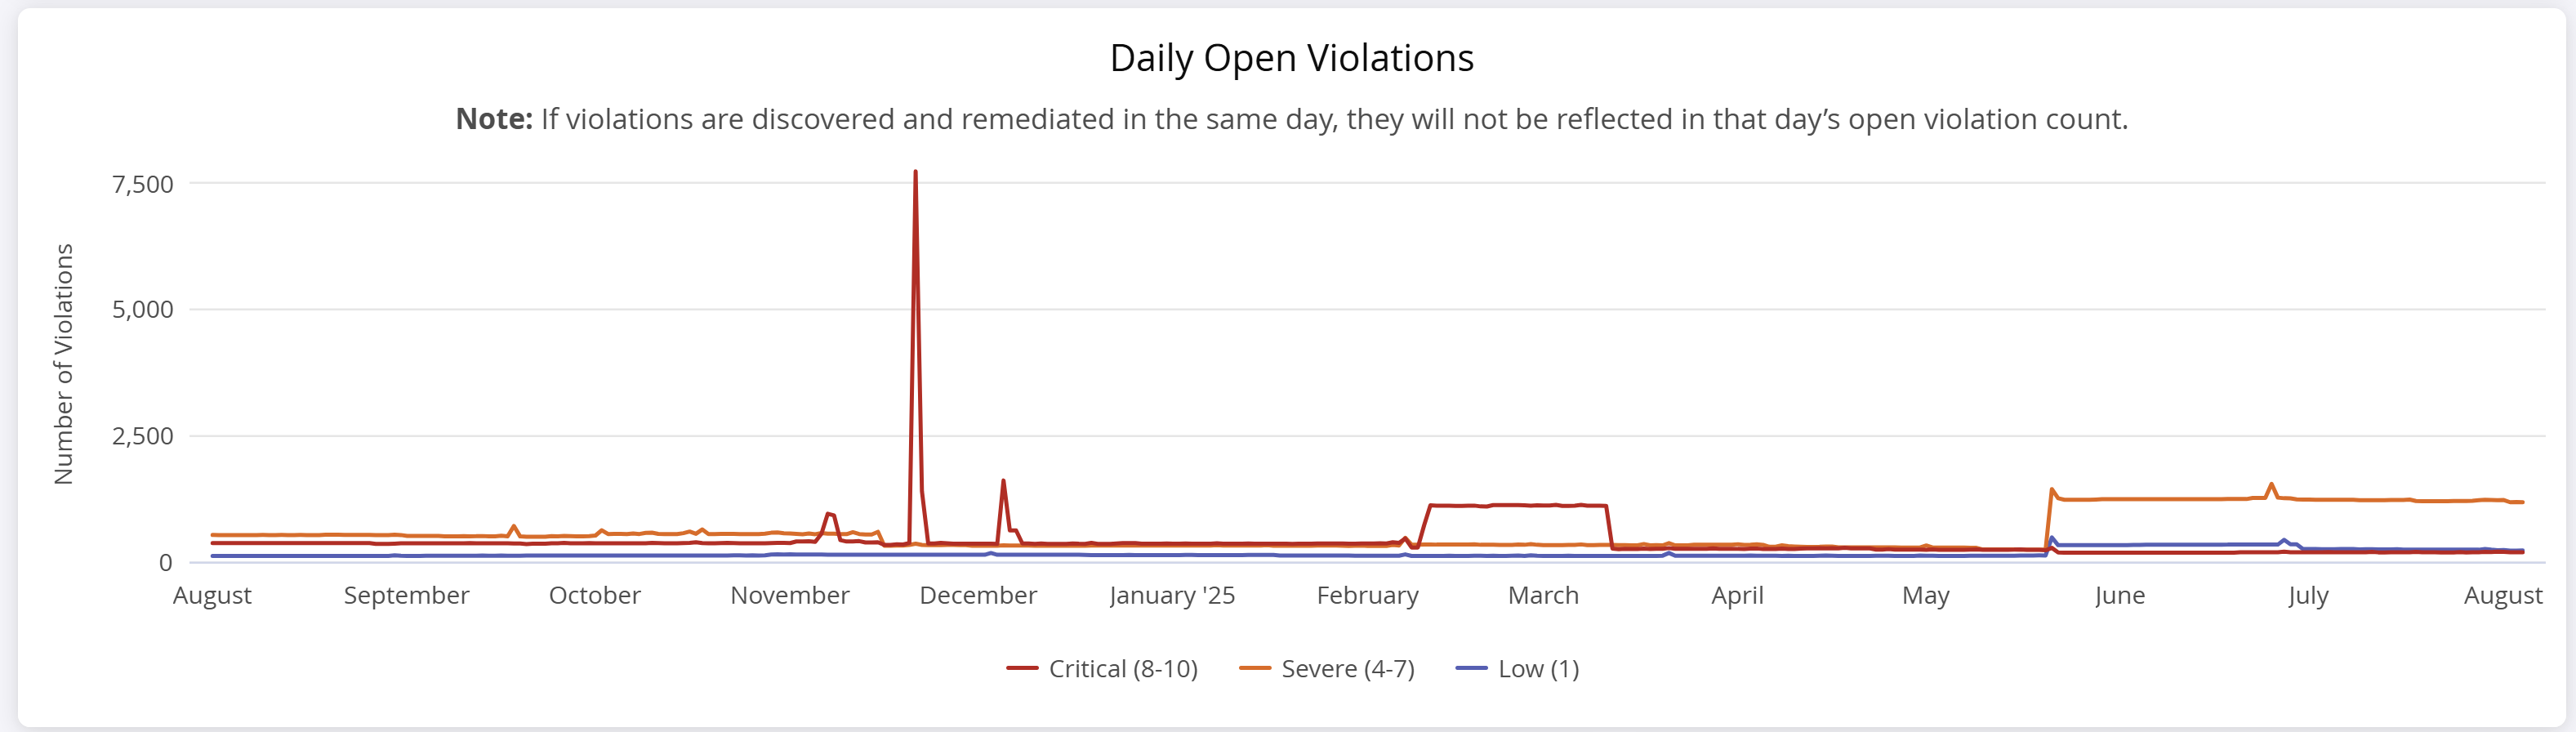
This chart displays how many legal violations remained open on each day. It helps track the volume and duration of unresolved violations over time. Violations fixed on the same day as they were identified are not included.
More Examples:
A violation that was opened on 30/11/2024 and has not been fixed or waived will count as 1 open violation per day from 30/11/2024 until today.
A violation that was opened on 30/11/2023 and waived/remediated on 30/11/2024 will count as 1 open violation per day between those dates.
A violation that was opened and remediated on the same day (30/11/2023) will not appear in the chart.
A violation that was opened on 30/11/2023, waived on 30/12/2023, and fixed on 30/01/2024 will count as 1 open violation per day between 30/11/2023 and 30/12/2023.
Waived Legal Violations
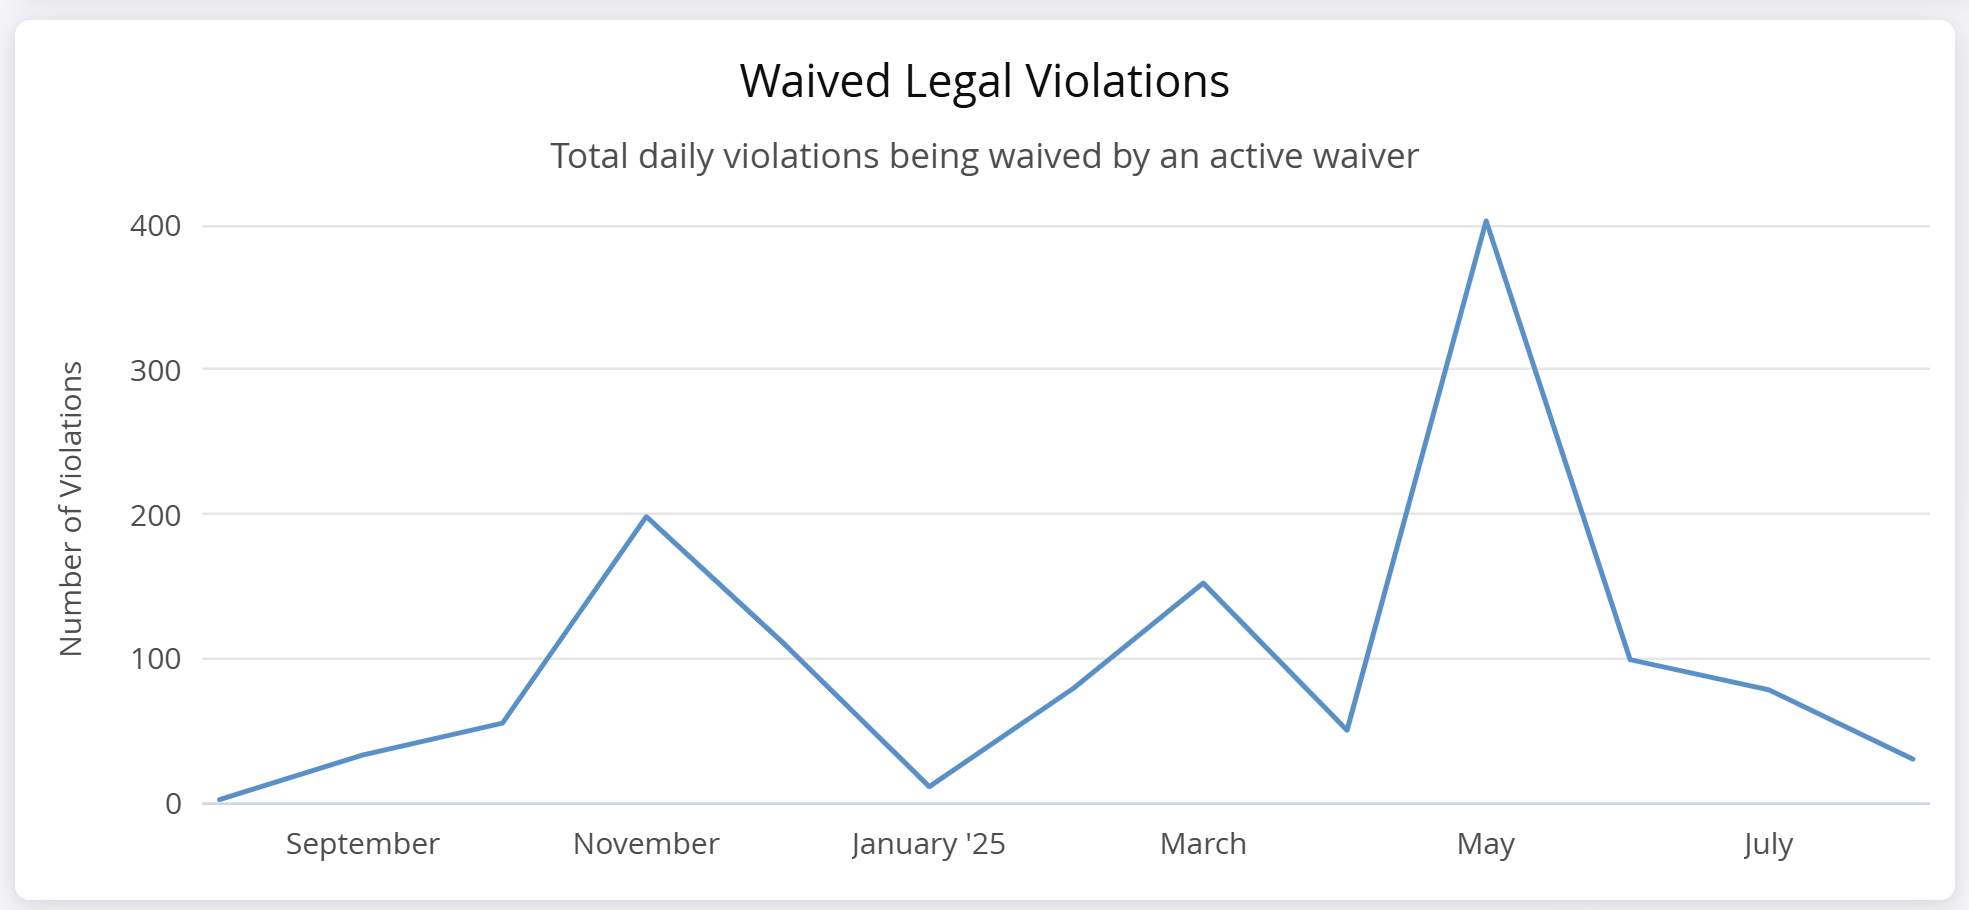
Displays the number of violations that were waived each month. It includes all waivers, regardless of whether the violation was later fixed or unwaived and is grouped by waiver reason.
If a violation was waived in July with reason Other, the chart will count +1 in July under that waiver reason.
X-axis: Waived date.
Legal Waiver Requests Submitted
This chart displays the number of license policy waiver requests submitted within the selected date range. This metric focuses only on license policy waiver requests.
Legal Violations Over Time
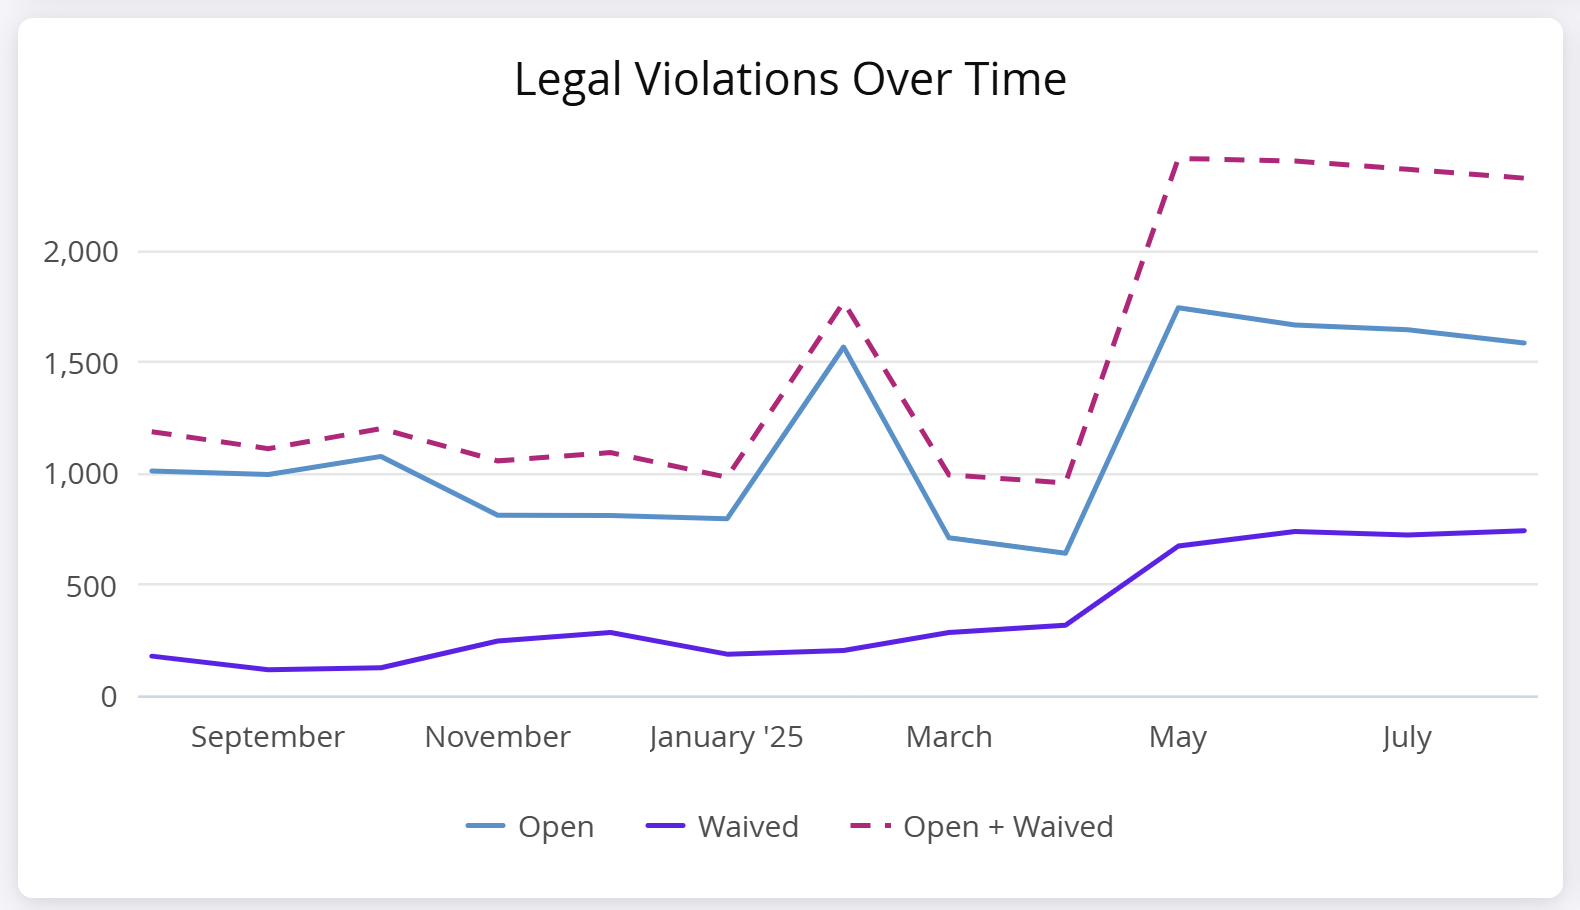
This chart displays month-end snapshots of both open and waived violations. It provides a high-level view of trends in unresolved and waived issues without daily breakdowns.
This chart includes three lines:
Blue Line – Open Violations: Shows the total number of open violations (not split by threat level) on the last day of each month.
Purple Line – Waived Violations: Shows violations that were in a waived state on the last day of each month.
Examples:If a violation was waived on Jan 20, 2024, and the waiver expired on Feb 20, 2024, it will appear as 1 waived violation in January (based on Jan 31 snapshot).
If it was waived on Jan 20, 2024, and fixed on Feb 20, 2024, it will still appear in January.
If the waiver is still active, it will be shown in each monthly snapshot.
Pink Dashed Line – Open and Waived Violations: Represents the sum of open and waived violations.
Note
The chart uses month-end snapshots. Filtering by a mid-month range (e.g., Jan 1–15) will not display data since January's snapshot is taken on Jan 31.
Monthly Legal Violation Activity
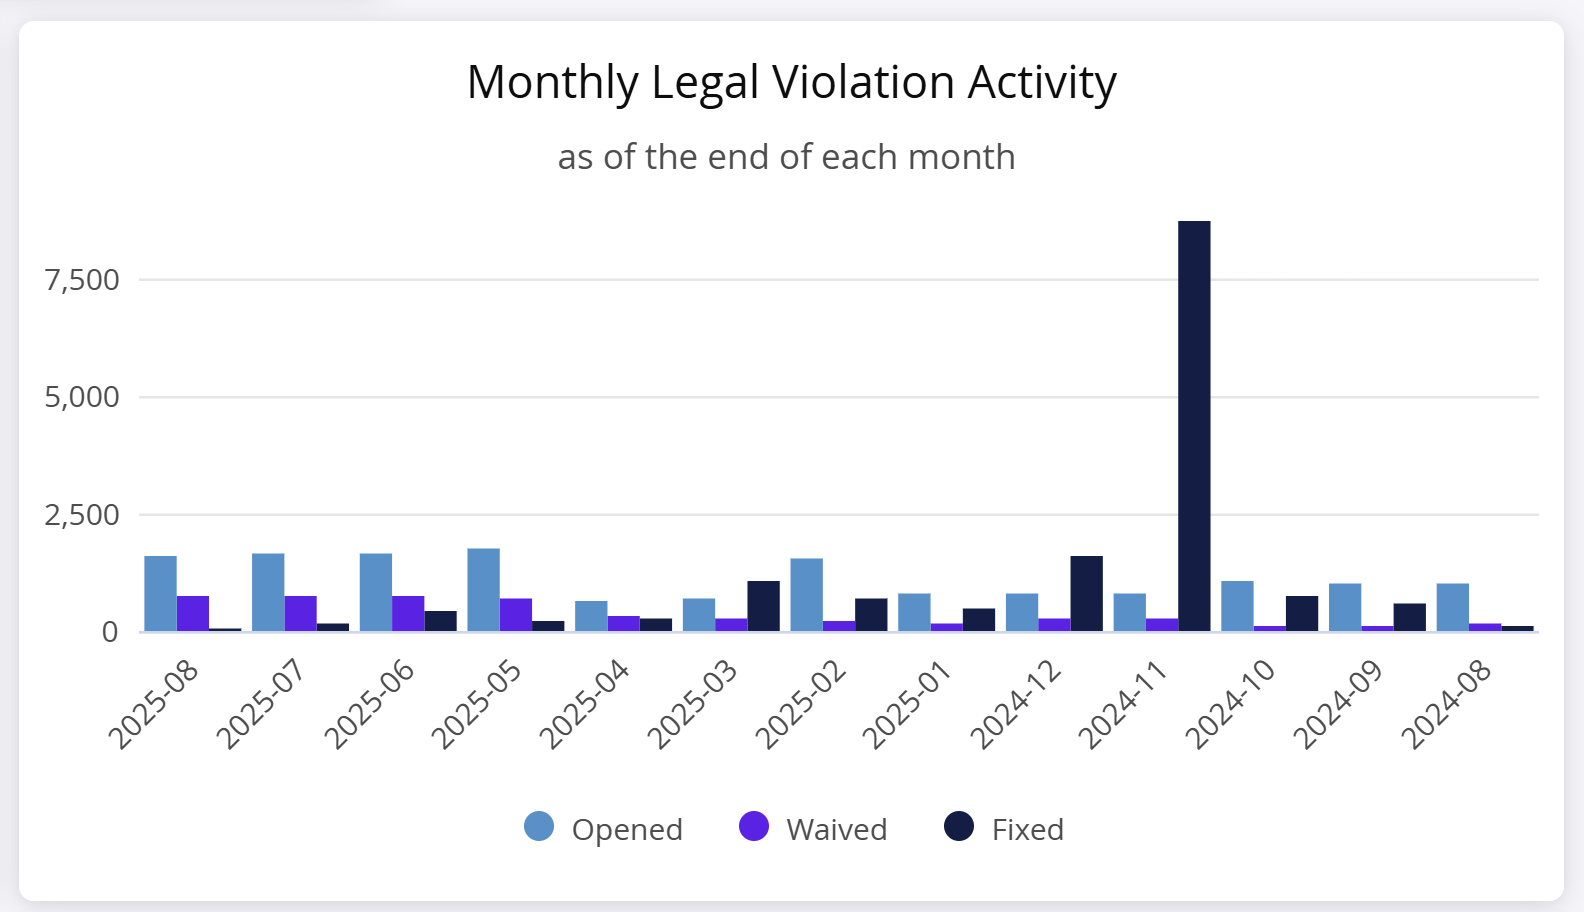
Summarizes violation activity on a monthly basis, showing how many were open, waived, or fixed by the end of each month. This is useful for understanding overall resolution trends.
This chart breaks down violation status by month:
Opened: Number of violations that were still open on the last day of each month.
Waived: Number of violations in a waived state on the last day of each month.
Fixed: Total number of violations that were resolved (fixed) within the month. For example, if 10 violations were fixed in January 2025, the chart will show “10” for January.
Mean Time to Triage
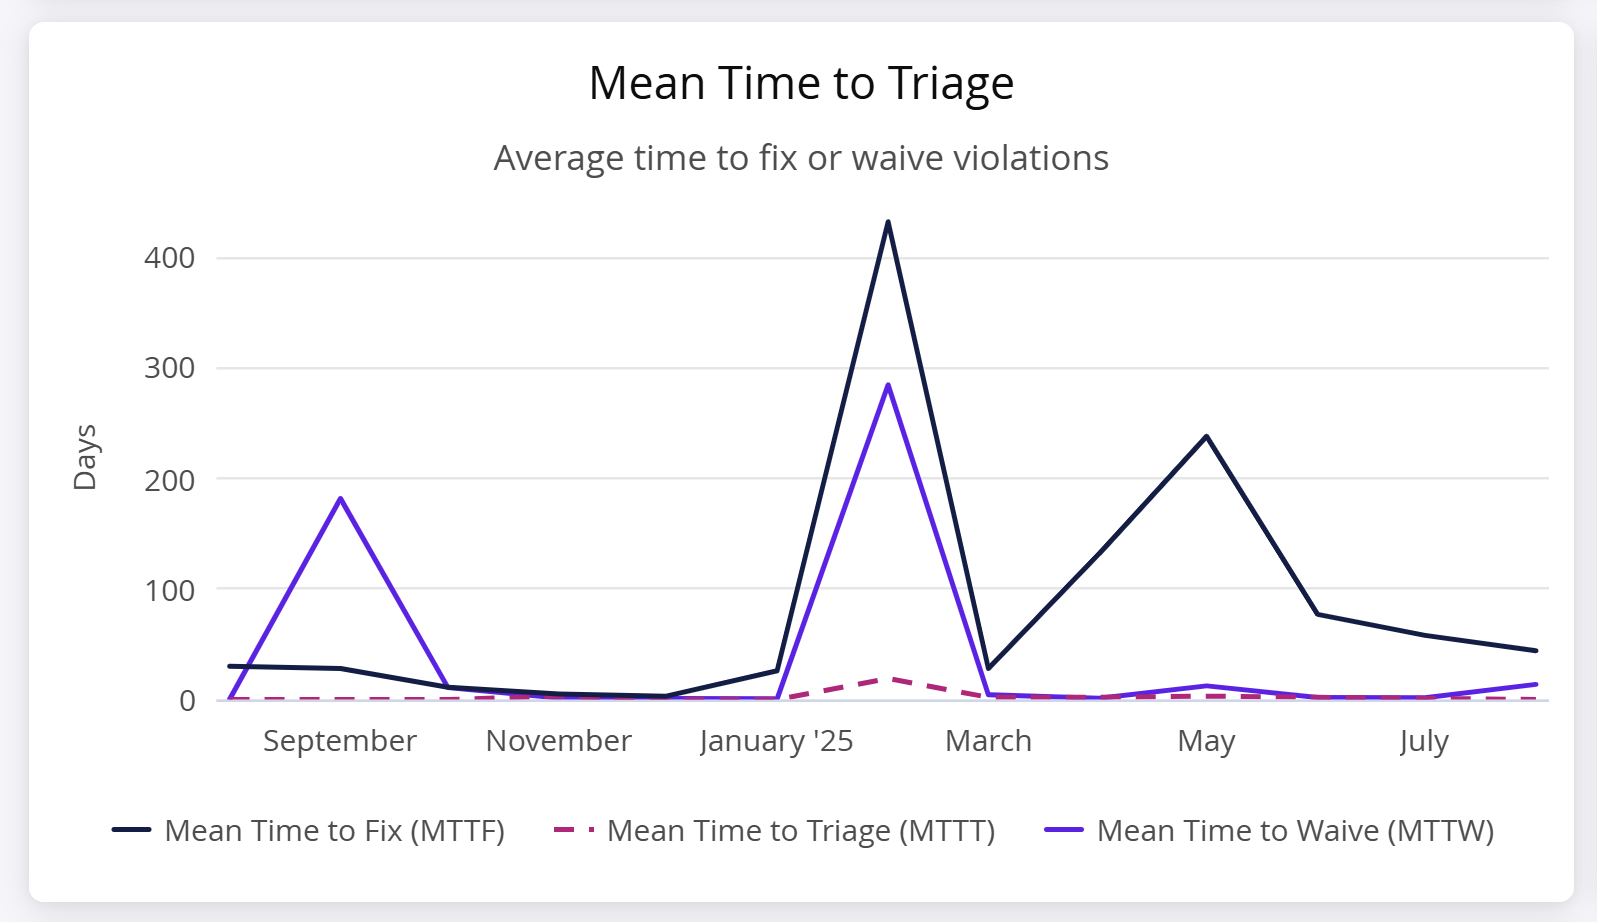
Displays how long it takes on average to waive, fix, or triage a violation. Helps assess response efficiency and track improvement over time based on waived/fixed timelines.
This chart displays the following key metrics to measure response speed:
MTTF (Mean Time to Fix)
Formula: Time to fix / Number of fixed violations.
Measures how many days it took to fix violations.
Example: 3 violations fixed in July.If 3 violations were fixed in July, and they took 3, 5, and 7 days to fix, the average time (MTTF) would be 5 days.
X-axis: Fix date.
MTTT (Mean Time to Triage)
Formula: Time to triage / Number of triaged violations.
Measures how long it took to either waive or fix a violation or whichever came first.
Example: 3 violations triaged in March.If three violations were opened on March 1. One was waived on March 10th and fixed later (9 days), another was fixed on March 15th without being waived (14 days), and the third was waived on March 15th but not yet fixed (14 days), the Mean Time to Triage (MTTT) would be calculated as (9 + 14 + 14) ÷ 3 = 12 days.
X-axis: First action date (waive or fix).
Triage Rate
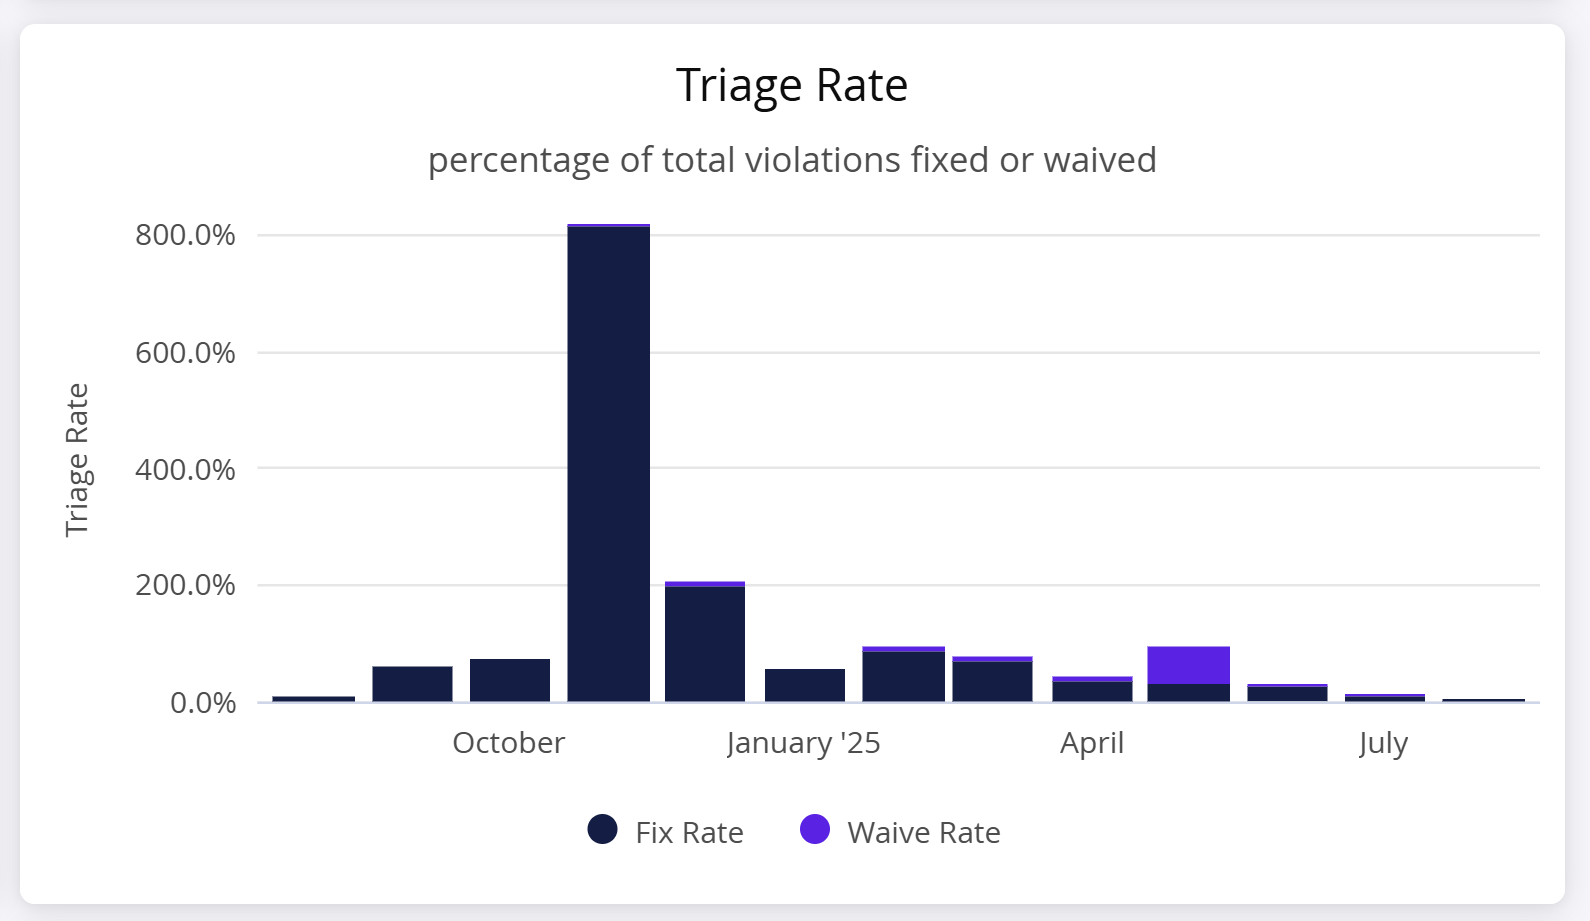
This chart displays the proportion of open violations that were waived or fixed during each month. This rate helps measure how effectively teams are resolving issues within a given period.
Active Legal Waivers Per Month
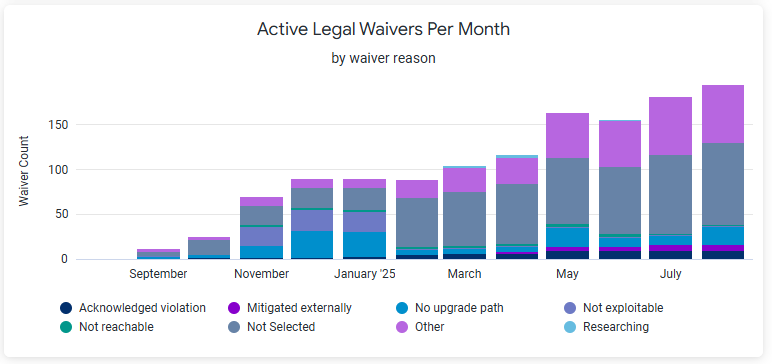
Provides a month-end snapshot of active legal waivers, grouped by waiver reason. Helps understand which types of waivers are currently in effect.
This chart shows active waivers at the end of each month (monthly snapshot).
For the current month, it uses data as of yesterday.
Breakdown is by waiver reason.
Percentages represent the proportion of active waivers (not violations) per reason.
Note
Customer needs to be on IQ version 189 or later to observe any related data, because this new feature for policy waiver selection type was delivered in version 189.
Total Legal Violations Waived Per Month
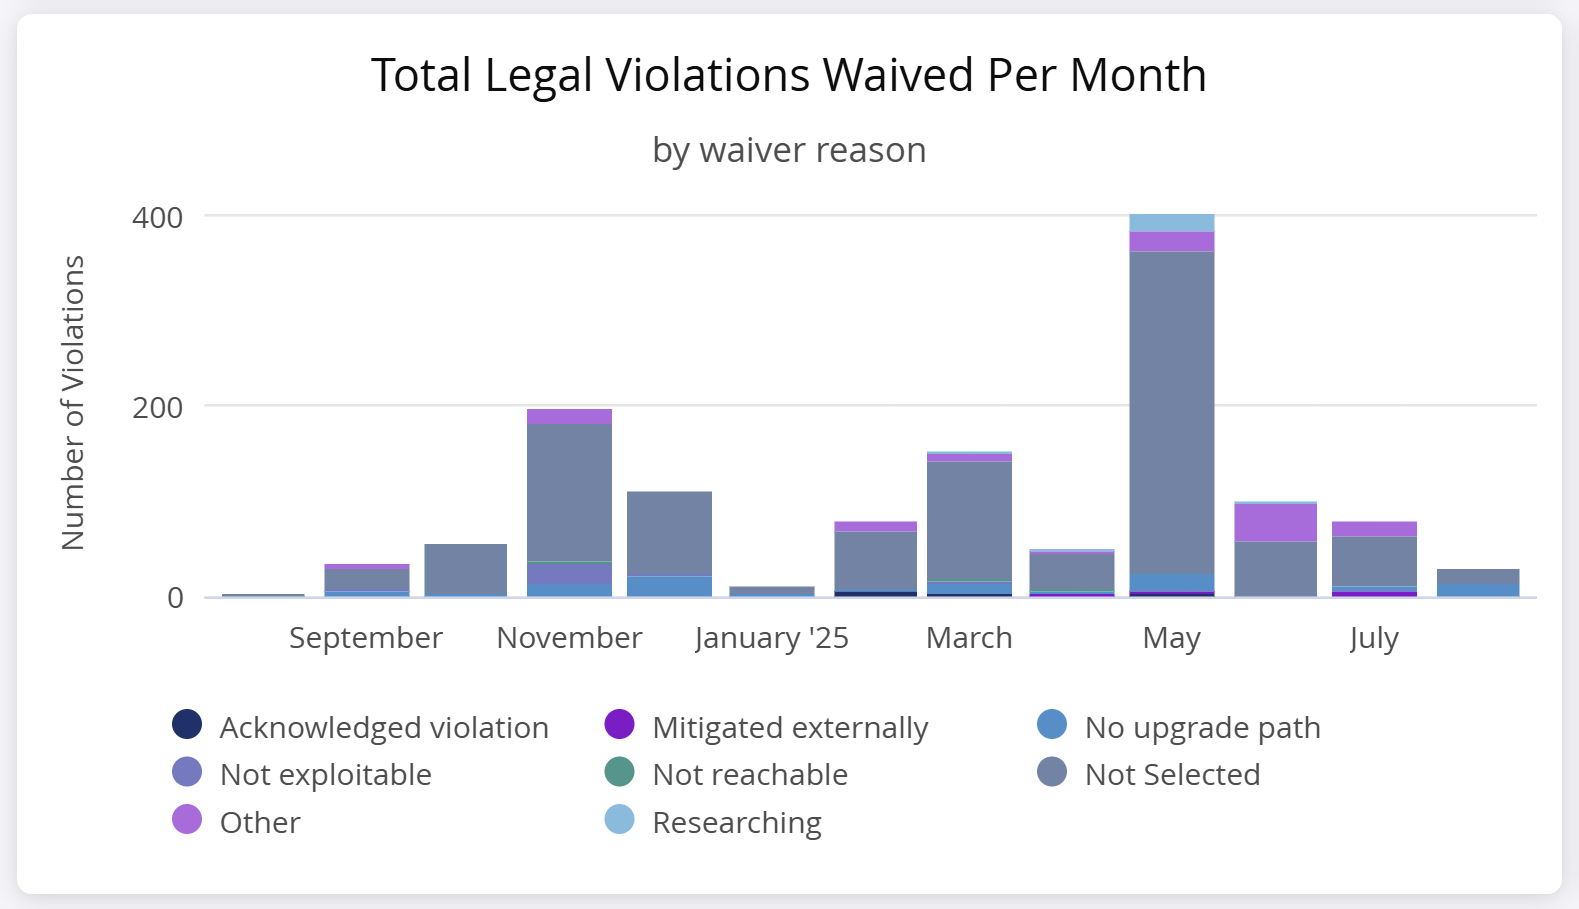
Tracks the number of violations waived each month, categorized by waiver reason. This chart highlights which waiver types are used most frequently over time.
This chart displays the number of violations waived each month, grouped by waiver reason.
A violation waived in July with reason Other will count +1 in July only under that waiver reason.
X-axis: Waived date.
Note
Customer needs to be on IQ version 189 or later to observe any related data, because this new feature for policy waiver selection type was delivered in version 189.