Golden Fixes Dashboard
About the Data
Data Refresh Frequency: Open violation data is updated daily at 1:00 pm UTC. Golden version suggestions are updated weekly.
Displays Data for: All open violations (regardless of the date they were opened) and resolved violations on or after January 1, 2024. For new installations, data will be visible within a week after the first scan.
To view historical data (generated before January 1, 2024) version 188 or higher is required.
Minimum Requirements: Applications must be scanned at least once, after upgrade to version 184. The dashboard currently shows data related to violations and remediations that are discovered after upgrade to version 184.
Overview
The Golden Fixes Dashboard helps you discover the potential impact of adopting golden fixes across your organization. Golden Fixes are validated, policy-aligned pull requests that automatically remediate open violations. This dashboard highlights how many violations could be resolved with Golden Fixes and helps you identify where they can have the greatest impact across your organization.
By providing clear visibility into security improvements that can be achieved with minimal effort, the dashboard enables you to view how many open policy violations could be remediated through golden pull requests. This gives executives, security teams, and development teams actionable insights into low-effort fixes that can significantly improve their security posture.
Use filters like date range, application, threat level, component type, component name and more to focus your view and identify the most impactful opportunities for remediation.
About Golden Fixes
Golden Fixes are validated component versions that resolve security violations without introducing breaking changes. When a component has a golden version available, you will receive the best recommended option to upgrade, which can eliminate vulnerabilities while maintaining application functionality. These fixes are automatically identified by analyzing component direct dependencies and suggesting safe upgrade paths that have been verified as policy-compliant.
Explore Your Golden Fixes Dashboard
Our dynamic dashboard lets you drill into your application’s golden fixes profile with a rich set of filters. Narrow your view by date range, organization, application (and its category), policy threat level, policy name, development stage, component type, vulnerability and component name.
Date Range: Defaults to last 12 months. Adjustable to any custom period.
Organization: Select one or more customer organizations.
Application: Choose specific applications or all.
App Category: Filter by business unit or project type.
Policy Threat Level:
Critical
Severe
Moderate
Low.
Component Type: Ecosystem filters (Maven, npm, NuGet, etc.).
Development Stages
Build (default)
Compliance
Operate
Proxy
Release
Source
Stage-release
Component Name: Filter results by specific component name to quickly locate relevant upgrade recommendations.
Use these controls to slice and dice your risk data, hone in on trouble spots, and track progress across your teams and projects.
The build stage is selected by default.

Total Open Violations

This metric displays the total count of open (non-waived) security violations across all applications within your selected filters. This represents your baseline security exposure before applying any golden fixes.
Violations with Golden Fixes Available
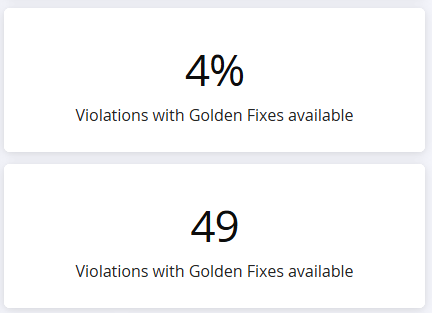
This section shows both the count and percentage of open violations that can be resolved using golden fixes. This metric helps you understand what portion of your current security exposure can be addressed through low-effort remediation.
The percentage calculation removes the "A" from the display to show: "Violations with Golden Fixes Available" rather than "Violations with A Golden Fixes Available."
This gives you immediate insight into the potential impact of implementing a golden fixes strategy across your organization.
Violations with Golden Fixes Available by Threat Level
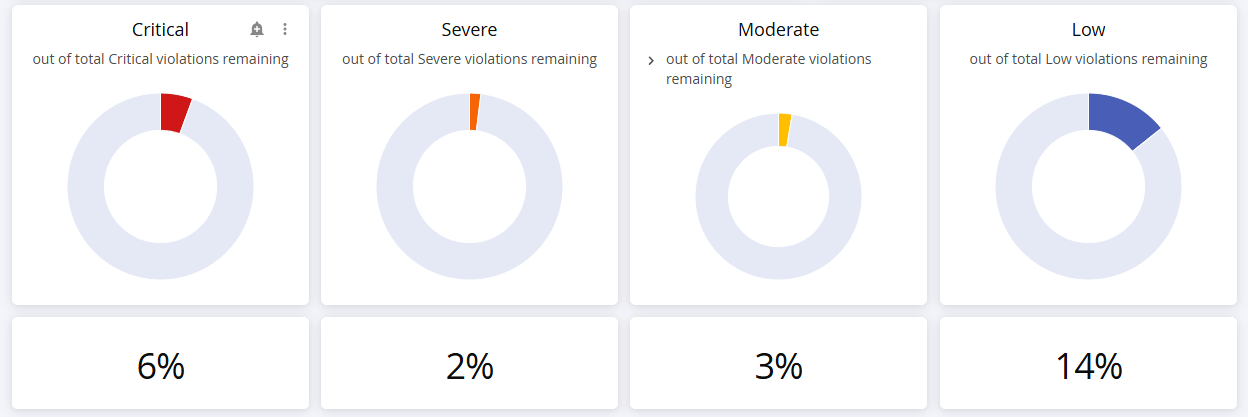
This pie chart breaks down Golden Fix opportunities by policy threat level, showing the following distribution across:
Critical (threat levels 8-10)
Severe (threat levels 6-7)
Moderate (threat levels 3-5)
Low (threat levels 1-2)
Use this visualization to prioritize your golden fixes adoption strategy, focusing first on critical and severe vulnerabilities that can be resolved with minimal effort. The chart shows both count and percentage for each threat level.
Applications and Components with Golden Fixes Available
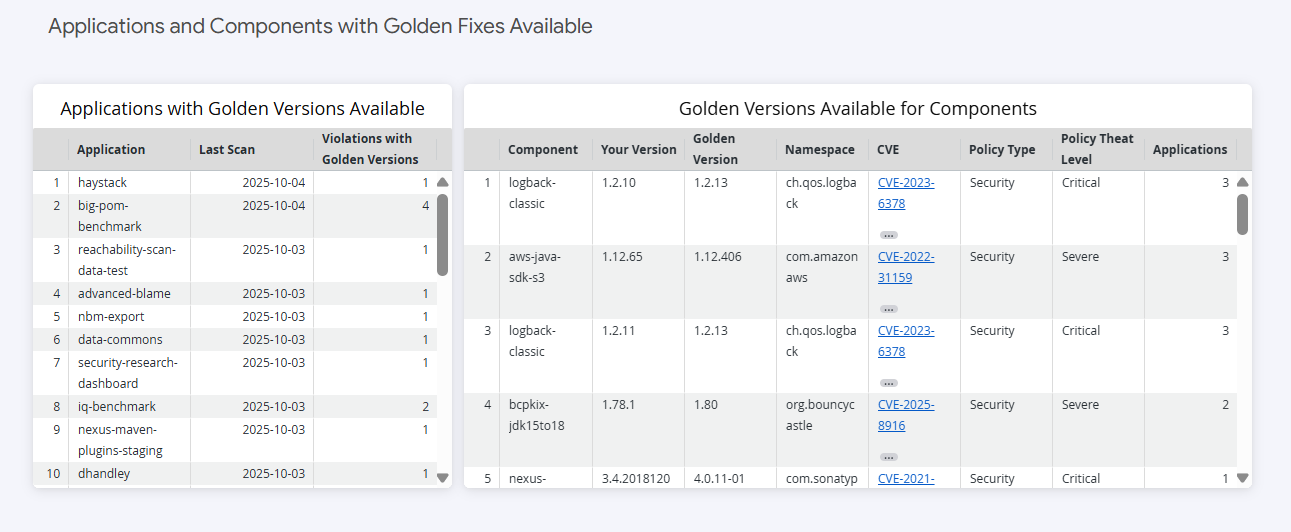
Applications with Golden Fixes Available
This table lists applications that contain violations eligible for golden fixes remediation.
For each application, you can see the following :
Application Name
Number of Violations that can be resolved with golden fixes.
Last Scan Date (based on the most recent open violation detected).
Applications that have been scanned but contain no violations will not appear in this table, as there are no security issues requiring remediation.
Golden Fixes Available for Components
This detailed table shows the specific golden fixes options available for your components. Each row represents a golden version recommendation for a unique component.
Note
The dashboard now displays only one golden recommendation per component, representing the best verified and policy-compliant upgrade path.
This table includes:
Component Name and Current Version
Golden Version (recommended upgrade target)
Number of Applications using this component
Violation Count that would be resolved