Usage Metrics
Usage metrics are display for administrators on their home screens after logging into the user interface. Depending on what Nexus Repository edition you are using, you will see the information below defining usage in the Usage Center. Usage metrics take up to an hour to update after making changes to your usage. Monthly requests are updated once a day.
Tip
The usage information is supported for High Availability (HA) deployments as of the Nexus Repository 3.80.0 release.
Requests Used to Calculate Metrics
For the purpose of counting usage analytics, Nexus Repository tracks and counts HTTP requests that are directed towards repository endpoints. A HTTP request is a standard web-based communication initiated by a client application communicating with Nexus Repository.
Repository endpoint example:
https://nexus.example/repository/maven-public/
The total requests outnumber the total number of components as multiple requests may be made for a single component download. What qualifies as a request falls under a range of operations:
Multiple requests per component download
This includes binary files like Maven JARs, Docker image layers, and npm package tarballs.
Docker layers are a good example of a component or image that is made of many files. A single docker pull command translates into multiple HTTP requests: one for the authentication token, one or more for manifests, and then a pair of HEAD/GET requests for each unique layer blob. Given that Docker images are composed of numerous layers, a single image pull can readily involve a dozen or more distinct HTTP requests.
Uploading a component
When your clients publish new components to hosted repositories. This includes multiple items such as the package and updates to the metadata files for the repository.
Requests using API calls
Most client tools use the direct URL path when downloading components. Some CLI tools may use API calls to provide this function and will generate requests that are counted. Repository's search and browse functionality are not counted towards the total number of requests.
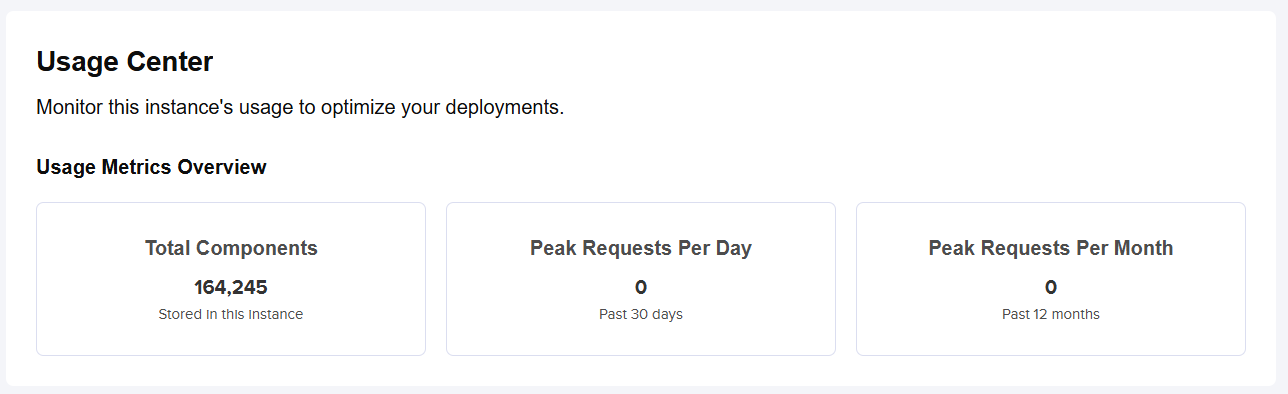
Pro Usage Metrics
Nexus Repository Pro instances not subject to hard limits see a simplified version of the usage metrics different from the Community Edition users.
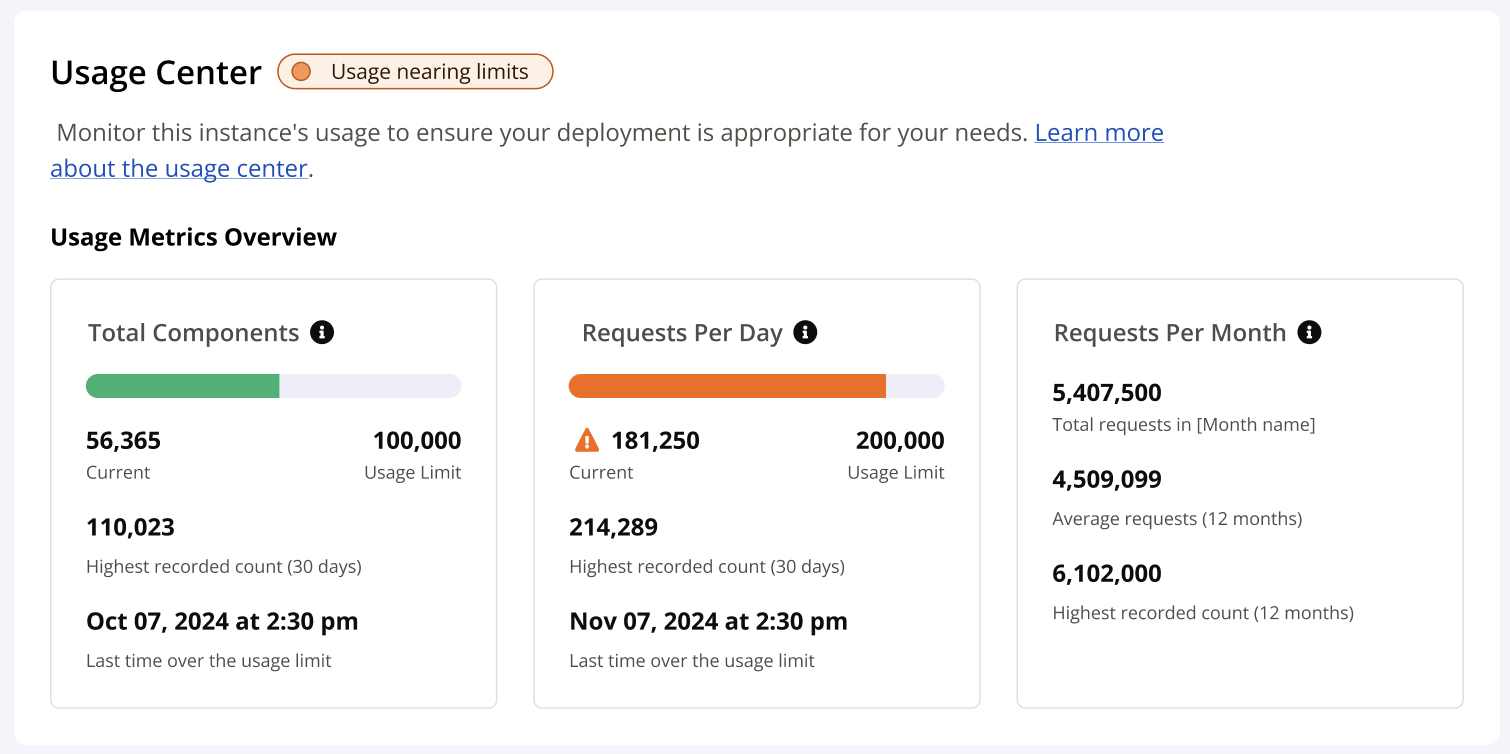
Component Metrics
The first panel of usage metrics displays information about the components in your deployment.
Total components | Total number of components in this instance when counting each individual component record in the database. |
Highest recorded component count (30 days) | Highest recorded number of components in this instance across all repository formats in the last 30 days. |
Last time over the usage limit | Date and time when this deployment last exceeded the CE 100,000 total component limitation. |
Request Metrics
The second panel of usage metrics displays various information about HTTP requests in your deployment.
Requests per day | Number of requests to repository endpoints for all repositories in this Sonatype Nexus Repository instance over the past 24 hours. Calculated on an hourly basis. Only considers requests to the /repository/* url path. |
Peak requests per minute | Maximum number of requests per minute to repository endpoints for all repositories in this Sonatype Nexus Repository instance over the past 24 hours. Only considers requests to the /repository/* url path. |
Highest recorded request count(calendar month) | Maximum number of requests per day to repository endpoints for all repositories in this Sonatype Nexus Repository instance over the past calendar month. Requests are aggregated to calculate the metrics usage everyday at midnight UTC. Only considers requests to the /repository/* url path. |
Last time over the usage limit | Date and time when this deployment last exceeded the CE 200,000 requests per day limitation. |
Requests Per Month Metrics
The third panel of usage metrics displays requests per month for your deployment. Calculations are based on UTC time.
Total requests | Total requests for the current month |
Average requests | Average monthly requests for the last 12 months |
Highest recorded count | Highest monthly requests in the last 12 months |
Additional Metrics for Nexus Repository Cloud
The data for Nexus Repository Cloud metrics are coming from CloudWatch. Detailed usage by month can be found on the license management historical usage view.
See Historical Metrics on the license management page.
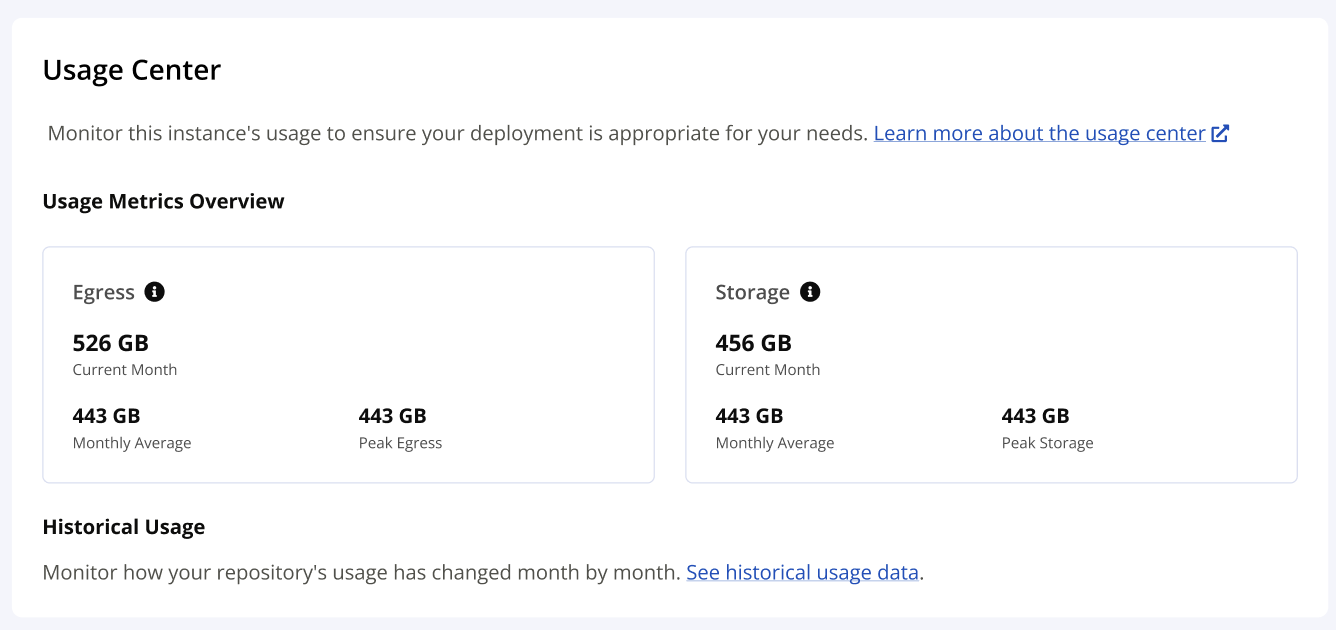
Egress | This refers to the total size, in gigabytes, of all components downloaded from the Nexus Repository Cloud environment per month. |
Storage | This refers to the total size, in gigabytes, of all components stored in the repository's blob stores managed by Nexus Repository Cloud. |
Deprecated Metrics
The following metrics have been removed as of the Nexus Repository 3.79.0 release.
Login Metrics
This panel of usage metrics displays login information for your deployment.
Unique successful logins to this instance in the last 24 hours and 30 days. Identified by the combination of userID and realm as an individual identifier. |