Logging
Effective logging is critical for monitoring the health, security, and performance of your Nexus Repository deployment. Nexus Repository internally leverages Logback, a powerful and flexible logging framework for Java applications, enabling detailed control and management of logging behaviors.
Logging in Nexus Repository is manage using the configuration files as well as setting the logging levels in from the user interface. High availability and resilient deployment may have additional logging configuration depending on your reference architecture.
Overview
Log files generated by Nexus Repository reside in the $data-dir/log/ directory. Key log files include:
nexus.log The main Nexus Repository application logs are rotated and compressed daily. Records general system information, such as startup/shutdown events, application activity, warnings, errors, and debug details.
request.log Inbound HTTP request log rotated and compressed daily. Log messages include information such as date/time, client IP, authenticated user id, user-agent header value, response status code, bytes sent, and total response time.
Captures HTTP request data, including timestamp, IP addresses, HTTP methods, accessed endpoints, response codes, and response durations.
outbound-request.log Outbound request log rotates daily, maintains 90 days of log files by default, and compresses old logs. The log includes information such as date/time, authenticated user id, method, URL, response status code, bytes sent, bytes received, and response time.
jvm.log Contains JVM stdout, stderr, and full thread dumps when explicitly triggered. This log file is normally only relevant when thread dumps need to be extracted from it. This file is not rotated because it should not grow very large. On each application start, the entire contents of this file will be replaced.
log/audit/audit.log When Auditing is enabled, audit logs are written to this directory. The active log file is named audit.log. Audit logs are rotated and compressed daily.
Contains security audit entries, such as login attempts, permission changes, and sensitive operational events.
tasks/*.log Tasks generate logs on execution to isolate the processes the task performed. These log files include messages that generate more noise than should be included in the main application log.
Logs are named by the task's internal name and a timestamp.
By default, logs rotate daily, compress into archives, and retain historical logs for 90 days.
Logging Configuration
Logback is a widely-used, open-source logging framework for Java-based applications. Developed as the successor to the popular Log4j project, it offers high performance, flexibility, and ease of use. Nexus Repository, among many other Java applications, leverages Logback for managing application logging.
See Logback website
The below files are the configuration where logging is set.
logback.xml Default logging configuration is set in the
logback.xmlfile stored in the installation directory of the Nexus Repository binary.$install-dir/etc/logback/logback.xml
logback-overrides.xml Modify loggers is by setting them in the
logback-overrides.xml. Loggers set here override configuration setlogback.xml. These changes are located in the data directory and are maintained during restarts and upgrades.$data-dir/etc/logback/logback-overrides.xml
Logging in HA Deployments For high-availability (HA) environments, logger configurations are stored in the
logging_overridesdatabase table for cluster-wide consistency.
Logging configuration changes between versions of Nexus Repository. You may have to reconfigure loggers when upgrading your Nexus Repository. The loggers configured in the user interface are persisted differently based on your deployment model.
Log Viewer
The Log Viewer is a built-in feature that provides administrators direct access to server logs through the Nexus Repository user interface. It enables quick troubleshooting and monitoring by displaying real-time and historical logging information about repository operations, events, errors, and user activities.
Accessing Logs in the User Interface
Administrators with the nx-all privilege may access logs directly within the Nexus Repository UI:
Log into Nexus Repository as an administrator.
Under Settings, navigate to Support → Logs.
Select and review logs directly within the web interface.
This built-in interface facilitates rapid troubleshooting without requiring direct filesystem access.
Refresh Rate The rate at which the log refreshes in the user interface refresh by.
manual, 20 seconds, 1 minute, 2 minutes, 5 minutes
Size The amount of content that is displayed at a time in the UI.
25KB, 50KB, 100KB
Marker to insert into the log Add a custom text string into the log in order to create reference points in the log file for analysis. The text is added to the bottom of the file surrounded by asterisks (*) to make it easy to find. The word
MARKis added when nothing is provided in the text box.Download Download a copy of the logs from the instance.
Logging View
The Logging section is used to manage pre-configured loggers and create new ones. A logger's name corresponds to the Java package name.
Nexus Repository default logger levels are intended to be verbose enough to help diagnose problems should you encounter them but quiet enough to not create overly large log files. You may increase default log output when more information is needed or decrease the level to avoid spamming the application log with noisy messages.
Logger levels are set at optimal levels for normal operation. Setting loggers to more verbose levels may cause performance issues. As a best practice, only adjust loggers to diagnose a specific problem and adjust them back to default levels after diagnosing that specific problem.
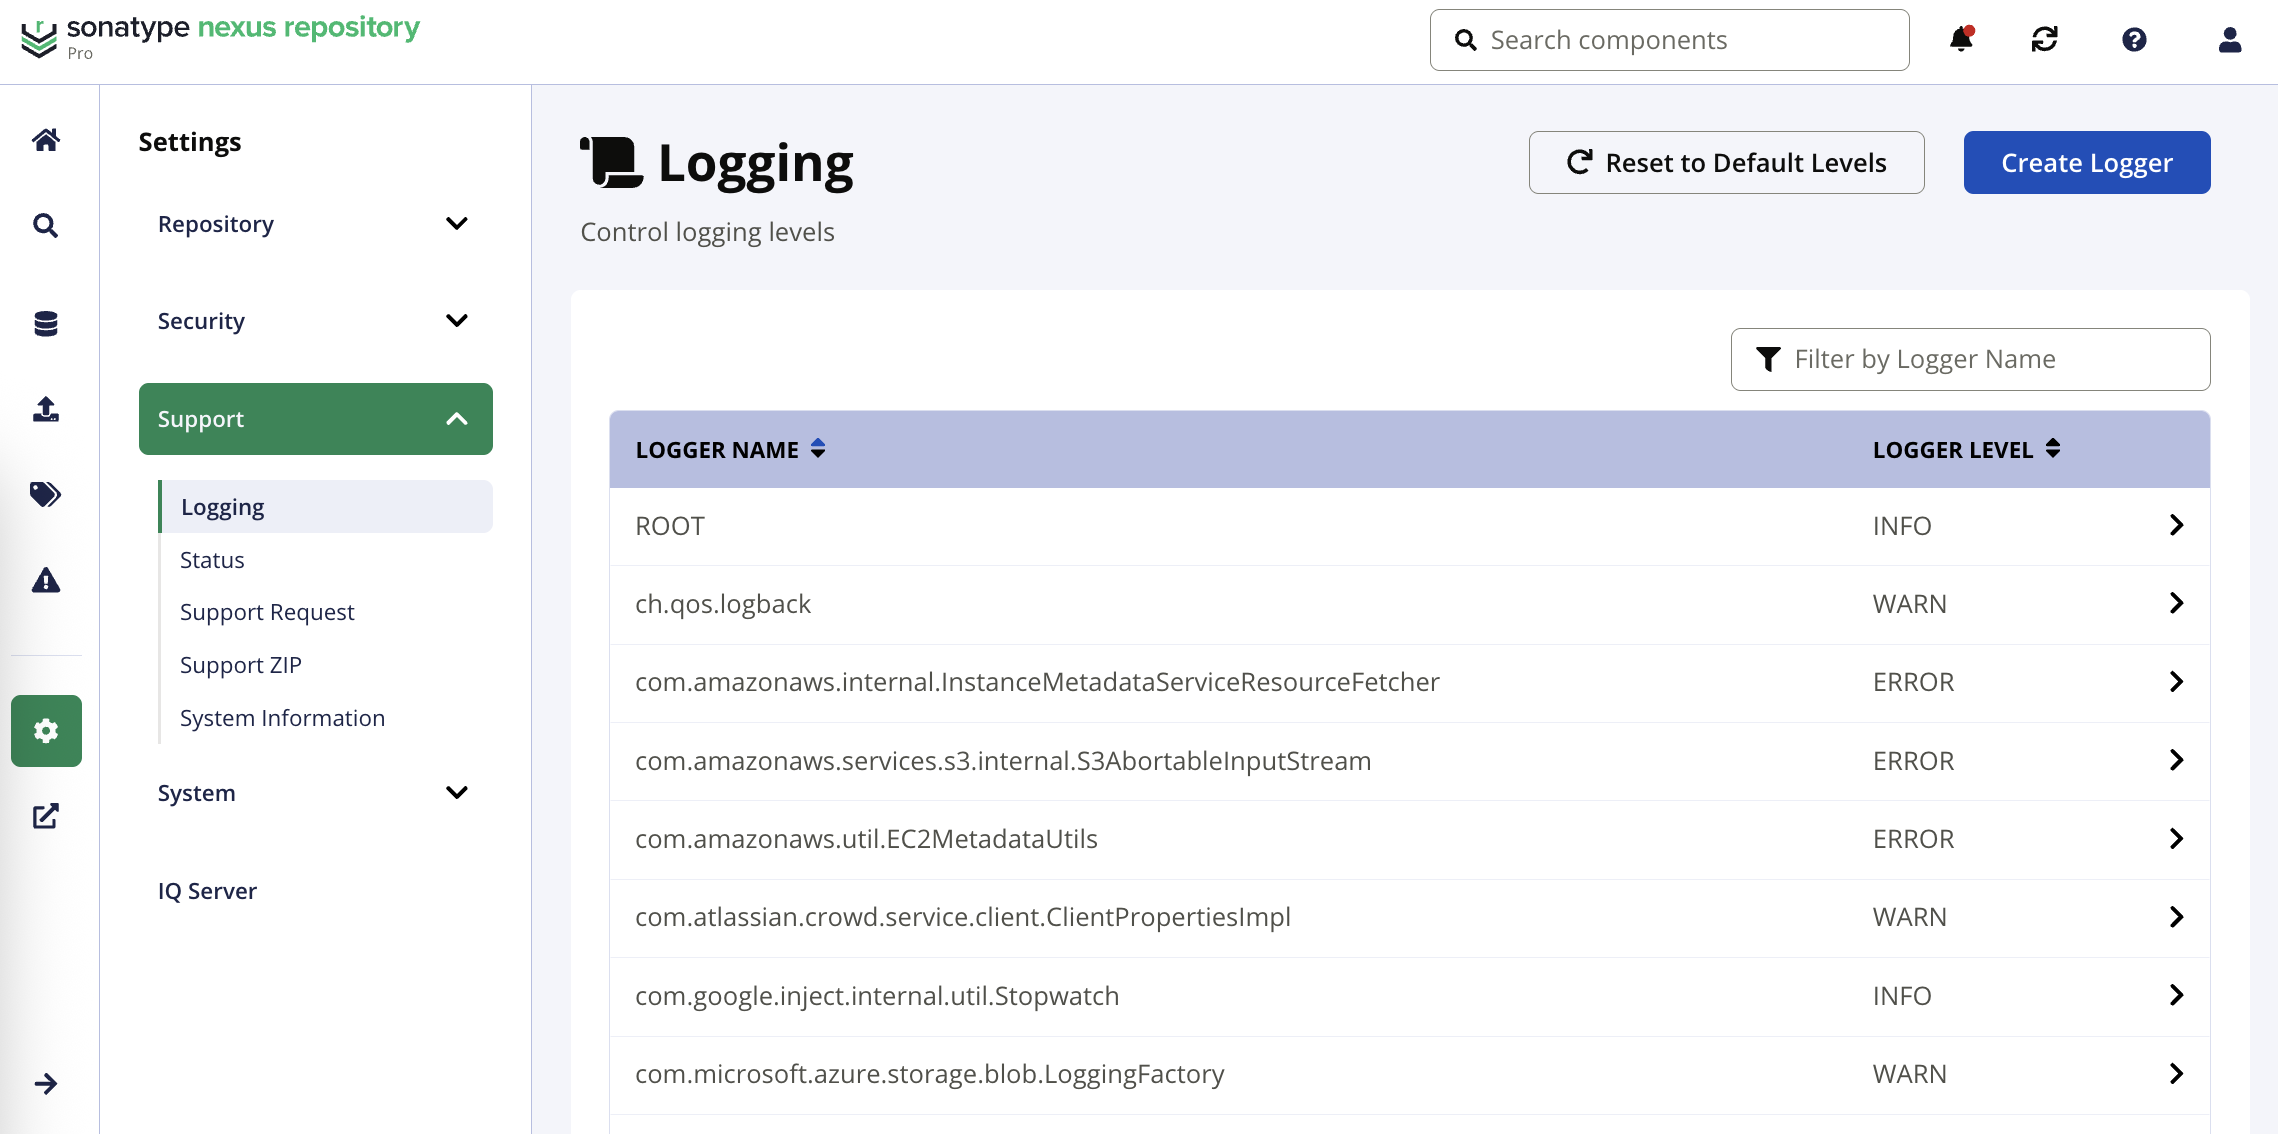
You can modify the log level for a configured logger by selecting on the row for the logger you wish to modify.
Reset the loggers to their default level by selecting the Reset to Default Levels button in the UI. This removes custom configuration set in the UI but not from the modifying the logback-overrides.xml.
Creating a Logger
Create a new logger using the following steps:
Select Create Logger
Provide the logger's name.
Select the Logger Level
Select Save
Below are some suggested adjustments by feature area.
LDAP Diagnose LDAP Queries and LDAP Server Connection Stack Traces.
org.sonatype.nexus.ldap = DEBUG
NuGet Repository Diagnose NuGet issues.
com.sonatype.nexus.repository.nuget = DEBUG
SAML Logging SAML-related activity.
com.sonatype.nexus.saml = DEBUG
org.keycloak.saml = DEBUG
User Interface Diagnose UI search inbound JSON payloads.
org.sonatype.nexus.coreui.SearchComponent = DEBUG
Webhooks Diagnose outbound webhook payloads.
org.sonatype.nexus.internal.webhooks = DEBUG
Examples
2016-12-14 17:09:43,902+0000 DEBUG [event-1-thread-2] admin org.sonatype.nexus.internal.webhooks.WebhookServiceImpl - Sending webhook request: WebhookRequest{id='9d80527e-8f7d-455a-a86b-191e9ac7ab9e', webhook=rm:repository:component, payload=org.sonatype.nexus.repository.webhooks.RepositoryComponentWebhook$RepositoryComponentWebhookPayload@2a89735b, url=http://requestb.in/abcd}
2016-12-14 17:09:44,420+0000 DEBUG [event-1-thread-2] admin org.sonatype.nexus.internal.webhooks.WebhookServiceImpl - Sending POST request: POST http://requestb.in/abcd HTTP/1.1
2016-12-14 17:09:44,765+0000 DEBUG [event-1-thread-2] admin org.sonatype.nexus.internal.webhooks.WebhookServiceImpl - Response status: HTTP/1.1 200 OK
When there is an error in posting to the webhook url, then you will see an error like the following:
2016-12-14 16:40:34,567+0000 ERROR [event-1-thread-16] admin org.sonatype.nexus.internal.webhooks.WebhookServiceImpl - Failed to send webhook request: WebhookRequest{id='071b719e-683d-4fb4-a031-12e292ed4ec0', webhook=rm:repository:component, payload=org.sonatype.nexus.repository.webhooks.RepositoryComponentWebhook$RepositoryComponentWebhookPayload@76beefa6, url=http://requestb.in/abcd} org.apache.http.client.HttpResponseException: Not found
The ROOT logger level controls how verbose the logging is in general. If set to DEBUG, logging will be very verbose, printing all log messages including debugging statements. If set to ERROR, logging will be far less verbose, only printing out a log statement if Nexus Repository encounters an error. INFO represents an intermediate amount of logging.
The following table describes the different logging levels.
Level | Verbose | Description |
|---|---|---|
Highest | Includes every step of an event's code execution | |
Very High | Granular information to use for debugging | |
Typical | Provides information about events | |
Something unexpected occurred in the application but continues to operate. An issue that could disrupt processes. | ||
Critical | Nexus Repository has encountered an issue preventing proper functionality |
PostgreSQL Database Logging
When Nexus Repository connects to an external PostgreSQL database, those databases maintain their own logging configurations. To effectively manage Nexus Repository, configure and monitor the PostgreSQL logs.
Find our recommended PostgreSQL logging settings in the configuration documentation.
See Install Nexus Repository with a PostgreSQL
Limit Excessive Logging
Audit logging for PostgreSQL captures the content that is added into the database. Attributes added by some searching makes the current log lengthy while offering little value. The logging levels may be overridden by setting property in the nexus.properties file.
See Limiting Excessive Audit Log Line Length Due for Asset Updates
Upload Log Files to an S3 Bucket
A custom log appender may be used to push and rollover logs to an S3 bucket.
Edit the logback configuration to supply the rolling policy for the appenders to include this capability.
$install/etc/logback/logback.xml
This example for sending the audit logging to S3:
<appender name="auditlogfile" class="ch.qos.logback.core.rolling.RollingFileAppender">
  <File>../sonatype-work/nexus3/log/audit/audit.log</File>
  <Append>true</Append>
  <encoder>
    <pattern>%msg%n</pattern>
  </encoder>
  <filter class="org.sonatype.nexus.logging.AuditLogFilter"/>
  <rollingPolicy class="com.sonatype.nexus.common.logging.s3.S3RemoteTimeBasedRollingPolicy">
    <fileNamePattern>../sonatype-work/nexus3/log/audit/audit-%d{yyyy-MM-dd}.log.gz</fileNamePattern>
    <maxHistory>90</maxHistory>

<!-- S3 options begin here -->
    <loggingThreadCount>1</loggingThreadCount>
    <bucketName>some-s3-bucket</bucketName>
    <bucketPrefix>node-1</bucketPrefix>
    <bucketRegion>us-west-2</bucketRegion>

<!-- These fields are only needed when IAM permissions are not set for the runtime to access the above S3 bucket -->
    <accessKey>some-secret-access-key</accessKey>
    <secretKey>some-secret-key</secretKey>
  </rollingPolicy>
</appender>
The S3 properties may be provided using the following environment variables when not supplied in the logback.xml.
S3_LOGGING_THREAD_COUNT: Number of threads for S3 loggingS3_LOGGING_BUCKET_NAME: Name of the S3 bucketS3_LOGGING_BUCKET_PREFIX: Root path for the logs upload; use this to indicate node namesS3_LOGGING_BUCKET_REGION: Region of the S3 bucketS3_LOGGING_ACCESS_KEY: Access key for the S3 bucketS3_LOGGING_SECRET_KEY: Secret key for the S3 bucket.
Renaming Logging Framework
In release 3.80.0, the Nexus Repository logging class path has been renamed in the logback.xml configuration.
org.sonatype.nexus.pax.logging
Is changed to:
org.sonatype.nexus.logging
Review the class paths in the logback.xml configuration when using logging overrides.
<filter class="org.sonatype.nexus.logging.AuditLogFilter"/>