Upgrade Posture
About the Data
Data Refresh Frequency: Monthly (1st of each month)
Displays Data for: Last 90 days
Minimum Requirements: New users will have to wait for next month's data refresh for meaningul metrics.
Overview
When development teams become too reactive in adopting new component versions, more security vulnerabilities end up in your applications. The Upgrade Posture insight helps you evaluate your vulnerability management practices to ensure that they are proactive so that your applications remain secure.
The Upgrade Posture dashboard evaluates the applications in your Lifecycle instance by looking at the components that they contain and evaluating the following key data points:
Upgrade frequency for a given component
The quality (i.e., component version score) of the version to which you upgraded
How often components become low-quality, suboptimal versions within your upgrade frequency
Component Upgrade Classifications
Each component in your applications is classified into one of four vulnerability management categories: reactive, borderline, proactive, or optimal. The table below defines each of these classifications and provides suggestions for improving vulnerability management for that component.
Classification | Description | Suggested Corrective Actions |
|---|---|---|
Reactive | A Reactive classification indicates that you are not updating this component frequently or quickly enough, putting your application security at risk. The component may still be on a vulnerable version and is likely on an unsupported, legacy version. | It is critical that you upgrade reactive components as soon as possible. Review policy evaluation reports and upgrade this component immediately. |
Borderline | A Borderline classification indicates that you need to improve your upgrade practices for this component. It's falling behind in its quality, and you are using stale versions that may not be officially supported. This could put your application security at risk. | It is important that you upgrade borderline components as soon as possible. Adjust your upgrade practices to take new versions more frequently. |
Proactive | A Proactive classification indicates that the component is on a newer, supported version and that you upgrade it in a stable, planned, effort-efficient approach focused on quality outcomes. | No immediate action is necessary. Upgrade proactive components as much as possible within your planned efforts. |
Optimal | An Optimal classification indicates that this component is upgraded rapidly to the best available versions. | No action is necessary. Optimal components are on the best available versions already. |
Practical Application of Component Classifications
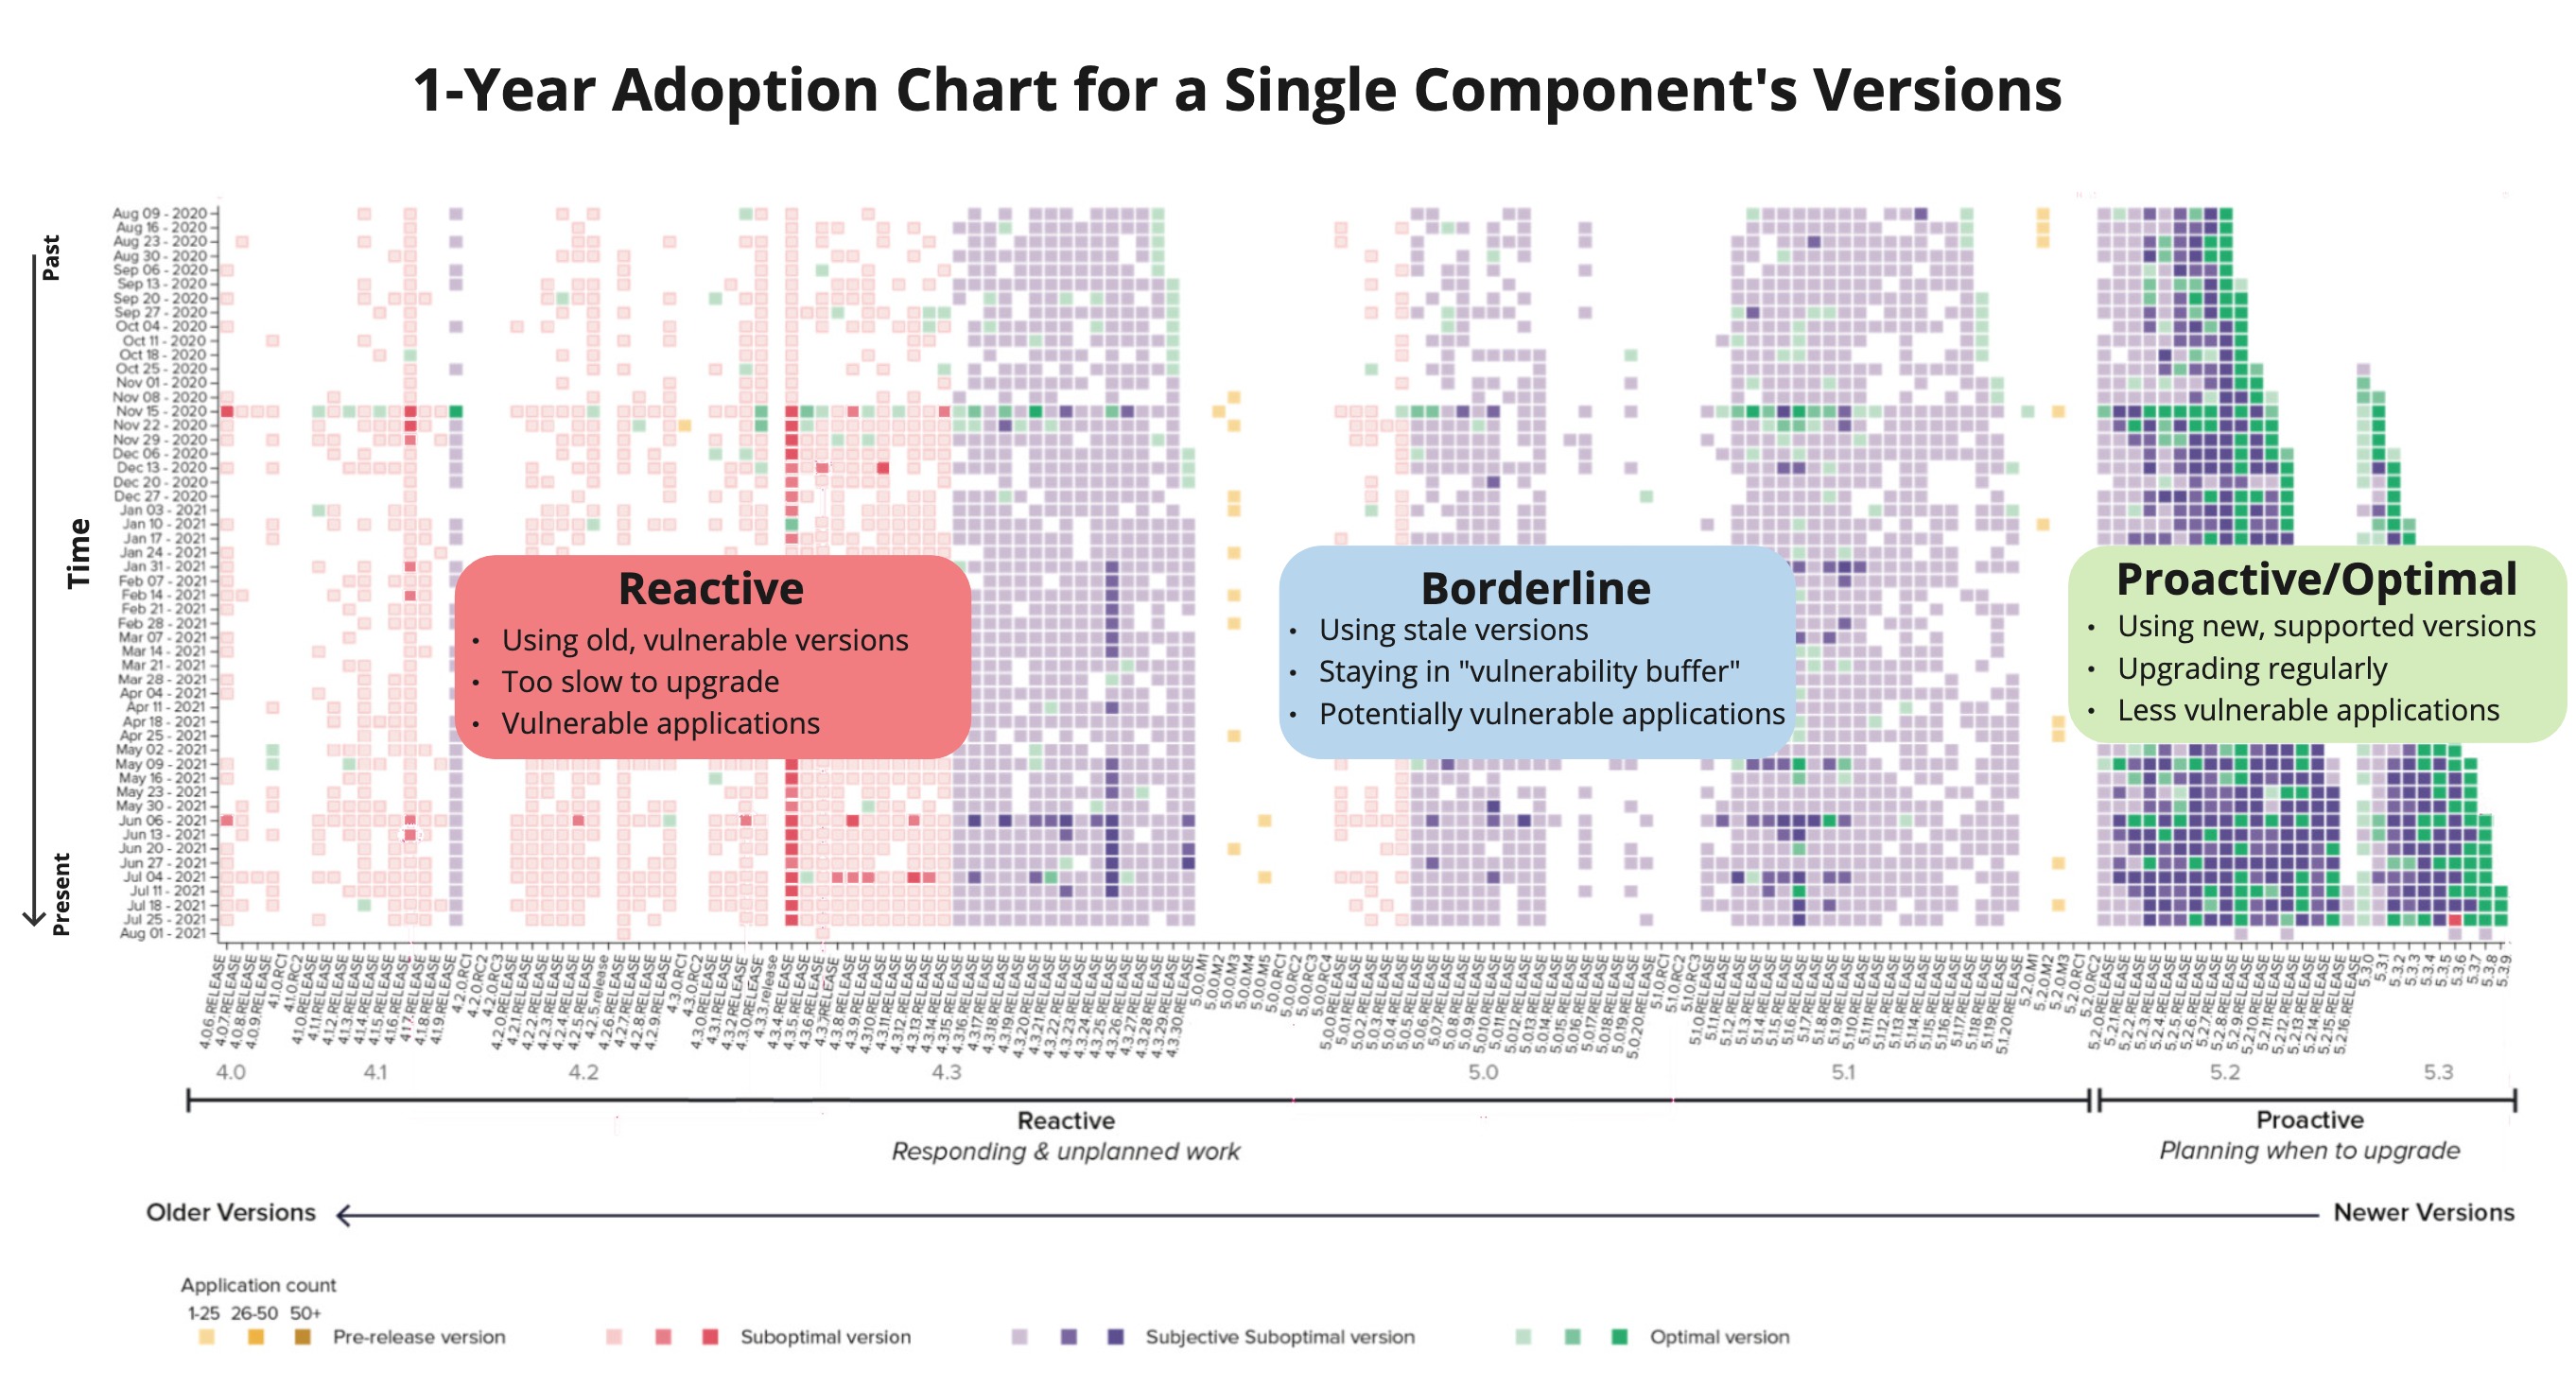
The chart below takes a single component and shows how many applications adopted different versions of that component over a year.
Those on the far left of this chart would see this component labeled as "Reactive" in this insight as they are upgrading the component too slowly and even upgrading to vulnerable versions. Upgrading this component is urgent for these applications.
Those in the middle would likely see the component labeled as "Borderline" since they are adopting suboptimal, stale versions of the component but upgrading more frequently than those still upgrading to vulnerable versions. It's important to plan for upgrading this component in these applications.
Those to the far right would likely see "Proactive" or "Optimal" in this insight as they are upgrading frequently to the latest officially supported versions of this component. These applications use appropriate vulnerability management practices.
Get to Know Your Upgrade Posture Dashboard
Selecting the Date Range and Upgrade Classification
Use the Date Range drop-down to select the time period for which you want to see the Upgrade Posture. A date range covering a maximum of 6 months is supported.
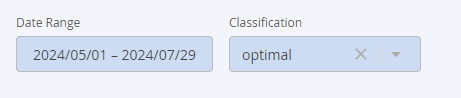
You can select a specific Component Upgrade Classification from the Classification drop-down to view results for that category.
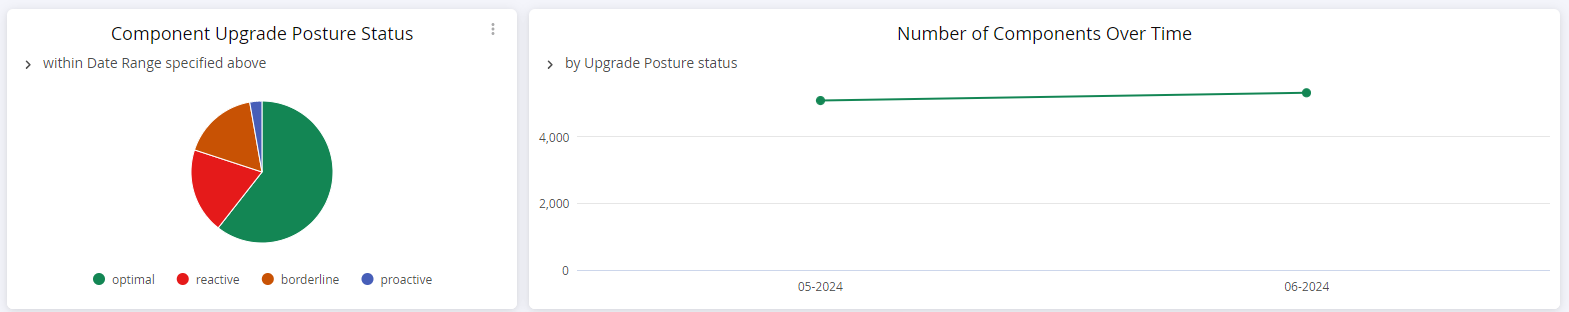
Component Upgrade Posture Status
The pie chart shows a distribution of the number of components upgraded under each upgrade classification of reactive, borderline, proactive, and optimal.
The trend line gives a clear indication of the direction in which the selected upgrade classification aligned over the months that there was available data.
The exact count of components in each upgrade classification is displayed on the cards below:

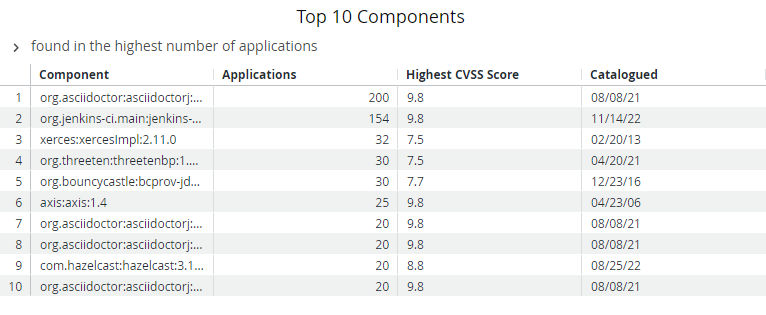
The Top 10 Components table shows a list of the top 10 components that were classified into the category selected as the filter option.
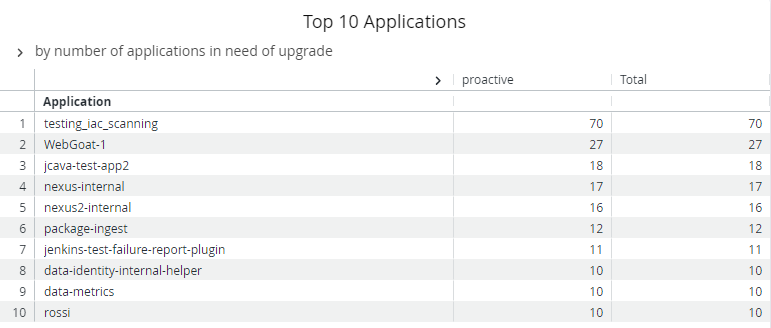
The Top 10 Applications table shows a list of the top 10 applications that have components classified into the category selected as the filter option.
Additional Supported Operations
You can download the underlying data by clicking on the kebab (3 vertical dots) icon on the right top corner of this dashboard.

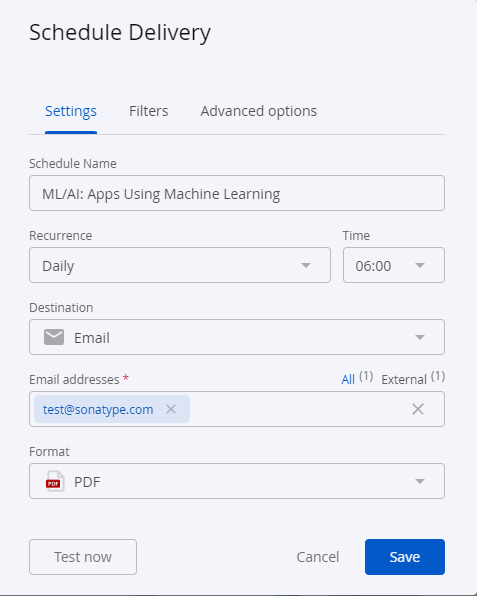
Using the option, Schedule Delivery as shown below, you can send the dashboard data to multiple email addresses in the preferred format. Supported formats include PDF, CSV, or a PNG zip file. Use the Recurrence and time field to set the timing of your data delivery options.
 |
Troubleshooting
Problem
Clicking on the browser Refresh button may give you the following error:
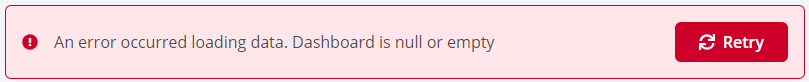
Solution
Click the Back button on your browser, from the page where you see this error, to go back to the Landing page Enterprise Reporting. Select the dashboard you want to view, to reload the visualizations.
To refresh the page, click on the refresh icon on the top right, instead of the Refresh button on your browser.

Problem
No data visible on the dashboard or any other issues with the dashboard.
Solution
Click on Copy to Support Info to Clipboard button and contact support with this information.