Dependency Scorecard
Retiring August 31, 2025
To enhance your Enterprise Reporting experience, we're continuously evolving our Data Insights. As part of this, the Dependency Scorecard's data refresh will end on July 31, 2025, with it formally being retired August 31, 2025. We're excited to bring you new and improved insights soon, so keep an eye on this space for updates!
About the Data
Data Refresh Frequency: At 12:00 PM UTC, on day 1 of the month
Displays Data for: Last 365 days
Minimum Requirements: For meaningful metrics, applications should have been scanned on different days
Overview
The Dependency Scorecard is a visual representation of the quality of the component upgrade decisions made by your development teams. Based on the quadrant position of the selected application in the scorecard, you can pin-point the applications that are upgraded less frequently or have sub-optimal component versions. You will be able to view the applications you have access to.
Get to Know Your Dependency Scorecard
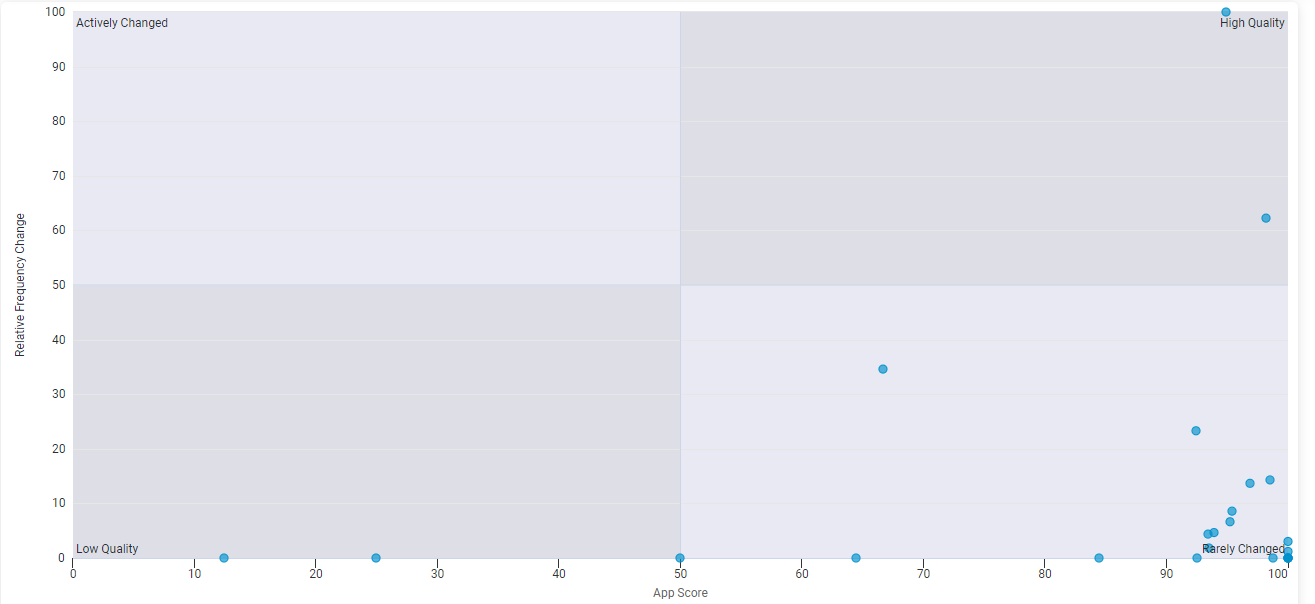
The Y-axis on the scorecard, Relative Frequency Change indicates the frequency at which the application has undergone a change. An application is considered as changed when there is an addition of a new dependency and removal or upgrade of an existing dependency.
The X-axis on the scorecard, App Score is calculated based on the version of the new component or dependency that was detected during the application scan. Higher App Scores indicates a high quality upgrade based on the scoring rules. Learn more about our 8 rules for Upgrading to the Optimal Version.
Click on the data points in the scatter plot for the application name, App Score and its stage in the development pipeline.

Dependency Scorecard Quadrants
High Quality
An application in the upper-right quadrant has high quality scores, which usually means that the application code base is being maintained actively with optimal component versions.
Suggested Action: Keep staying ahead of the curve!
Rarely Changed
An application in the lower-right quadrant usually means that the application code base is not changed very frequently, although the component versions are as per our recommendations, giving it a high App Score.
Suggested Action: These could be legacy applications. Consider a "Tech Refresh" for dependency updates.
Actively Changed
An application in the upper-left quadrant usually means that code base is actively maintained but the component choices do not align with recommended versions, giving it a low App Score. Better component choices can improve the App Score for such applications.
Suggested Action: Spread awareness among your teams on the importance of making optimal choices when selecting component versions.
Low Quality
An application in the lower-left quadrant usually means that the code base is not actively maintained. The dependencies or component versions detected during scans did not align with the recommended versions. Such applications could pose a security risk to your environment and the supply chain at a larger scale.
Suggested Action: Immediate security policies and process improvements are recommended.
Filter Options

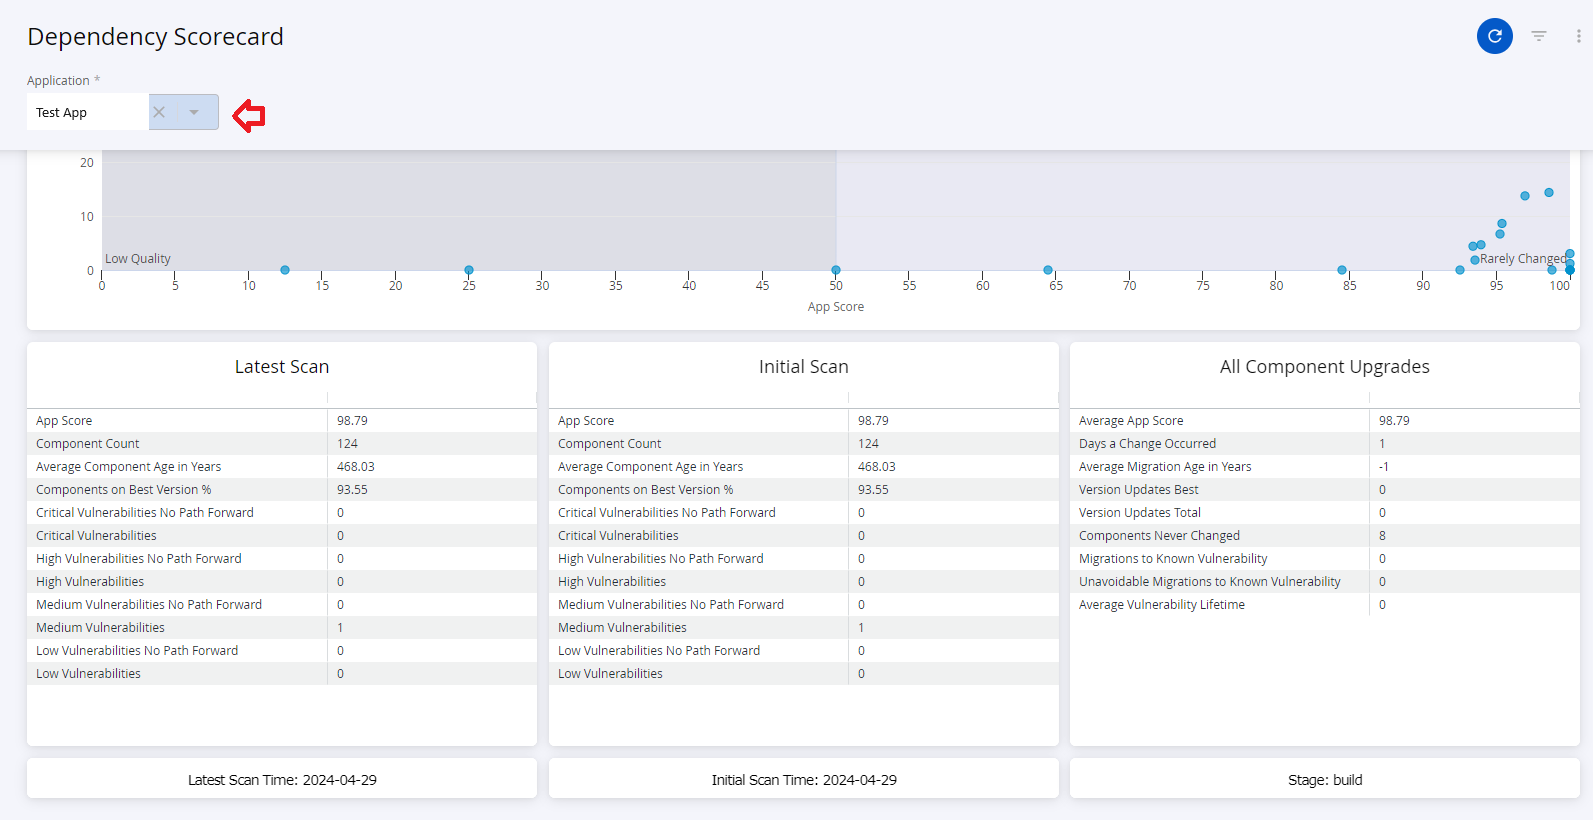
Select the application or library name from the filter options to view the Dependency Scorecard.
Key Indicators Affecting Dependency Score
Select an application name from the dropdown at the top to view the key indicators that affect the dependency score of the application. Only applications on which you have access to, will be accessible from the dropdown.

Troubleshooting
Problem
Clicking on the browser Refresh button may give you the following error:

Solution
Click the Back button on your browser, from the page where you see this error, to go back to the Landing page Enterprise Reporting. Select the dashboard you want to view, to reload the visualizations.
To refresh the page, click on the refresh icon on the top right, instead of the Refresh button on your browser.

Problem
No data visible on the dashboard or any other issues with the dashboard.
Solution
Click on Copy to Support Info to Clipboard button and contact support with this information.
