Legal Risk Analyzer: ALP + Lifecycle
About the Data
Data Refresh Frequency: Updated daily at approximately 09:00 UTC. Changes appear after the next scheduled refresh.
Displays Data for: Declared license data, legal-risk findings, waiver activity, and violation severity across applications and components within the selected filters. When Advanced Legal Pack (ALP) data is available, the dashboard also displays observed license data, fulfilled legal obligations, attribution-report activity, evaluated applications, and collected legal evidence.
Minimum Requirements: Applications must be scanned at least once. The dashboard reflects data only for applications that meet this requirement. You should be using version 208 or higher.
Note
If your organization does not have an Advanced Legal Pack license, the dashboard displays Lifecycle data only.
If ALP is licensed but no ALP data is available for the selected filters, the applicable comparison tiles display No ALP data Available.
Some ALP activity and legal-evidence metrics are forward-looking and might not include activity that occurred before the supporting data collection was introduced.
Overview
The Legal Risk Analyzer: ALP + Lifecycle dashboard compares license information declared in component metadata with license information observed through Advanced Legal Pack analysis. Use the dashboard to understand where ALP expands license coverage, monitor legal-risk and waiver trends, and identify the applications and components contributing to those results.
Lifecycle identifies declared license risk. ALP adds observed license insight based on component contents and provides legal evidence that supports obligation review and attribution reporting. The dashboard summarizes this data but does not replace the existing ALP legal-review workflows. For information about reviewing legal obligations, evidence, and attribution reports, see Using the Advanced Legal Pack.
The Legal Risk Analyzer: ALP + Lifecycle dashboard displays the following sections:
Downloading Dashboard and Table Data
You can download dashboard and table data using the dashboard export options.
For instructions on exporting dashboards, tables, and scheduling deliveries, see Exporting Dashboards and Table Data .
Get to Know Your Legal Risk Analyzer: ALP + Lifecycle Dashboard
The interactive Legal Risk Analyzer: ALP + Lifecycle dashboard provides multiple filter options to help you analyze declared and observed license data across your organization.
You can use this dashboard to compare license coverage by package format, review fulfilled legal obligations and collected legal evidence, track attribution report activity, and examine legal violations and waivers over time.
By adjusting filters, you can focus on specific organizations, sub-organizations, applications, application categories, components, license threat groups, stages, sources, or package formats. This allows you to narrow the dashboard to the legal-risk data relevant to the selected scope and review the corresponding application- and component-level findings.
By default, Date Range is set to is on or after 12 months ago, and Stage is set to Build. All other filters initially include any available value.
You can filter the dashboard using the following options:
Date Range: Filter data by a relative or fixed date range.
Organization: Filter by one or more organizations.
Sub Org: Filter by one or more sub-organizations.
Application: Filter by one or more applications.
Application Category: Filter by one or more application categories.
Component Name: Filter by component name.
License Threat Group: Filter by one or more license threat groups.
Stage: Filter by application evaluation stage. The default is Build.
Source: Filter by the declared or observed source of the license data.
Format: Filter by component package format.
Use these filters to narrow the dashboard view and focus on specific areas of Lifecycle adoption.

Note
When you select an organization, the Sub Org and Application filters display values associated with that organization. Available filter values also depend on the data available for the selected date range and other active filters.
Refresh After Filter
After changing one or more filters, select Update to apply the changes. To refresh the current dashboard results, use the dashboard refresh icon instead of the browser refresh option. Refreshing the browser can reset the current dashboard state.
Coverage Comparison
The Coverage Comparison section explains how to interpret declared and observed license data in the dashboard.
Lifecycle identifies license risk based on licenses declared in component metadata. Advanced Legal Pack (ALP) adds observed license insights that can help uncover additional obligations, waivers, and higher-risk components.
For more information about ALP capabilities, see Advanced Legal Pack.
Note
If your organization does not have an Advanced Legal Pack (ALP) license, the dashboard displays Lifecycle data only.
License Coverage by Format
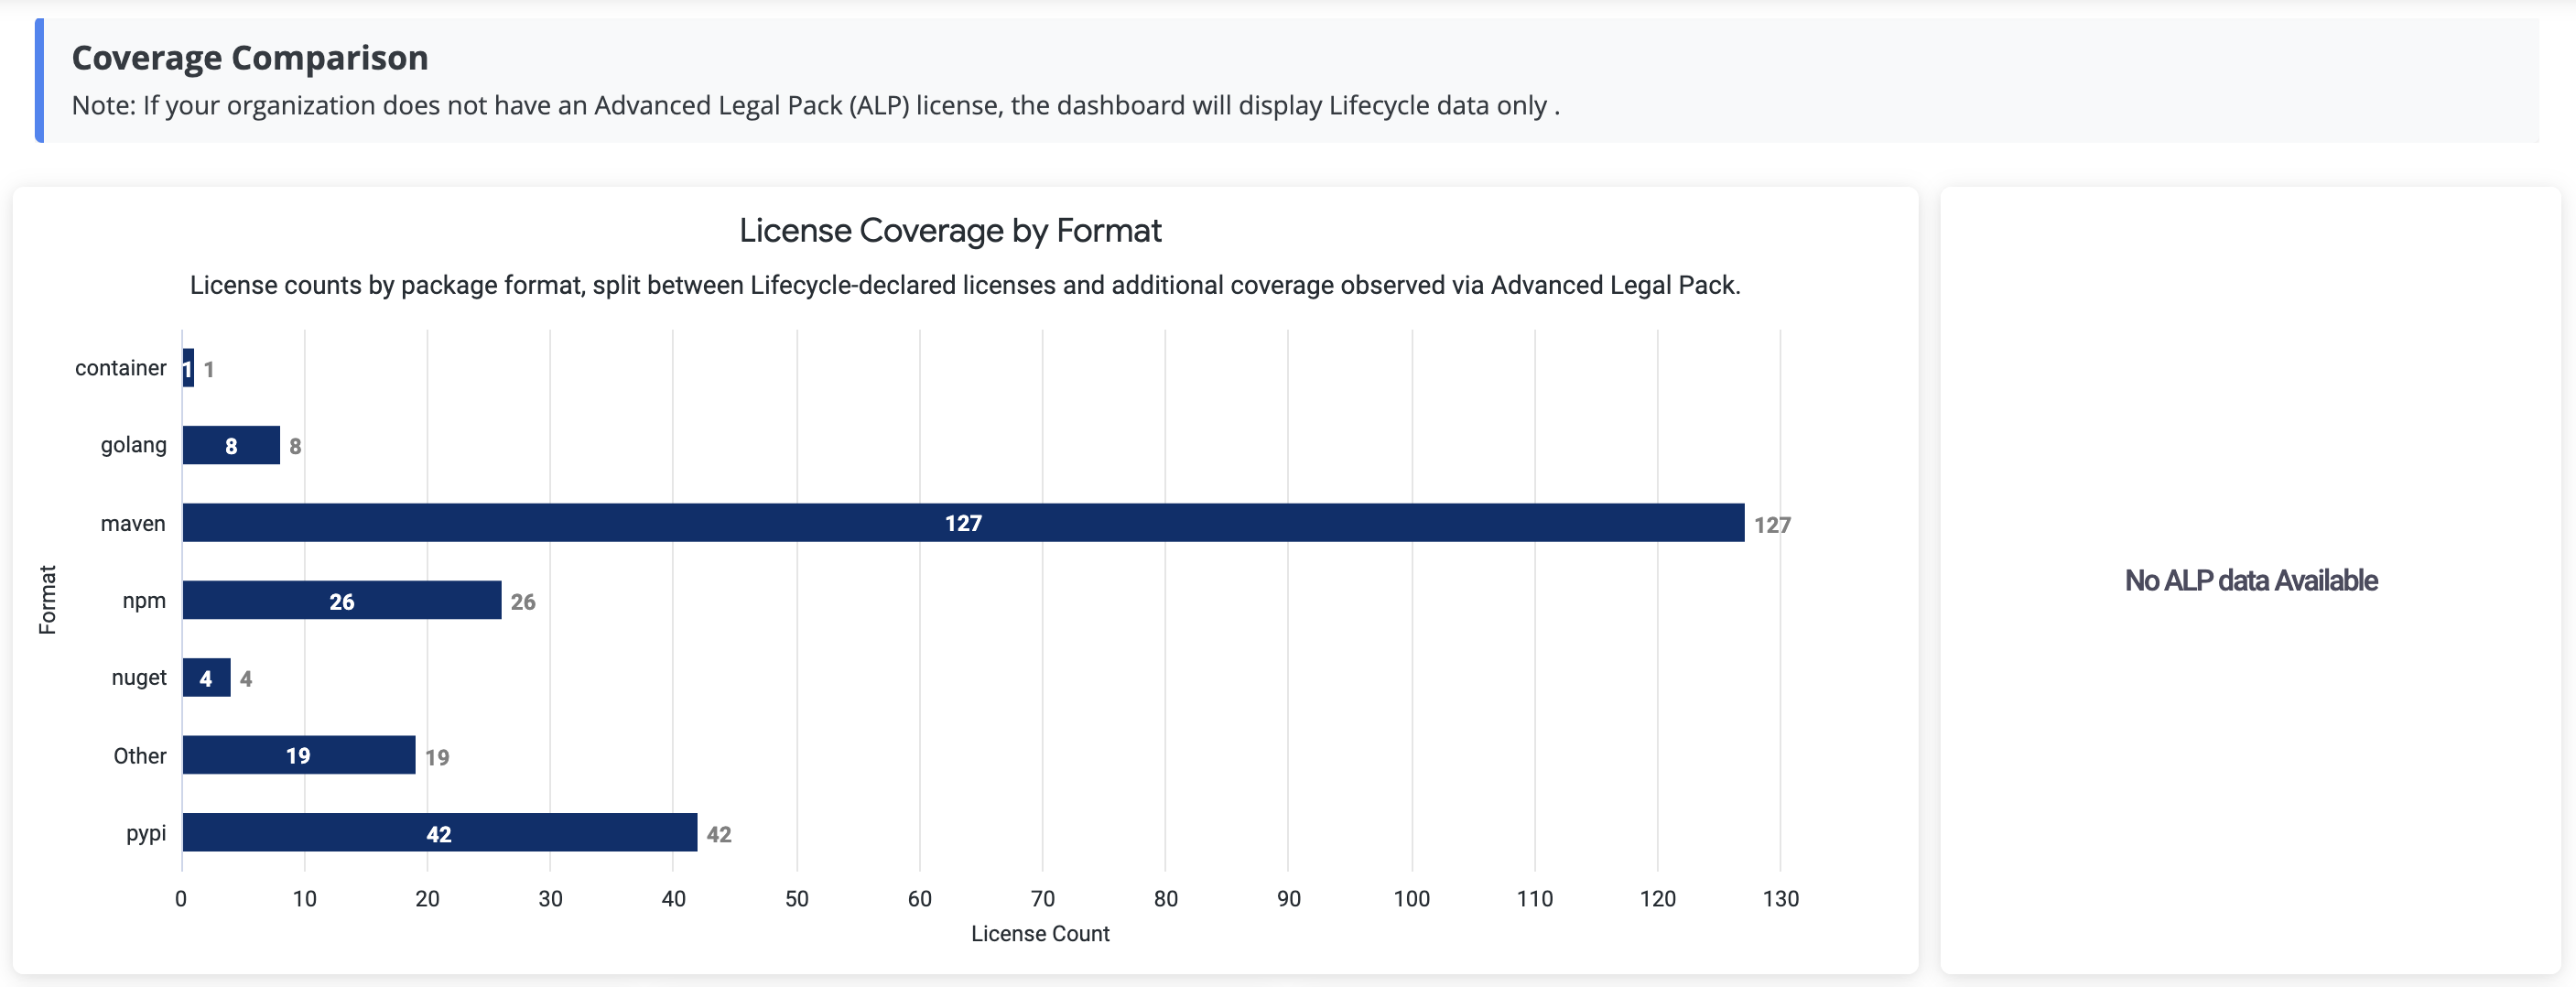
The License Coverage by Format chart displays distinct license counts by component package format. Each bar separates licenses declared through Lifecycle data from additional license coverage observed through ALP.
Use the chart to identify formats where observed analysis expands the license information available for legal review. The Other category groups formats that are not displayed separately.
When ALP data is available, the companion tile summarizes the additional observed licenses identified by ALP. When no ALP data is available for the selected filters, the tile displays No ALP data Available.

Legal Obligations Fulfilled
The Legal Obligations Fulfilled tile displays the number of legal obligations recorded as fulfilled for the selected dashboard scope.
This metric summarizes ALP legal-review activity. Use the existing Legal Obligations pages to review obligation details or update their status. For instructions, see Using the Advanced Legal Pack.
Attribution Reports Generated
The Attribution Reports Generated tile displays the recorded number of attribution reports generated through Sonatype Lifecycle.
The tile summarizes report-generation activity. Continue to use the existing ALP workflow to create, customize, or review attribution reports.
Note
Data for this tile is recorded when a user selects Create Attribution Report from Legal in Sonatype Lifecycle. Opening the Legal page without generating an attribution report does not add to this metric.
Unique Applications Evaluated
The Unique Applications Evaluated tile displays the number of distinct applications represented in the legal data for the selected dashboard scope.
Use this metric to understand the breadth of application coverage behind the dashboard’s ALP legal-obligation, evidence, and attribution-report metrics.
Total ALP Licenses
The Total ALP Licenses tile displays the number of distinct licenses represented in Advanced Legal Pack (ALP) data for the selected dashboard filters.
Use this tile with License Coverage by Format to understand the total ALP license count and how that coverage is distributed across package formats.
Legal Evidence Collected

The Legal evidence collected section summarizes the legal evidence available across evaluated components for the selected dashboard filters. Advanced Legal Pack (ALP) collects legal data that can be used when reviewing license obligations and preparing attribution reports.
The section includes:
Copyright Statements: Displays the number of unique copyright statements identified across evaluated components.
License Files: Displays the number of unique license files identified across evaluated components.
Notice Files: Displays the number of unique notice files identified across evaluated components.
Source-Code Links: Displays the number of source links available for evaluated components.
These tiles indicate the amount of evidence available. Use the existing ALP legal views to examine evidence associated with a specific application, component, or license.
You can review the underlying legal information for a component on the Component License Details page, where you can review license obligations and manage copyright statements, notice texts, license texts, and attributions.
For more information about reviewing and managing this information, see Advanced Legal Pack Quickstart.
Legal Threats by Waiver Reason
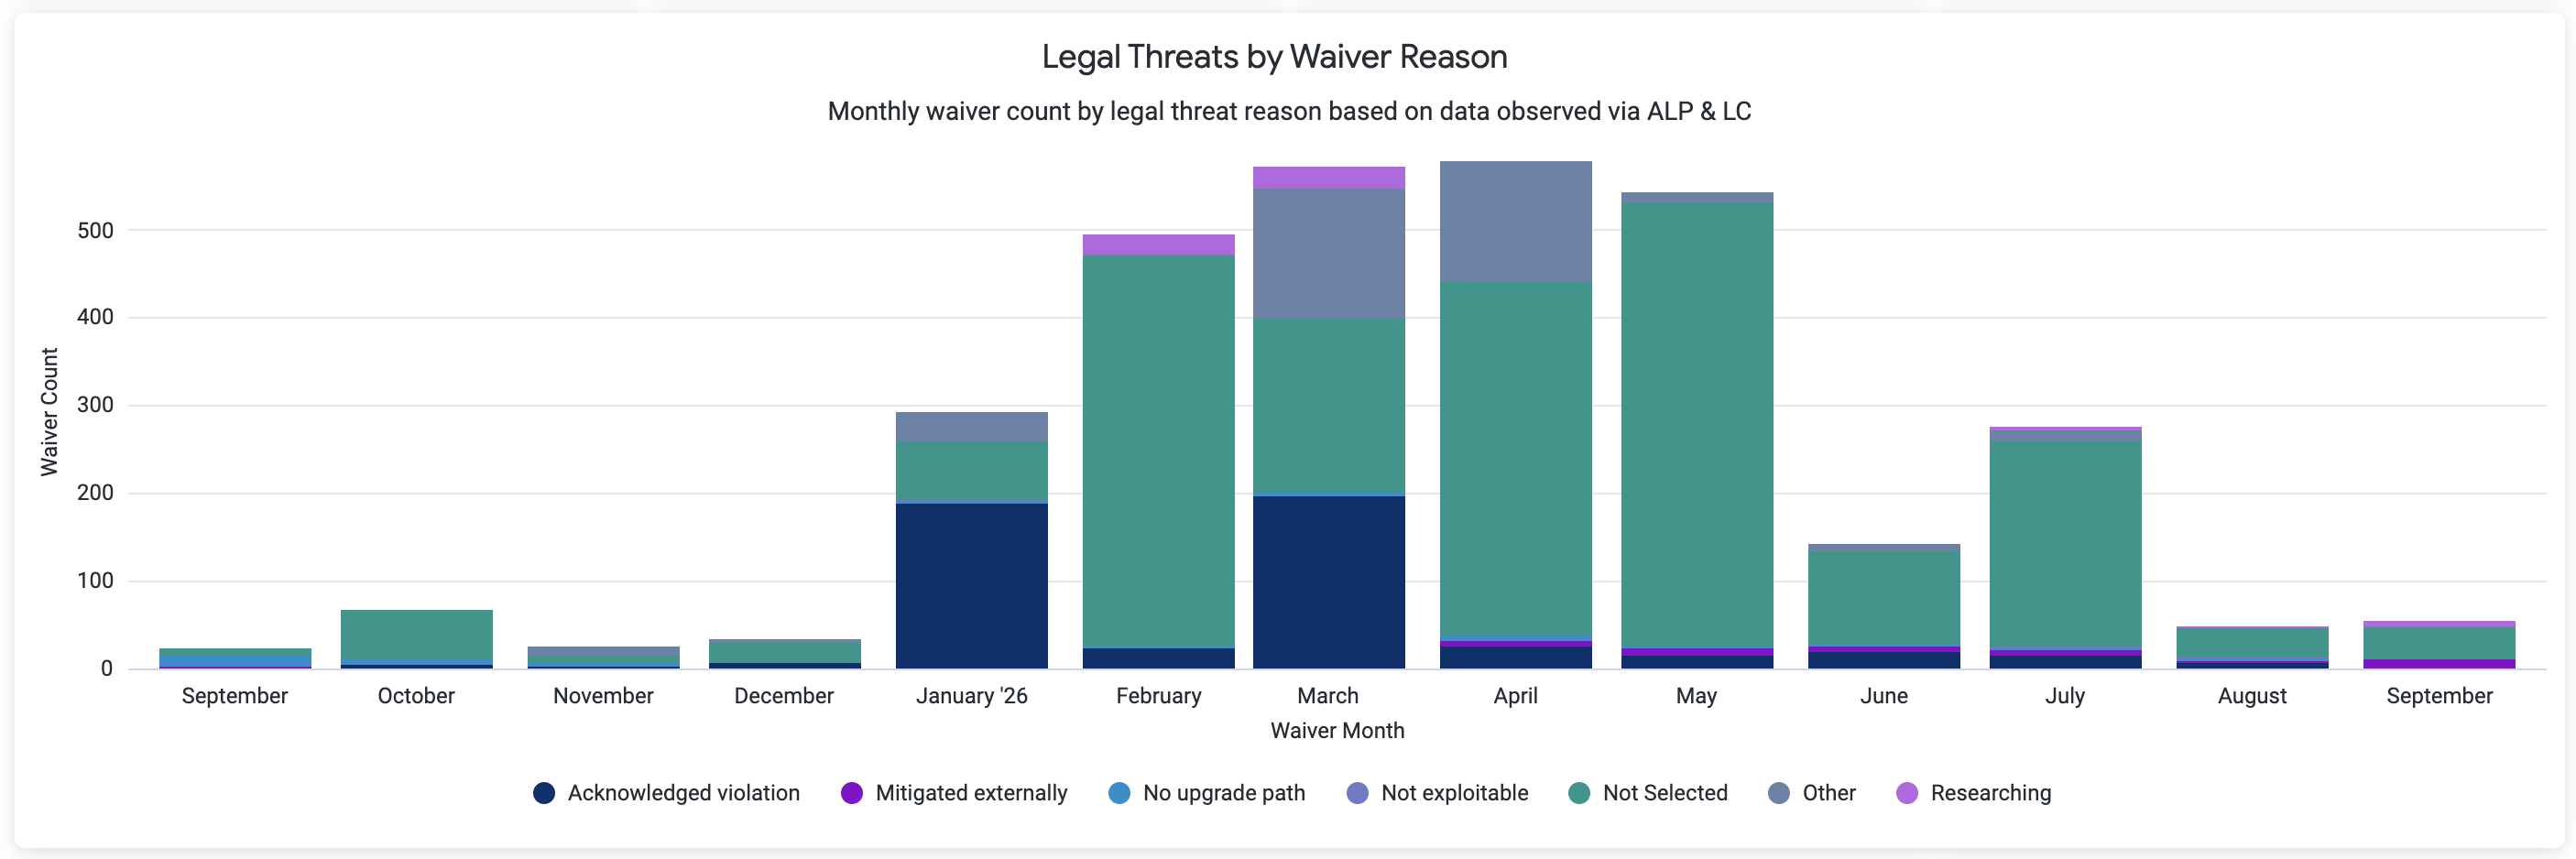
The Legal Threats by Waiver Reason chart displays distinct monthly waiver counts grouped by waiver reason. It includes waivers associated with the Lifecycle and ALP legal-risk data available for the selected filters.
For this chart, the Date Range filter applies to the date on which the violation was waived.
Only waiver reasons represented in the selected data appear in the chart. Not Selected identifies waivers for which no reason was recorded. For definitions of the available reasons, see Waiver Reasons.
Use this chart to:
Identify changes in legal-waiver volume over time.
Understand the most frequently selected reasons for accepting or mitigating legal risk.
Investigate increases in waivers for reasons such as no upgrade path, external mitigation, or ongoing research.
Legal Violation Severity Over Time
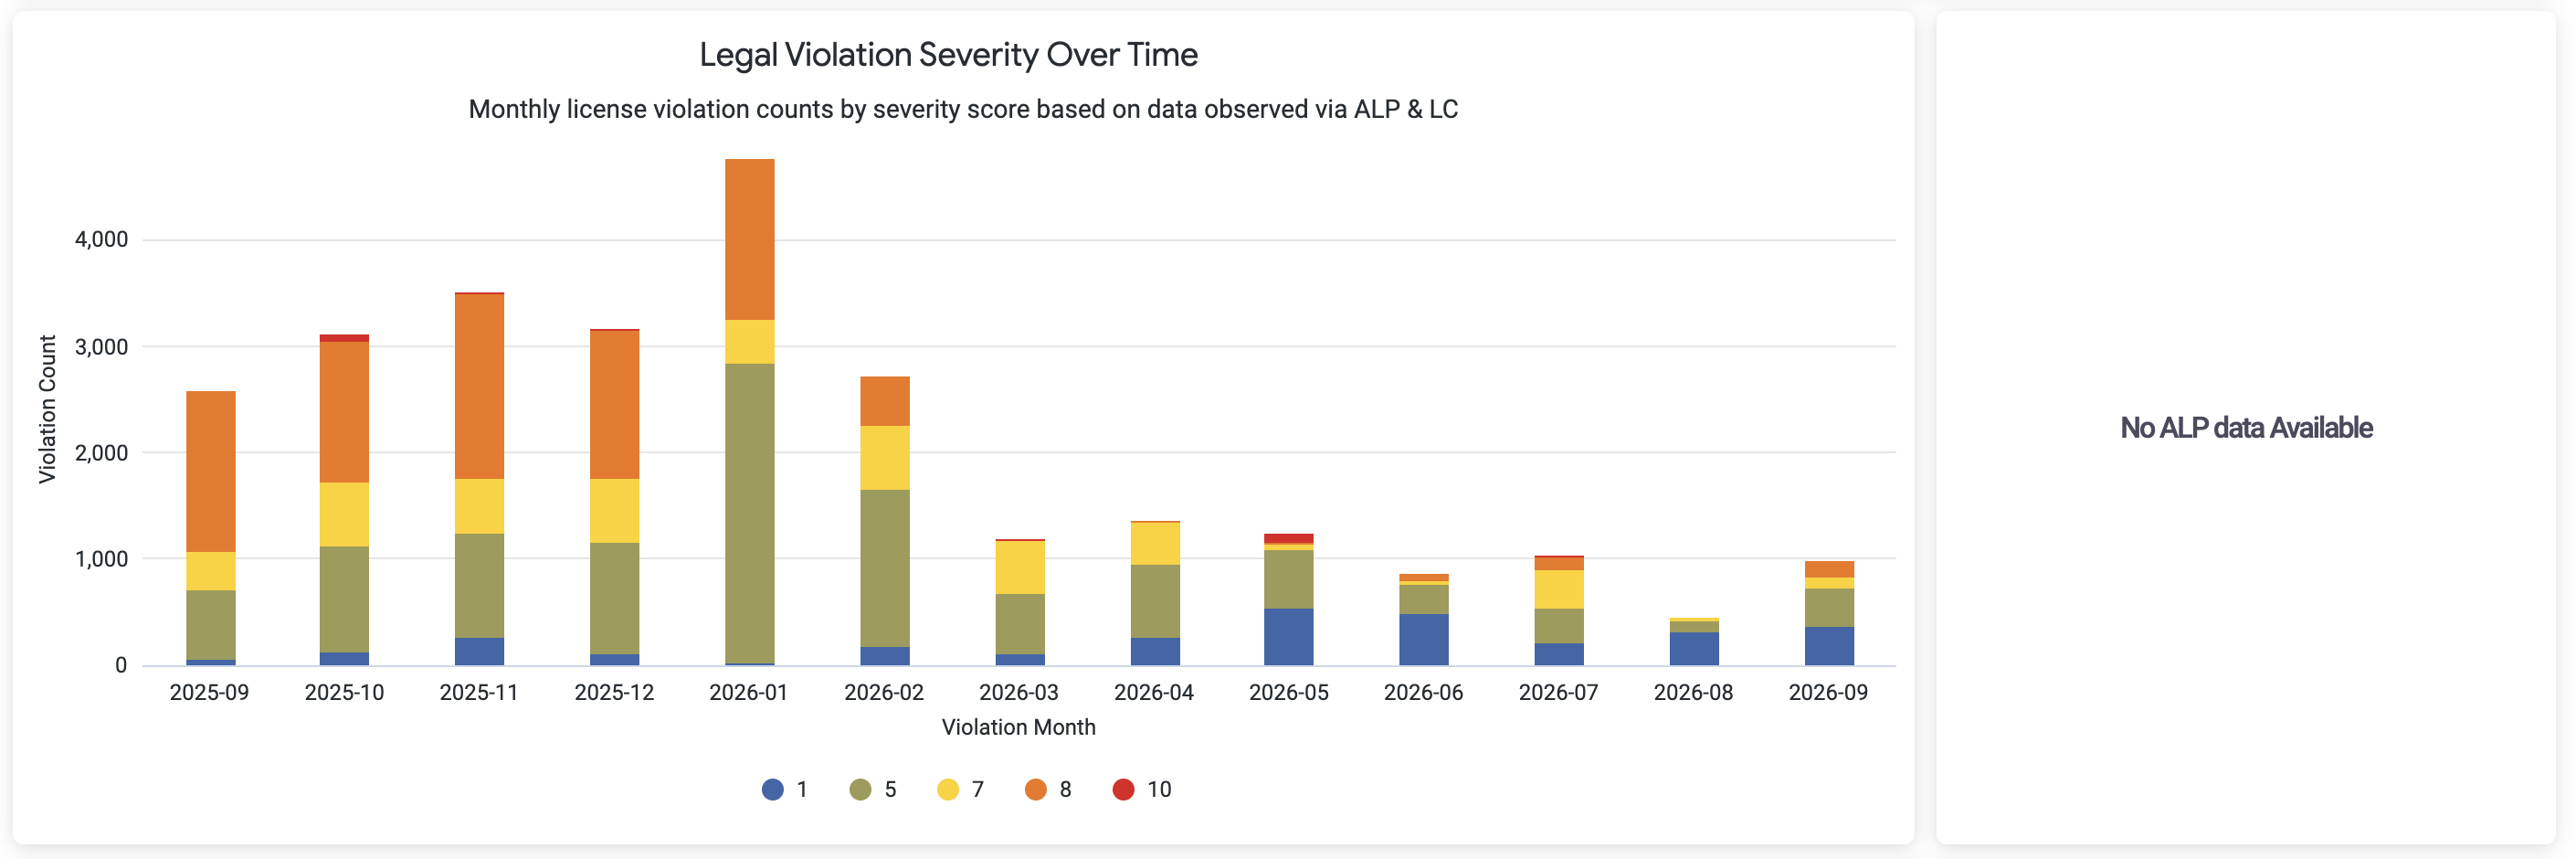
The Legal Violation Severity Over Time chart displays distinct license policy violations by the month in which they were opened. It includes violations associated with the Lifecycle and ALP legal-risk data available for the selected filters. Each monthly column is grouped by policy threat level.
For this chart, the Date Range filter applies to the violation open date.
Use the chart to identify changes in both violation volume and severity. Higher policy threat levels indicate findings that require greater attention according to your organization’s policy configuration.
When ALP data is available, the companion tile summarizes the percentage of observed ALP violations at policy threat levels 8 through 10. When no ALP data is available for the selected filters, the tile displays No ALP data Available.
Legal Risk Summary
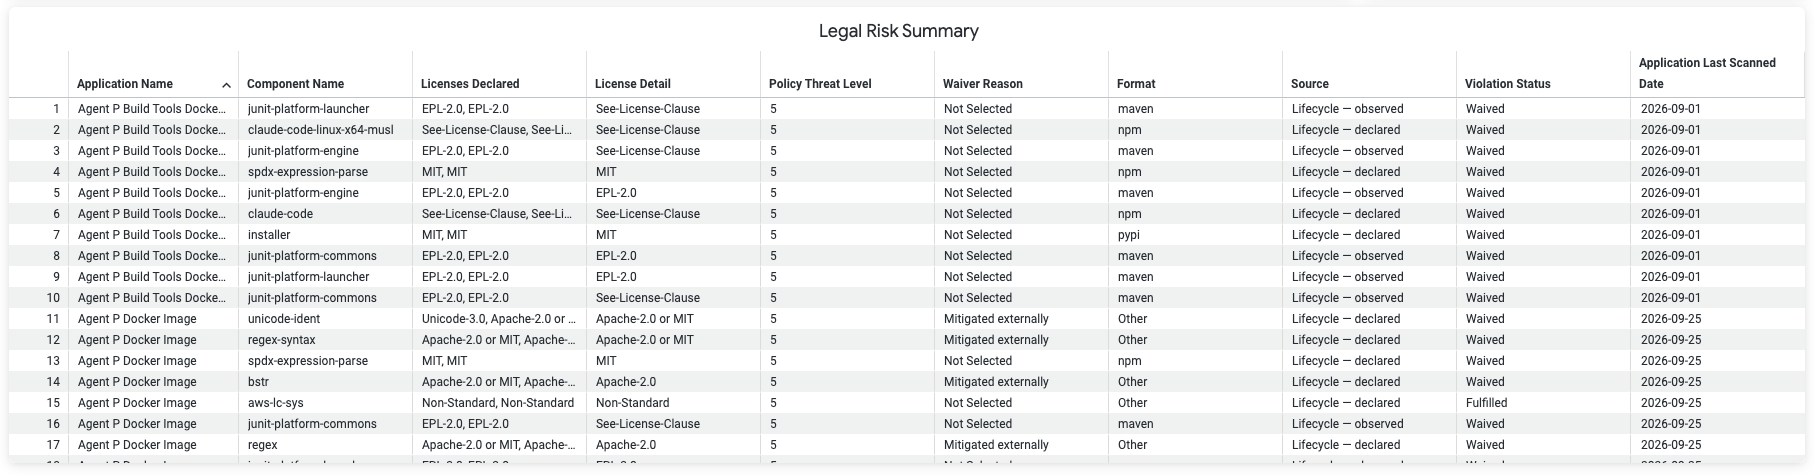
The Legal Risk Summary table provides application- and component-level details for the findings represented in the dashboard. Use the table to connect summary metrics and chart trends to the underlying legal-risk data.
The table includes:
Application Name: The application containing the component.
Component Name: The component associated with the license finding.
Licenses Declared: The license or licenses declared in the component metadata.
License Detail: The license or license combination associated with the table row.
Policy Threat Level: The policy threat level assigned to the violation.
Waiver Reason: The reason recorded for a waived violation, when available.
Format: The component package format.
Source: Whether the license finding is based on declared or observed license data.
Violation Status: The current status of the policy violation.
Application Last Scanned Date: The date on which the application was most recently scanned.
Note
The table displays up to 5,000 rows. Use the dashboard filters to narrow the results before reviewing or exporting the table data.
Troubleshooting
Problem
Clicking on the browser Refresh button may give you the following error:

Solution
Click the Back button on your browser, from the page where you see this error, to go back to the Landing page Enterprise Reporting. Select the dashboard you want to view, to reload the visualizations.
To refresh the page, click on the refresh icon on the top right, instead of the Refresh button on your browser.

Problem
No data visible on the dashboard or any other issues with the dashboard.
Solution
Click on Copy to Support Info to Clipboard button and contact support with this information.