Sonatype Advanced Vulnerability Intelligence
About the Data
Refresh rate: Updated daily at around 09:30 AM UTC. New scan and violation data can take up to 24–36 hours to appear.
Minimum Requirements: Applications must be scanned at least once. You should be using version 205 or higher.
Note
For self-hosted deployments running IQ Server 204, Sonatype Advanced Vulnerability Intelligence data is available through the Supply Chain Monitoring Enterprise Report. A dedicated Sonatype Advanced Vulnerability Intelligence dashboard card will be available in IQ Server 205. After upgrading to IQ Server 205, both the Supply Chain Monitoring and Sonatype Advanced Vulnerability Intelligence dashboards will be available and will display their respective data.
Overview
The Sonatype Advanced Vulnerability Intelligence dashboard helps you identify components in your applications that may be affected by privately disclosed vulnerabilities that have not yet been assigned a CVE identifier.
The dashboard provides a complete component inventory for evaluated applications and identifies component version information, published dates, newer available versions, recommended Golden Fix versions, End-of-Life status, and Mythos affected components when available.
Use the dashboard filters, summary cards, charts, and component inventory table to review components across applications, evaluation stages, component names, component versions, formats, and Mythos affected status.
The Sonatype Advanced Vulnerability Intelligence dashboard provides:
Component inventory across unique applications
Current and latest component version details
Golden Fix version recommendations
Evaluation stage visibility
Application-level component readiness review
Component End-of-Life status
Mythos affected component visibility
Component distribution by package format
Get to Know Your Sonatype Advanced Vulnerability Intelligence Dashboard
Use the available filters, summary cards, charts, and component inventory table to review evaluated components and readiness information across unique applications.

The selected filters are applied across all dashboard visualizations and the Component Inventory table.
Use the available filters to narrow dashboard results by application, component name, component version, evaluation stage, format, Mythos affected status, and selected date range.
You can filter the dashboard using the following options:
Date Range: Defaults to on or after 12 months ago. You can adjust this to a custom period.
Organization: Select one or more customer organizations.
Sub Orgs: Select one or more sub orgs beneath the chosen organization. When a parent organization is selected, the sub orgs list is limited to that branch’s descendant organizations.
Application: Filter by one or more applications.
Component Name: Filter by one or more component names.
Component Version: Filter by a specific component version.
Stage: Filter by evaluation stage. The build stage is selected by default.
Format: Filter by package format, such as maven, npm, container, pypi, composer, swift, pecoff, or golang.
Mythos Affected: Filter results based on whether components are marked as affected by Mythos. Available options are Yes and No.
Downloading Dashboard and Table Data
You can download dashboard and table data using the dashboard export options.
For instructions on exporting dashboards, tables, and scheduling deliveries, see Exporting Dashboards and Table Data .
Dashboard Summary

The dashboard summary cards provide a high-level view of application and component readiness within the selected filter scope.
The summary cards include the following:
Total Applications - Number of unique applications evaluated within the selected filter scope.
Total Components - Number of components evaluated within the selected filter scope.
Golden Fixes Available - Number of components with a recommended Golden Version.
Reached End of Life - Number of components that have passed their EOL date.
Mythos Affected - Indicates whether Sonatype’s proprietary research has identified a non-public vulnerability, without an associated CVE, in the specified component version. Yes indicates a vulnerability was identified; No indicates none was identified.
Use these summary cards to quickly understand the overall scope of evaluated applications, component inventory, Golden Fix availability, End-of-Life exposure, and Mythos affected components.
Components by Format
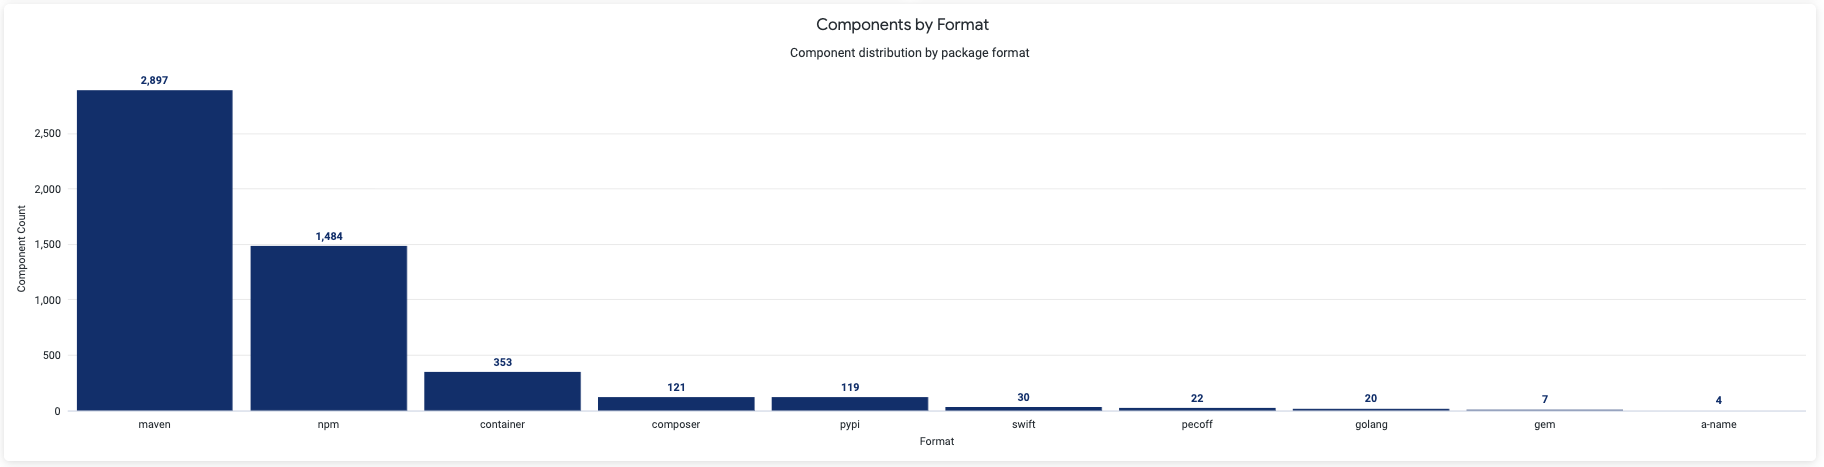
The Components by Format chart shows component distribution by package format.
The chart displays the component count for each package format, such as maven, npm, container, composer, pypi, swift, pecoff, golang, gem, or a-name.
Use this chart to understand where your component inventory is concentrated by package ecosystem.
Component End-of-Life Status
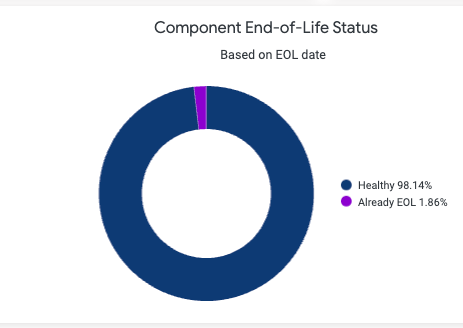
The Component End-of-Life Status chart shows unique component counts by EOL status within the selected filter scope.
The chart includes the following categories:
Healthy - Unique components that are still within their supported lifecycle and have not reached End-of-Life.
Already EOL - Unique components with EOL data indicating that the component has passed its End-of-Life date.
Use this chart to review End-of-Life exposure across the selected filter scope.
Component Inventory
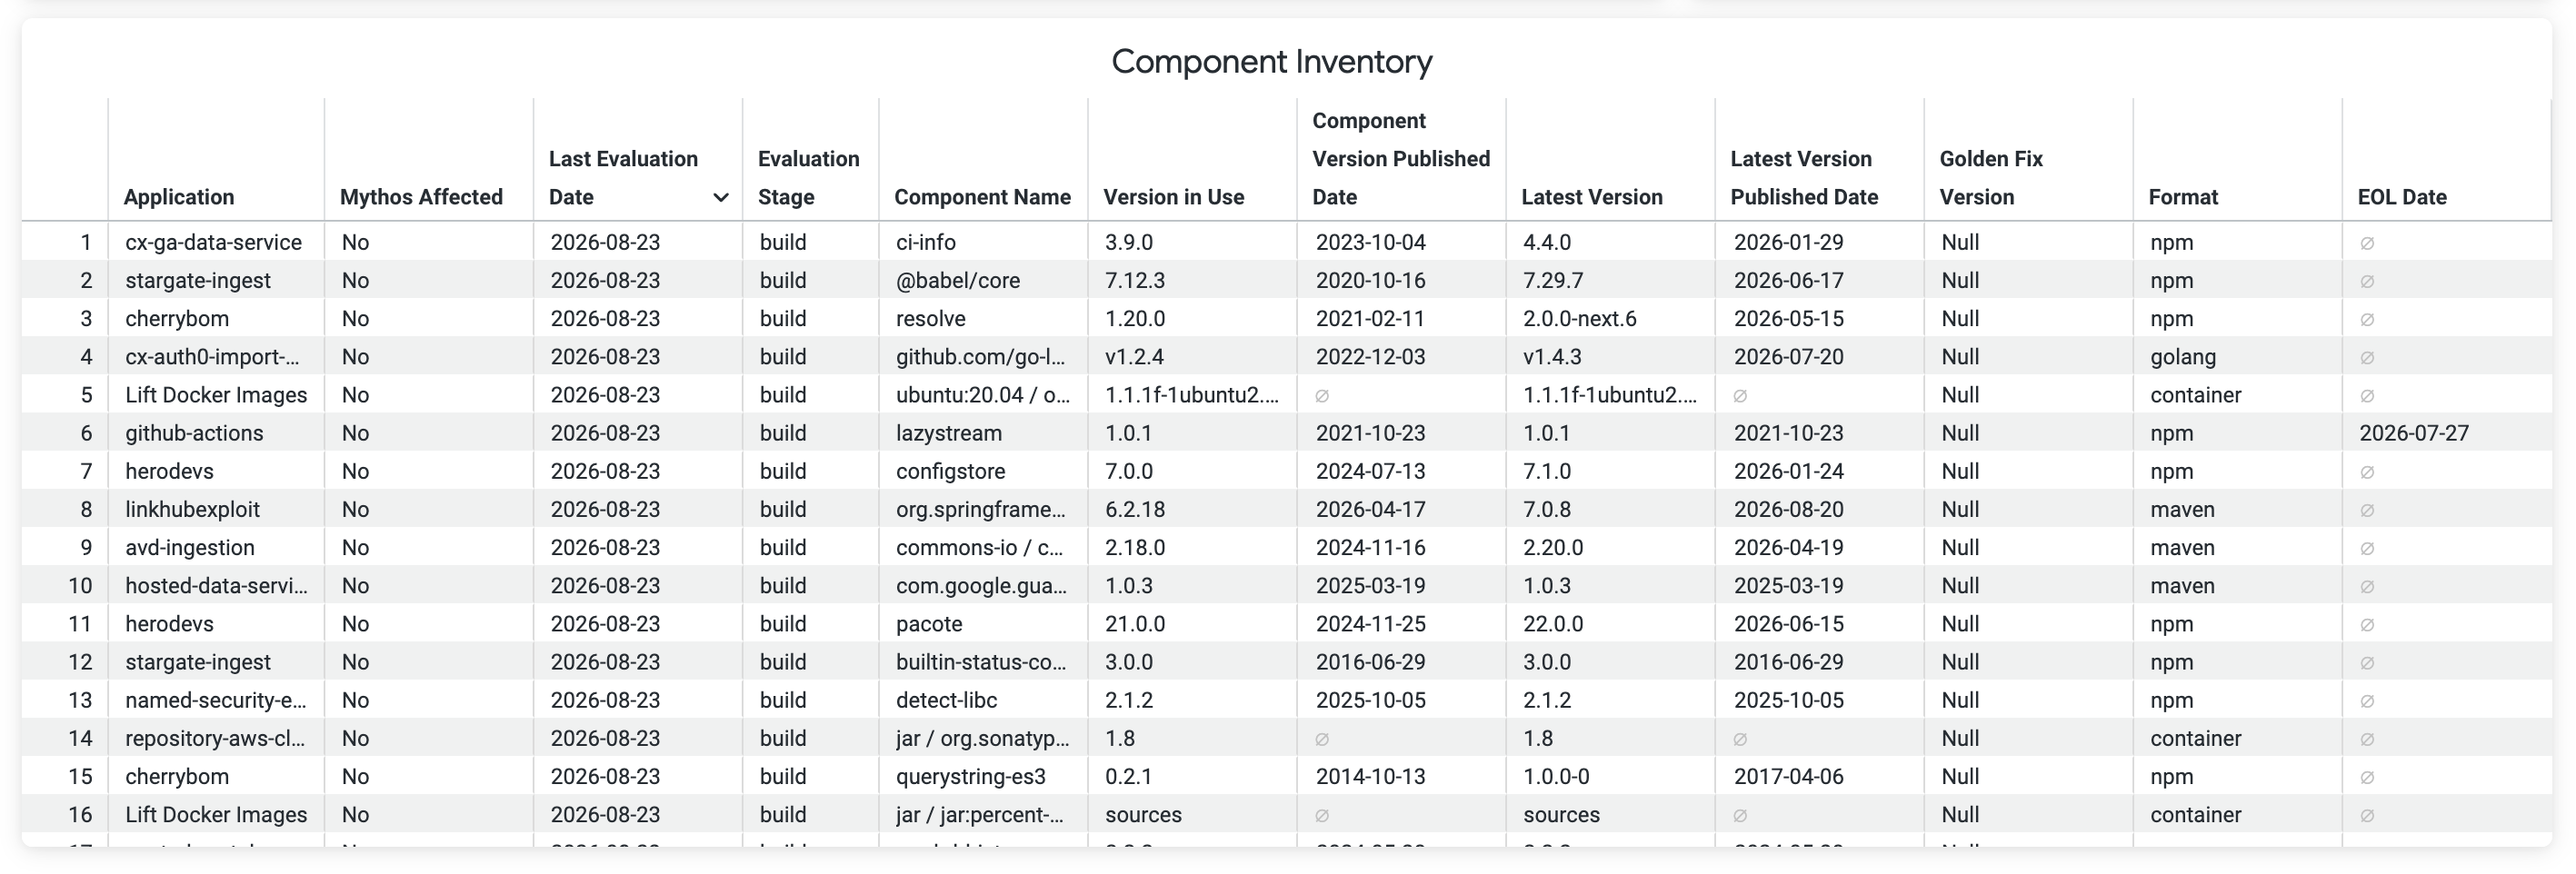
The Component Inventory table displays evaluated components and readiness information across unique applications within the selected filter range.
Use the table to compare deployed component versions with the latest available versions and available Golden Fix versions, and to identify components marked as Mythos Affected.
The table includes the following:
Application - Name of the application containing the component.
Mythos Affected - Indicates whether Sonatype’s proprietary research has identified a non-public vulnerability, without an associated CVE, in the specified component version. Yes indicates a vulnerability was identified; No indicates none was identified.
Last Evaluation Date - Most recent date the component was evaluated.
Evaluation Stage - Evaluation stage associated with the component evaluation.
Component Name - Name of the evaluated component.
Version in Use - Version of the component identified in the application.
Component Version Published Date - Published date of the component version identified in the application.
Latest Version - Most recently available version identified for the component.
Latest Version Published Date - Published date of the latest available component version.
Golden Fix Version - Recommended component version identified for remediation or upgrade guidance when available.
Format - Open source package ecosystem the component belongs to, such as maven, npm, pypi, or golang.
EOL Date - Date the component was identified as End-of-Life, meaning it is no longer maintained or receiving security patches. An empty value means the component is considered actively supported.
Note
Latest Version, Latest Version Published Date, Golden Fix Version, and EOL Date values may not be available for all components.
Troubleshooting
Problem
Clicking on the browser Refresh button may give you the following error:

Solution
Click the Back button on your browser, from the page where you see this error, to go back to the Landing page Enterprise Reporting. Select the dashboard you want to view, to reload the visualizations.
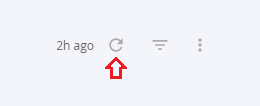
To refresh the page, click on the refresh icon on the top right, instead of the Refresh button on your browser.
Problem
No data visible on the dashboard or any other issues with the dashboard.
Solution
Click on Copy to Support Info to Clipboard button and contact support with this information.