Best Practices
About the Data
Data Refresh Frequency: Updated daily at around 14:15 UTC. New scan data can take up to 24 hours to appear.
Displays Data for: Lifecycle feature enablement, integration adoption, and scan activity across applications and stages within the selected filters.
Minimum Requirements: Applications must be scanned at least once. The dashboard reflects data only for applications that meet this requirement. You should be using version 202 or higher.
Overview
The Best Practices Dashboard provides visibility into how your organization is adopting Sonatype Lifecycle features and best practices across applications and stages.
The dashboard highlights feature enablement, integration coverage, scan activity, and projected time savings to help teams identify gaps and improve consistency across their DevSecOps workflows.
By reviewing this dashboard, you can understand whether applications are properly integrated, whether key capabilities are enabled, whether scans are being performed across stages, and where automated Lifecycle features are contributing projected time savings.
The Best Practices Dashboard displays the following sections:
Downloading Dashboard and Table Data
You can download dashboard and table data using the dashboard export options.
For instructions on exporting dashboards, tables, and scheduling deliveries, see Exporting Dashboards and Table Data .
Get to Know Your Best Practices Dashboard
The interactive Best Practices Dashboard provides multiple filter options to help you analyze Lifecycle feature adoption and configuration across your organization.
You can use this dashboard to explore how applications are onboarded, how integrations are configured, how scan activity is distributed across Lifecycle stages, and how projected time savings are calculated for supported automated actions.
By adjusting filters, you can focus on specific organizations, sub-organizations, applications, or stages to identify gaps in adoption, inconsistencies in configuration, or areas where Lifecycle capabilities are not fully utilized.
You can filter the dashboard using the following options:
Date Range: Defaults to a relative time selection. Adjustable to custom or predefined time periods (for example, on or after 12 months ago).
Organization: Select one or more organizations.
Sub Org: Filter by sub-organizations within an organization.
Application: Select specific applications.
App Category: Filter by application category.
Violation Type: Filter by violation type.
Stage: Filter applications by stage. Available stages may include, build, compliance, operate, proxy, release, source and stage-release.
SCM Integration: Filter applications based on whether SCM integration is enabled.
PR Commenting: Filter applications based on pull request commenting configuration.
Golden PRs: Filter applications based on Golden PR enablement.
Reachability Analysis: Filter applications based on reachability analysis availability.
Use these filters to narrow the dashboard view and focus on specific areas of Lifecycle adoption.

Note
When you select an Organization, only the corresponding Sub Org and Application values under that organization are available for selection. If a selected Sub Org does not contain data, the data from the parent Organization is displayed within the Sub Org scope.
Refresh After Filter
Do not forget to refresh the page after changing filter options. Use the dashboard refresh icon instead of the browser refresh.
Status

The Status section provides a high-level view of whether key Lifecycle capabilities are enabled in the selected scope.
The section displays the following tiles:
Continuous Monitoring - Lifecycle automatically rescans the application’s default branch on a recurring schedule to detect newly disclosed vulnerabilities.
Automatic Application Creation - Lifecycle automatically discovers and registers new applications during source control onboarding, controlled by the
AUTOMATIC_APPLICATION_CREATIONfeature flag.Automatic SCM Configuration - Lifecycle automatically links newly onboarded applications to their source control repository and configures branch monitoring.
Golden PRs - Applications with automated pull request activity (for example, at least one PR comment generated by IQ).
Auto-Waivers - Preconfigured rules automatically waive qualifying policy violations across the organization.
Each tile shows either On or Off.
The status indicates whether the capability is enabled within the selected scope. If at least one organization or application in the selected scope has the capability enabled, the tile displays On.
For example, if multiple organizations are selected and only some of them have Golden PRs enabled, the tile still displays On, indicating that the feature is enabled within the selected scope.
How Do I Turn This On?
The Status section highlights whether key Lifecycle capabilities are enabled in your environment. If a capability is shown as Off, you can enable it by configuring the corresponding feature in Sonatype Lifecycle.
Refer to the following documentation for steps to enable each capability:
Integration Details
The Integration Details section provides visibility into Golden PR adoption, CI/CD integration, and application-level integration status.
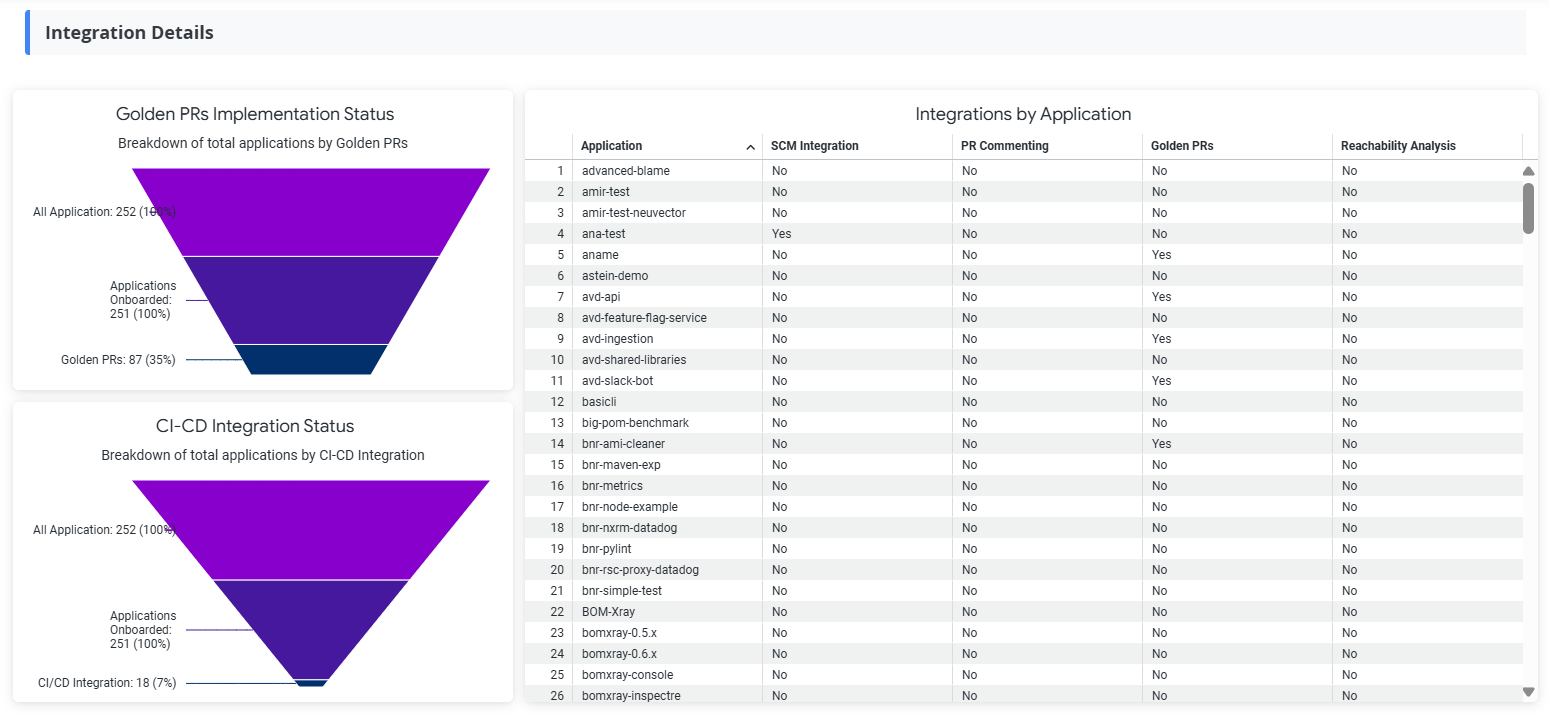
Golden PRs Implementation Status
The Golden PRs Implementation Status chart shows a breakdown of total applications by Golden PR adoption.
It displays the following:
All Applications - Total number of registered applications in the organization.
Applications Onboarded - Applications that have been scanned at least once.
Golden PRs - Applications with automated pull request activity (for example, at least one PR comment generated by IQ).
This chart highlights how many applications have enabled Golden PR's.
CI-CD Integration Status
The CI-CD Integration Status chart shows a breakdown of total applications by CI/CD integration.
It displays the following:
All Applications - Total number of registered applications in the organization.
Applications Onboarded - Applications that have been scanned at least once.
CI/CD Integration - The application has been scanned at the build stage, confirming that Lifecycle is integrated into the CI/CD pipeline.
This chart highlights how many applications are integrated into CI/CD workflows.
For example, if many applications are onboarded but only a smaller portion have CI/CD integration enabled, it may indicate that automation is not fully implemented across the environment.
Integrations by Application
The Integrations by Application table provides application-level visibility into key Lifecycle integrations.
The table includes the following fields:
Application - Individual applications within the selected organization and filter scope.
SCM Integration - Applications with a source control repository connected.
PR Commenting - Applications with pull request commenting enabled.
Golden PRs - Applications with automated pull request activity (for example, at least one PR comment generated by IQ).
Reachability Analysis - Applications with reachability analysis available.
Each row shows whether the listed capability is enabled for that application.
For example, an application with “No” across multiple columns may not be fully utilizing Lifecycle capabilities and may require additional configuration.
Scan Details
The Scan Details section provides scan coverage and scan status information across applications and stages.
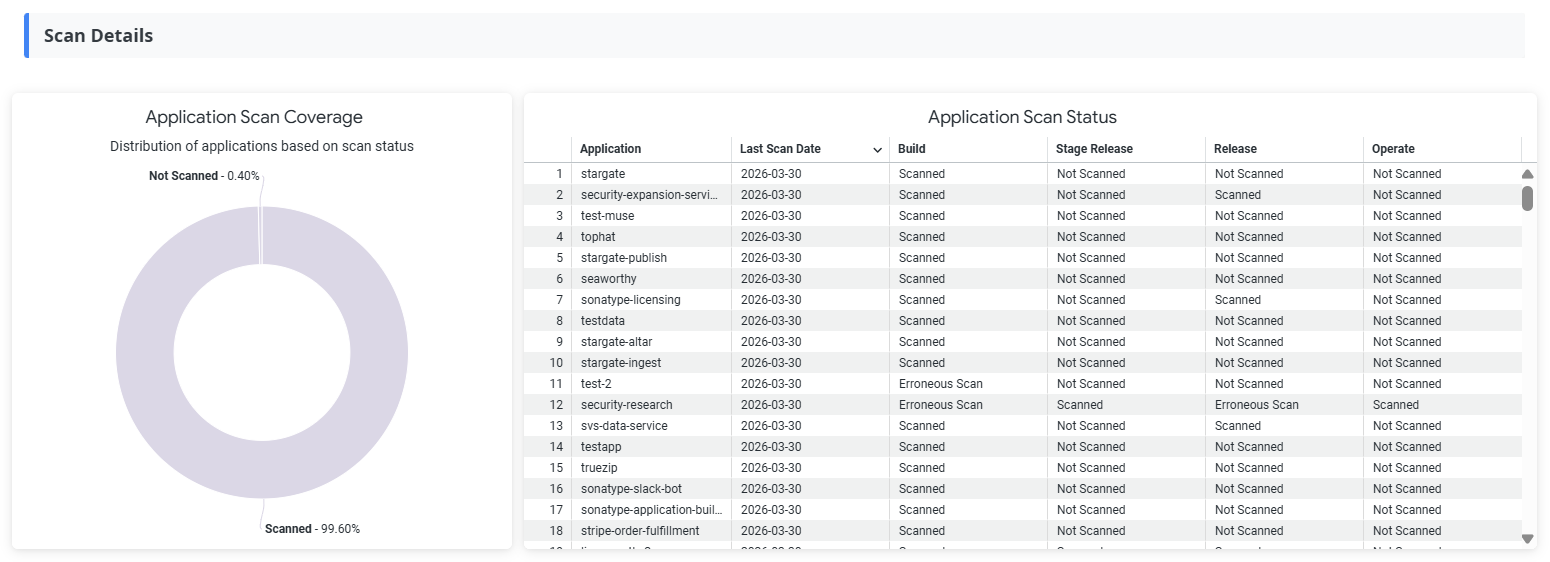
Application Scan Coverage
The Application Scan Coverage chart displays the distribution of applications based on scan status.
The chart shows the following:
Scanned - Applications whose latest scan returned more than one component, indicating a successful scan.
Not Scanned - Applications that have never been scanned.
This chart provides a quick view of scan coverage across the selected scope.
For example, a higher percentage of “Not Scanned” applications indicates that some applications are not being evaluated and may not be covered by policy enforcement.
Application Scan Status
The Application Scan Status table provides detailed information about scan activity by application and stage.
The table includes the following fields:
Application - The application included in the selected dashboard filter scope.
Last Scan Date - The most recent scan date available for the application.
Build - Scan status for the application in the Build stage.
Stage Release - Scan status for the application in the Stage Release stage.
Release - Scan status for the application in the Release stage.
Operate - Scan status for the application in the Operate stage.
Each stage column displays the scan status for that application.
Examples of status values include:
Scanned - Applications whose latest scan returned more than one component, indicating a successful scan.
Not Scanned - Applications that have never been scanned.
Erroneous Scan - Applications whose scan ran but returned zero or one component, which may indicate a misconfigured application, empty repository, or broken integration.
For example, if an application is marked as “Not Scanned” in the Build stage but scanned in later stages, it may indicate that early-stage (shift-left) scanning is not configured.
Note
Cross filtering is enabled between the Integrations by Application and Application Scan Status tables. When you select an application value in either table, the other table is filtered to show data for that application.
Projected Time Savings
The Projected Time Savings section shows the projected developer hours that can be saved by enabling automated features.
Note
Projected hours are calculated using predefined Sonatype formulas. Each tile displays the formula used for that feature. Projected time savings are independent of the Status cards and are calculated using Sonatype-defined fields and logic, regardless of whether a feature is shown as On or Off.
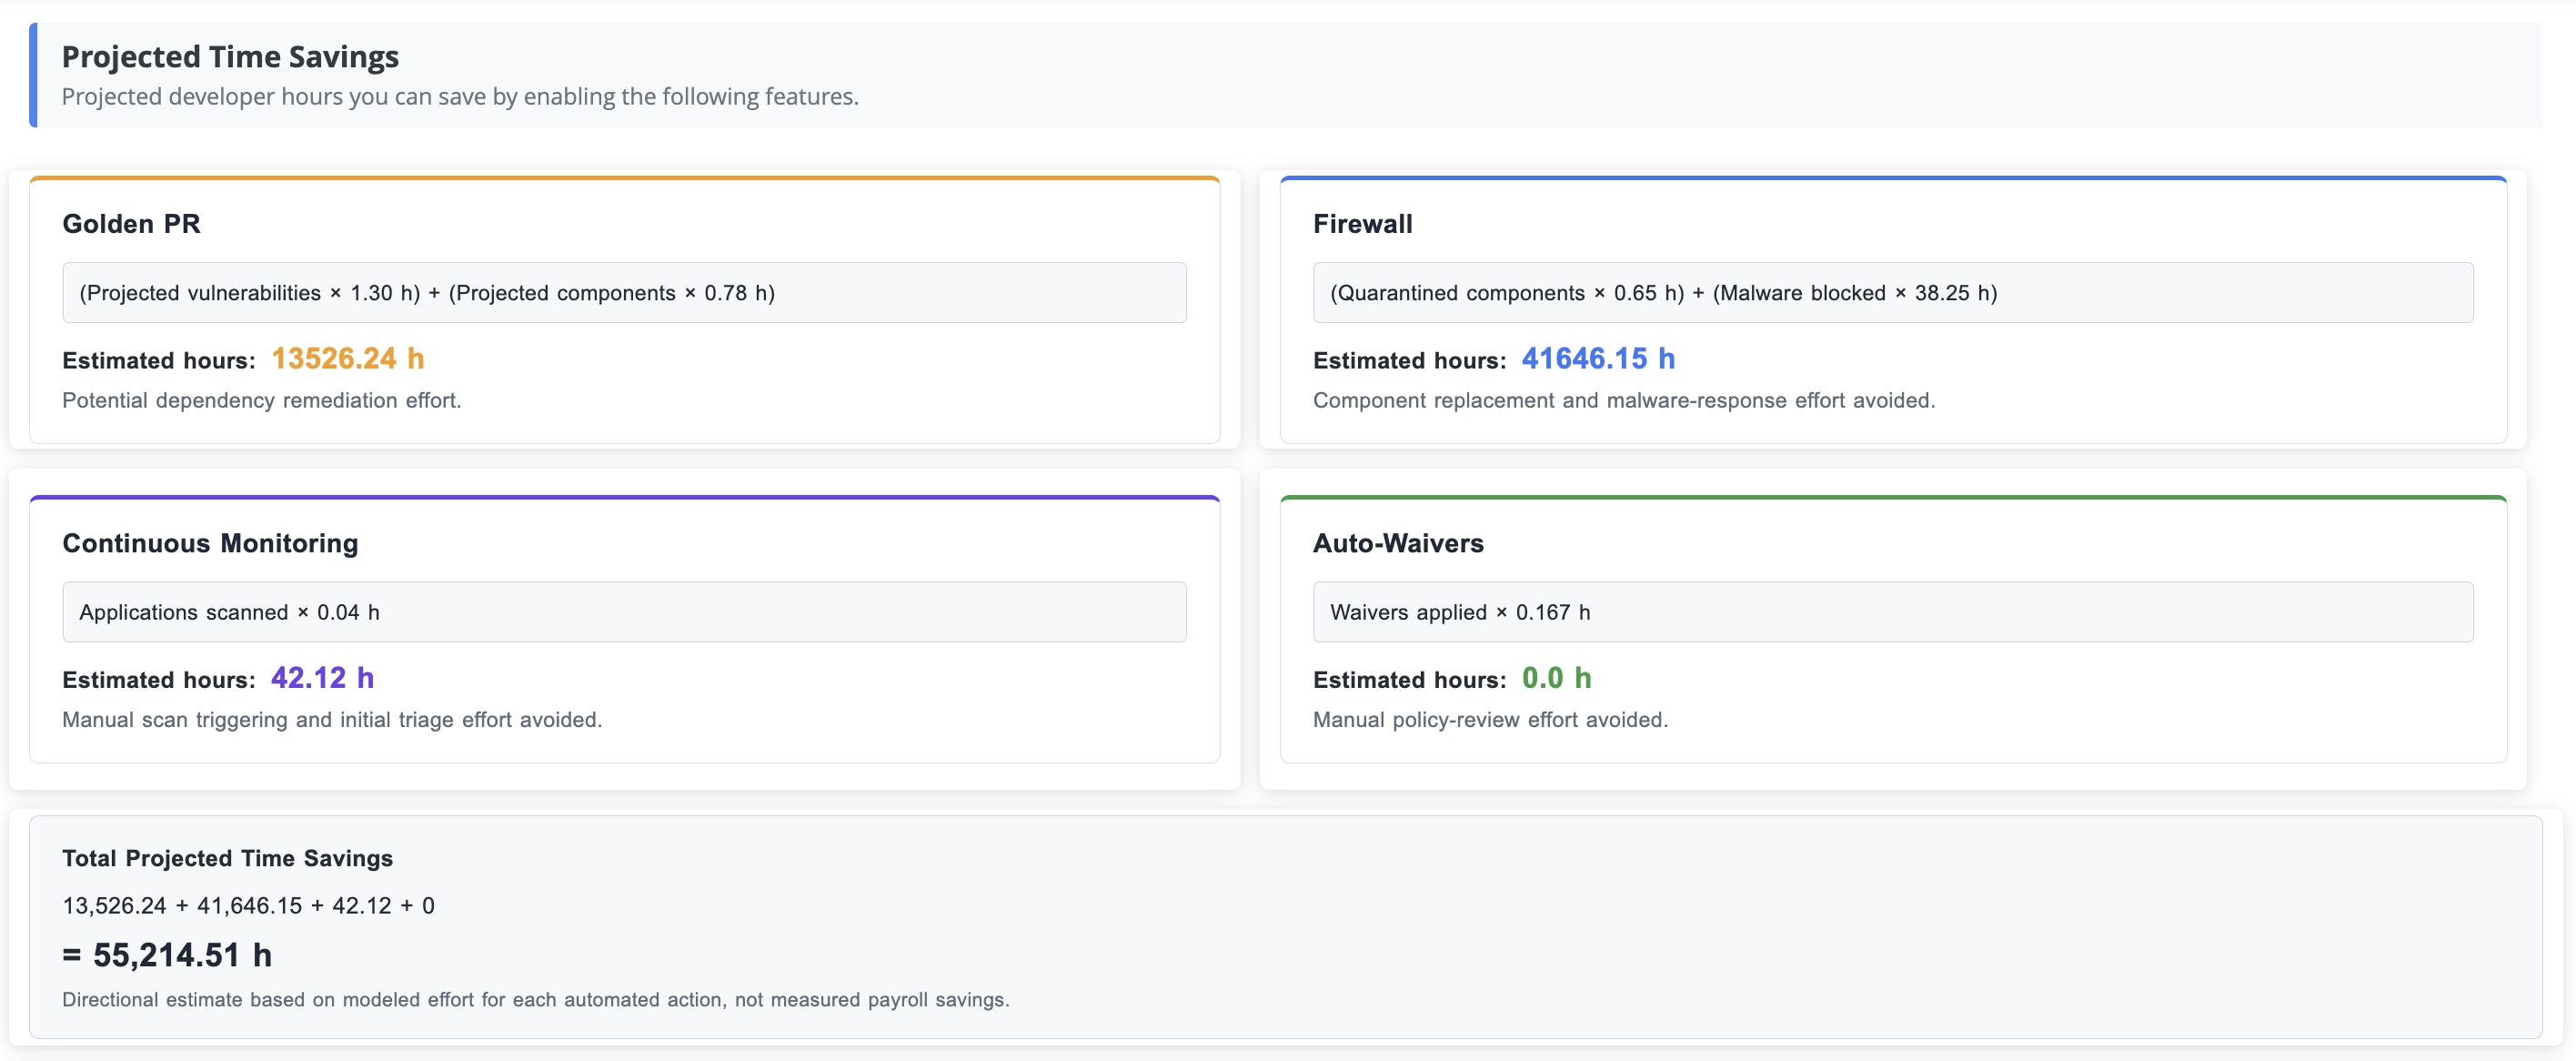
The section displays estimated hours for the following areas:
Golden PR
Firewall
Continuous Monitoring
Auto-Waivers
Total Projected Time Savings
Golden PR
The Golden PR tile shows projected developer hours for potential dependency remediation effort.
The calculation is: (Projected vulnerabilities × 1.30 h) + (Projected components × 0.78 h)
Firewall
The Firewall tile shows projected developer hours for component replacement and malware-response effort avoided.
The calculation is: (Quarantined components × 0.65 h) + (Malware blocked × 38.25 h)
Continuous Monitoring
The Continuous Monitoring tile shows projected developer hours for manual scan triggering and initial triage effort avoided.
The calculation is: CM applications scanned × 0.04 h
Auto-Waivers
The Auto-Waivers tile shows projected developer hours for manual policy-review effort avoided.
The calculation is: Waivers applied × 0.167 h
Total Projected Time Savings
The Total Projected Time Savings tile combines the projected hours from Golden PR, Firewall, Continuous Monitoring, and Auto-Waivers.
The calculation is: Golden PR projected hours + Firewall projected hours + Continuous Monitoring projected hours + Auto-Waivers projected hours
Note
Projected Time Savings is a directional estimate based on modeled effort for each automated action, not measured payroll savings.
Application level breakdown of ROI
The Application level breakdown of Return on Investment (ROI) table provides application-level projected time savings.
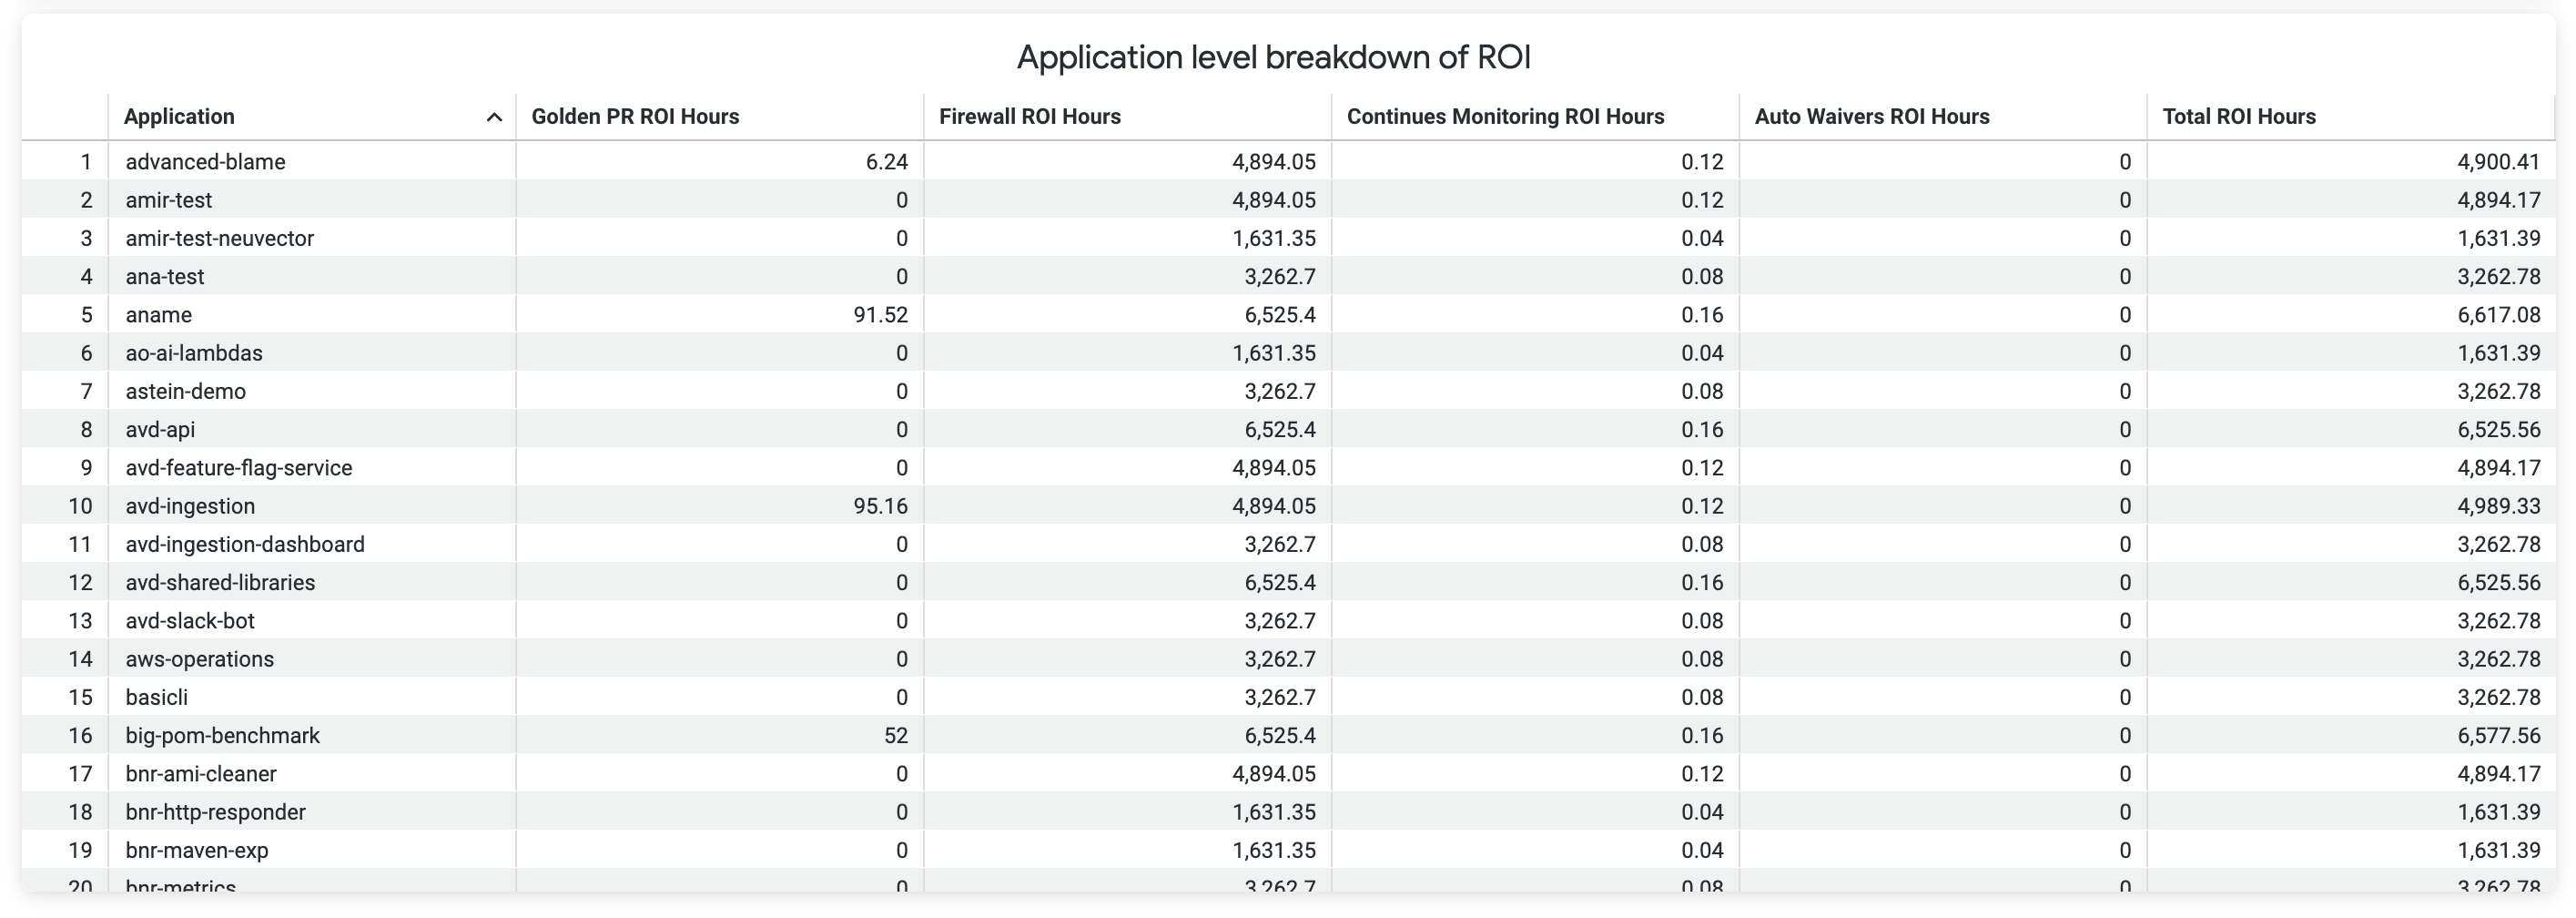
The table includes the following fields:
Application - The application included in the selected dashboard filter scope.
Golden PR ROI Hours - Projected time savings attributed to projected Golden PR dependency remediation for the application.
Firewall ROI Hours - Projected time savings attributed to component replacement and malware-response effort avoided for the application.
Continues Monitoring ROI Hours - Projected time savings attributed to manual scan triggering and initial triage effort avoided for the application.
Auto Waivers ROI Hours - Projected time savings attributed to manual policy-review effort avoided for the application.
Total ROI Hours - Combined Projected time savings from Golden PR, Firewall, Continuous Monitoring, and Auto-Waivers for the application.
Each row shows the estimated ROI hours for the listed application within the selected dashboard filters.
The Total ROI Hours column shows the combined estimated hours from Golden PR, Firewall, Continuous Monitoring, and Auto-Waivers for that application.