Enterprise Reporting
Enterprise Reporting is your one-stop access to understand your organization’s repository risk exposure, protection coverage, and factors affecting the overall security posture of your software supply chain. It summarizes how Sonatype Firewall impacts the security profile of repositories and artifact consumption across your organization.
Note
We have implemented the dashboards using the Looker™ platform for versatility. The visualizations will continue to evolve in functionality or scope, based on future improvements and user feedback.
Data Handling Processes for Enterprise Reporting
To address the concerns due to data processing with our third-party reporting tool, Looker™, we have implemented a 4-way protection methodology:
Data Storage:
No data is stored in any third-party tool. We use the third-party tooling's streaming capability to receive the query results directly from the Sonatype environment in a dedicated instance. The data is transmitted without being stored.
Data Anonymization:
The information for these visualizations and reports is restricted for an organization and derived from anonymized telemetry generated during Firewall malware evaluation and policy enforcement via Sonatype Data Services.
Data Authentication and Authorization:
To ensure that the data in these visualizations is accessible to authorized users only, the system programmatically creates obfuscated, unique one-way hash identifiers for the user and the organization's instance.
Data Encryption:
We implement encryption for data in flight from the Firewall environment to the third-party reporting tool.
For added security, detailed component-level or repository-level metadata is not exposed beyond what is required to render aggregated dashboard insights.
Advanced Reporting Insights
To provide deeper reporting clarity, additional data is made available to be used for reporting following all encryption and data handling standards. The data element included in the Advanced Reporting Insights is:
Repository Name
Firewall Enterprise Reporting Insights data can be disabled thereby preventing this data from appearing in insights and resulting in a degraded experience.
Flow for Data Request
A user invokes a dashboard from the Enterprise Reporting feature in Sonatype Firewall.
The browser requests a one-time, unique URL for the insight via an internal Firewall API.
Sonatype Firewall invokes the Sonatype Data System API to check for a valid license and account using standard one-way hash algorithms within the Firewall environment.
The Sonatype Data System invokes the Looker™ API to generate the one-time use URL.
Looker™ returns the fully signed and fully formed URL.
The browser renders the URL in the frame in Sonatype Firewall.
Looker™ streams data encrypted from the back-end data systems (Databricks™) to render the report.
Prerequisites
Your browser has no restrictions on accessing “*.looker.com” URLs.
For the Safari browser, “Prevent cross-site tracking“ in the Settings menu → Privacy is disabled.
Accessing
Click on Enterprise Reporting from the left navigation bar.
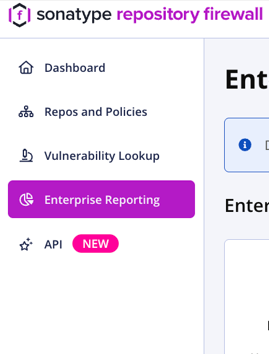
Get to know your Enterprise Reporting Landing Page
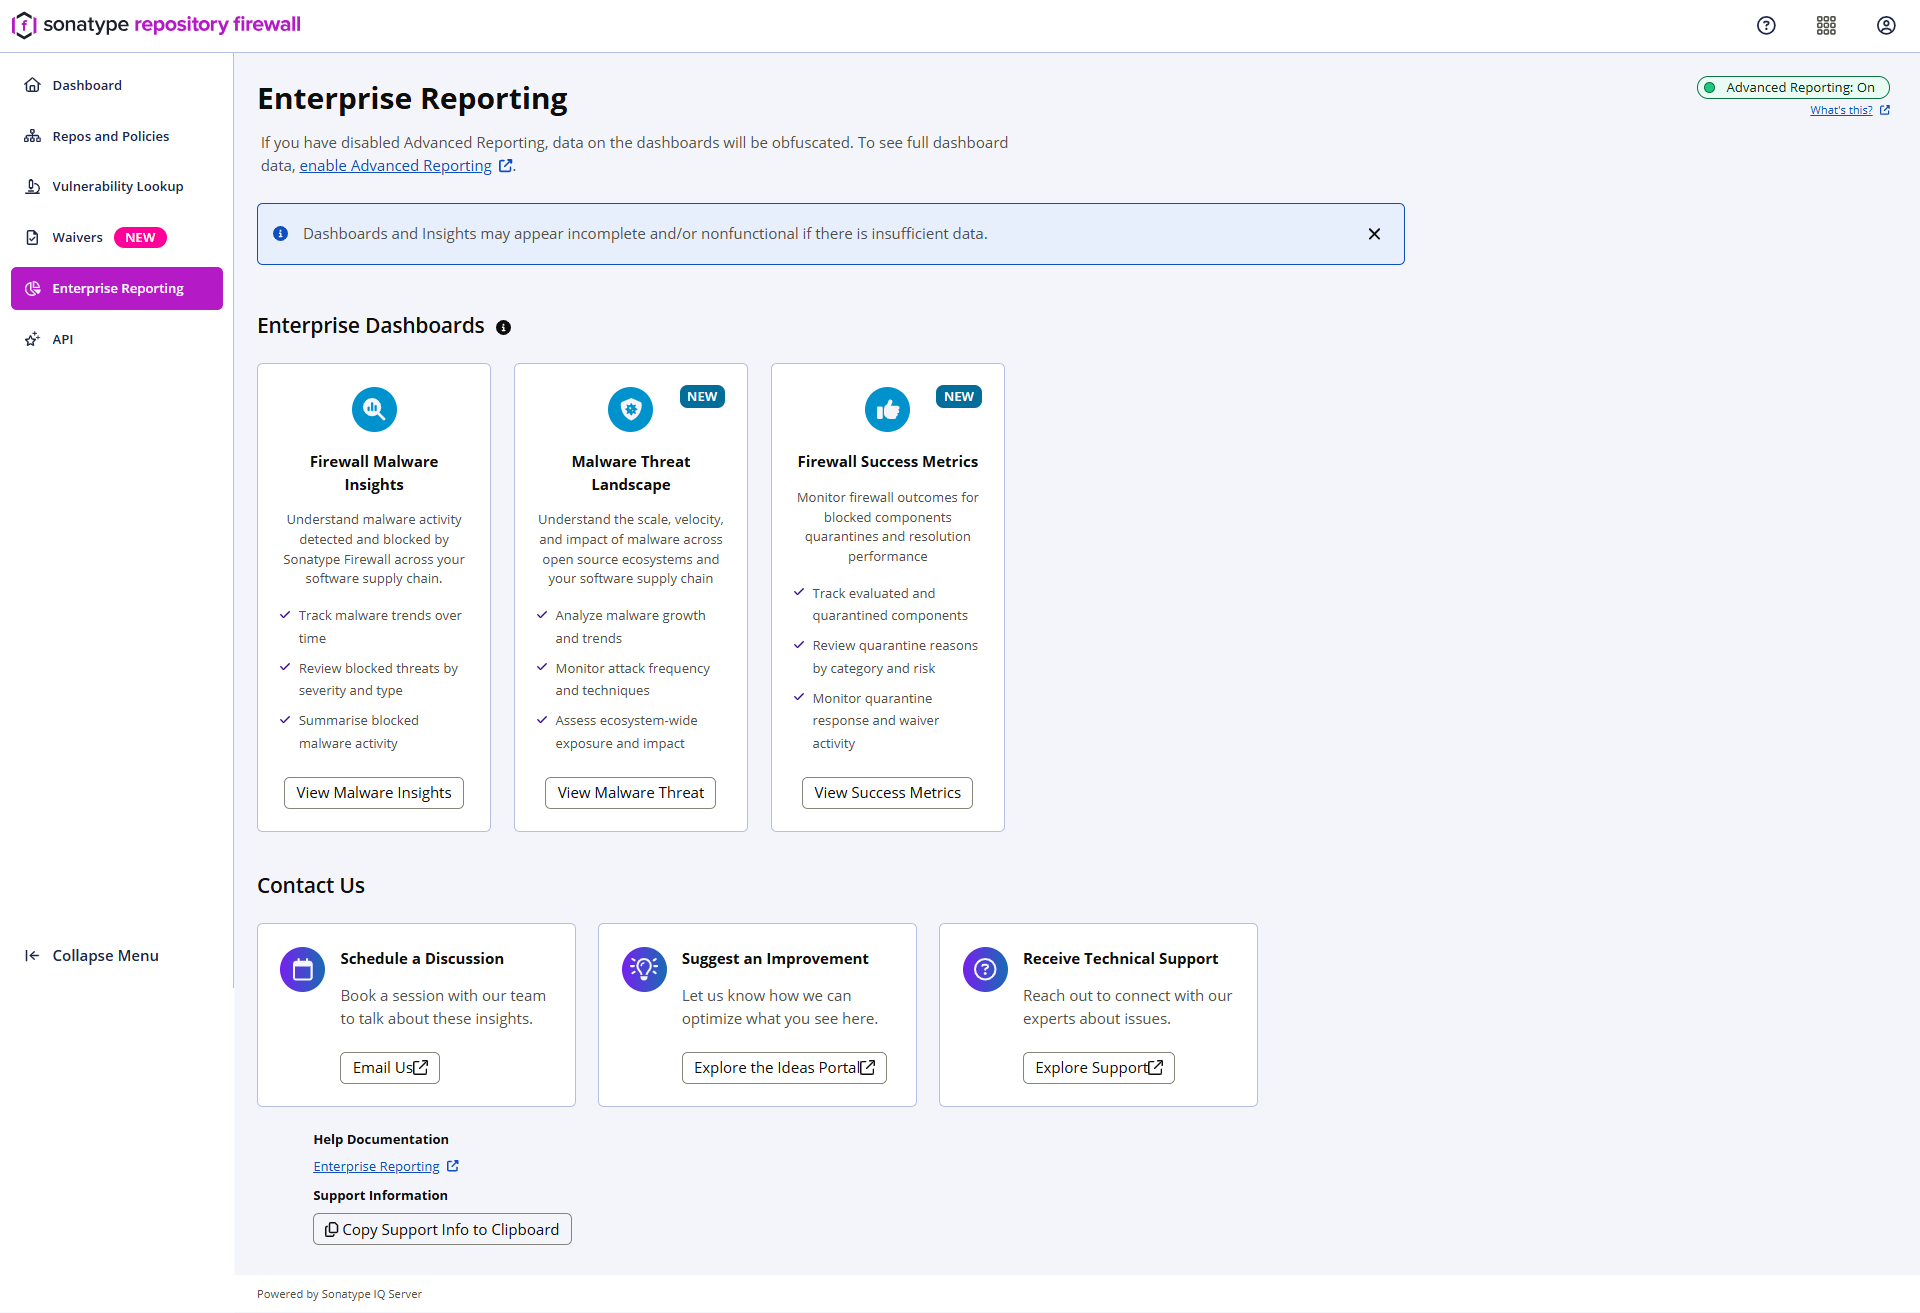
The Enterprise Reporting landing page displays the following information:
Enterprise Dashboards
Enterprise dashboards offer a set of logically related visualizations or charts to provide a complete picture of key aspects that impact the organization’s security posture and malware risk exposure. The individual visualizations in an enterprise dashboard are curated and compiled to empower users to make data-driven informed decisions and maximize the value delivered by using Sonatype Firewall to protect the software supply chain.
Reports that are part of a logical group appear under a single card with a drop-down menu, allowing you to select the specific report view you need.
Exporting dashboards and table data
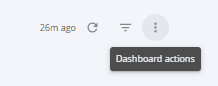
Enterprise Reporting dashboards include two action menus: Dashboard actions and Tile actions
Dashboard actions are available from the three-dot menu in the top-right corner of the dashboard. Use dashboard actions to refresh dashboard data, show or hide filters, download the dashboard, schedule delivery, or reset filters.
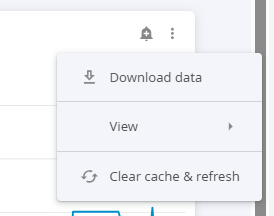
Tile actions are available from the three-dot menu on an individual visualization or table. Use tile actions to download data for a specific tile or table.
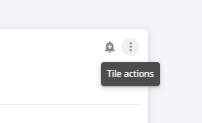
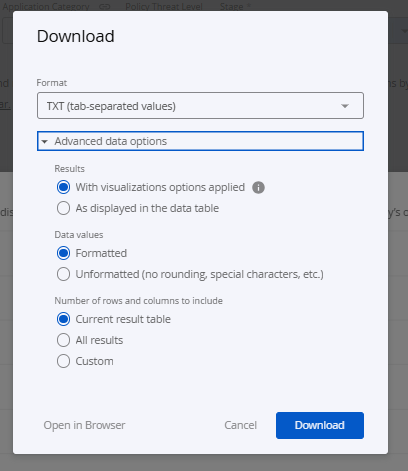
To export the full dataset for a table, open the tile actions menu, select Download data, expand Advanced data options, and set Number of rows and columns to include to All results.
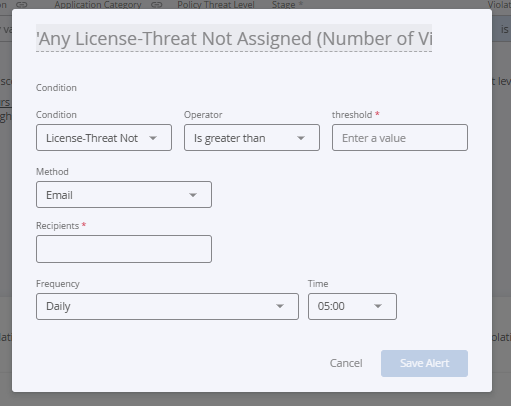
On supported tiles, you can also use the Alerts icon to create alerts based on configured conditions, recipients, frequency, and delivery method.
Enterprise Dashboard: Firewall Malware Insights
Explore your malware detection trends and quarantine activity using this foundational dashboard.
Learn more about Firewall Malware Insights Dashboard.
Enterprise Dashboard: Malware Threat Landscape
Explore malware growth trends, attack frequency, and ecosystem-wide exposure using this dashboard.
Learn more about Malware Threat Landscape Dashboard.
Enterprise Dashboard: Firewall Success Metrics
Explore Firewall success metrics for evaluated components, quarantine activity, waiver activity, and resolution performance using this dashboard.
Learn more about Firewall Success Metrics Dashboard.
Contact Us
As part of our initiatives to foster innovation, the Sonatype Research Team invites new conversations on these visualizations. This section contains email and links to suggest improvements or receive technical support.