Shaded Vulnerability Detection
About the Data
Data Refresh Frequency: Updated on a weekly basis, on Mondays.
Displays Data for: Scans performed from 2024-01-01
Minimum Requirements: Shaded vulnerability data is updated weekly on Mondays. New vulnerabilities are available for viewing after 7 days.
Overview
The Shaded Vulnerability Detection dashboard is a tool to estimate the impact of the increase in policy violations that users will experience, due to the introduction of our new Shaded Vulnerability Detection algorithm.
Our new Shaded Vulnerability Detection algorithm has uncovered a new threat layer that was previously undetectable by vulnerability detection tools in the market today. It can detect vulnerabilities that have been shaded or recompiled (depends upon factors such as compiler optimizations). This means that if an author of an open source component has included vulnerable code in their project and then relocated or recompiled it, the shaded vulnerability detection algorithm will still be able to detect that vulnerability. The algorithm can also detect simple modifications to the source code, post re-recompilation.
Due to the newer vulnerabilities being discovered, users will see new policy violations, which could break builds or stall the development processes at different stages. The Shaded Vulnerability Detection Dashboard assists with the identification and prioritizing the remediation process.
The Shaded vulnerabilities shown on this dashboard are as a result of dependency management or build process issues. These vulnerabilities are the transitive inclusion of already known and reported vulnerabilities and not zero days.
How to Prioritize Remediation for Shaded Vulnerabilities
Using this dashboard you can establish the priority of remediation, by making an informed decision based on the risk due to shaded vulnerabilities.
The key vulnerability attributes that can impact prioritizing any potential remediation are:
Applications
Review the newly identified vulnerable open source components your mission-critical applications use, to determine the impact from the newly identified vulnerabilities.
Severity
Prioritize the remediation of your applications against the severity of the newly identified vulnerabilities.
Stage
Based on your application's stage in the development cycle, determine the timing of remediation.
Critical Fixes and High Fixes
Remediate and prioritize updates to your applications based on whether a non-vulnerable version is available.
# Vulns
Prioritize based on the number of published security advisories (#Vulns) for the vulnerabilities identified.
For Faster Remediation
Enable Auto PRs to allow Sonatype Lifecycle to update components to non-violation versions.
Use Component Search to find other available component versions.
Drip Dates - Phased Roll-out of Shaded Vulnerabilities
Based on the new shaded vulnerability detection algorithm, you may experience an increase in the number of policy violations in Lifecycle. To assist remediating these violations, Sonatype is managing the identification and release of additional vulnerabilities in stages, based on the severity.
The Drips, i.e. the data roll-out dates represent the dates when the shaded vulnerability data will be rolled out to Sonatype customers. As a result, Lifecyle users will see new policy violations.
Drips | Dates for Release | Severity of Shaded Vulnerabilities |
|---|---|---|
Drip 1 | 09/09/2024 - 09/23/2024 | All Critical Shaded Vulnerabilities |
Drip 2 | 09/30/2024 - 10/21/2024 | All High Shaded Vulnerabilities |
Drip 3 | 10/28/2024 - 11/18/2024 | All Medium Shaded Vulnerabilities |
Drip 4 | 11/25/2024 and later | All Low shaded vulnerabilities |
Get to know your Shaded Vulnerability Detection Dashboard
The Shaded Vulnerability Detection dashboard shows data for affected customers and visualizations with key vulnerability attributes to help prioritize and suggest remediation plans.
Host Name of the Selected Instance
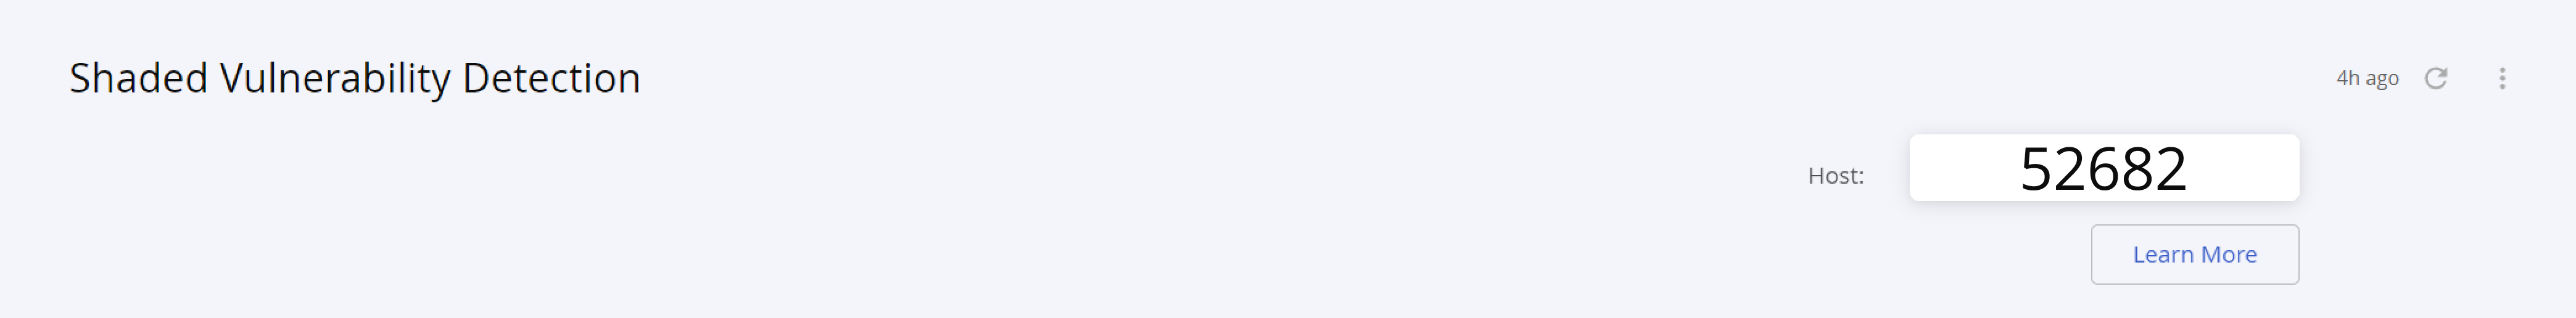
The host name on the top right of the dashboard indicates the instance of Sonatype IQ Server where the shaded vulnerabilities have been detected.
Filter Options
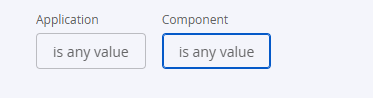
You can select any application or component from the filter options, for targeted results.
Shaded Vulnerabilities Chart
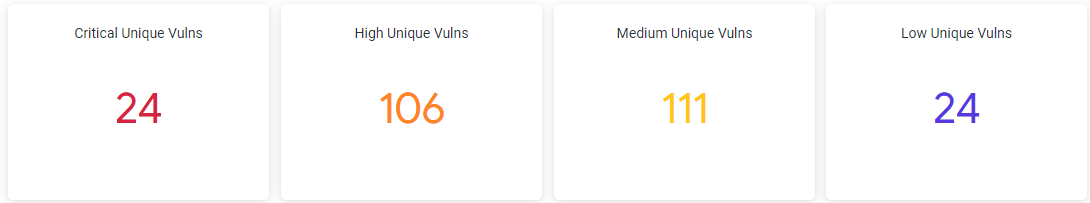
The Shaded Vulnerabilities chart shows the total number of vulnerabilities in each category, i.e. critical, high, medium, and low found across all applications.
Shaded Vulnerabilities Trends
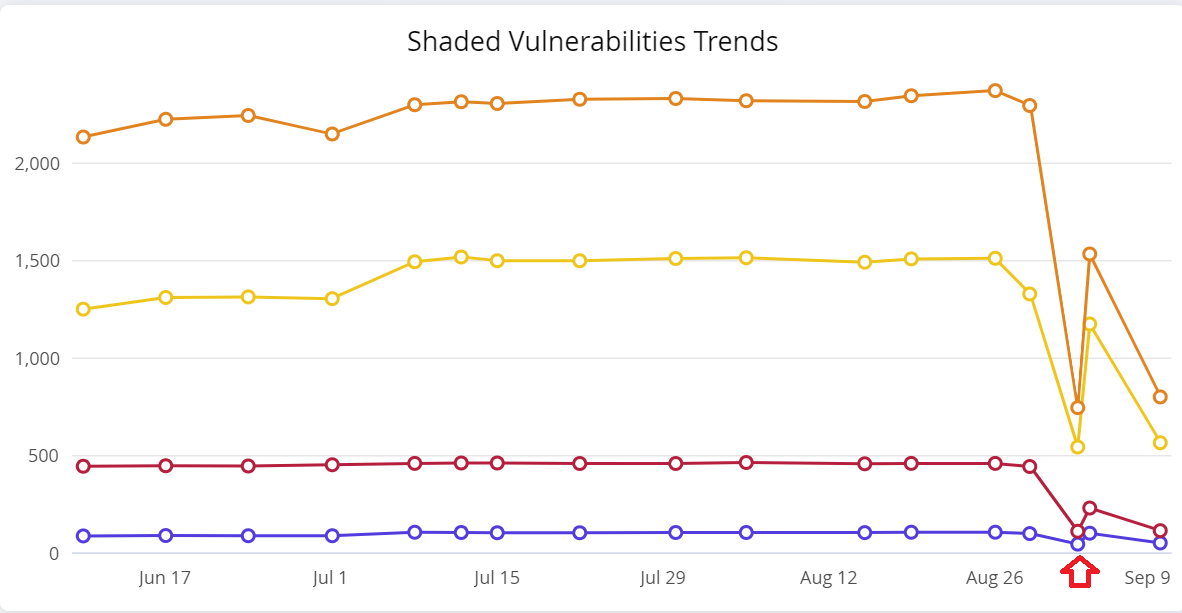
The dip (between August 26 and September 9 ) in the Shaded Vulnerabilities Trend indicates our back-end data refresh process, to re-initialize the Shaded Vulnerabilities data before public release.
Vulnerable Components per Application Table
This table shows a list of all applications and the corresponding components on the current Sonatype IQ instance (host).
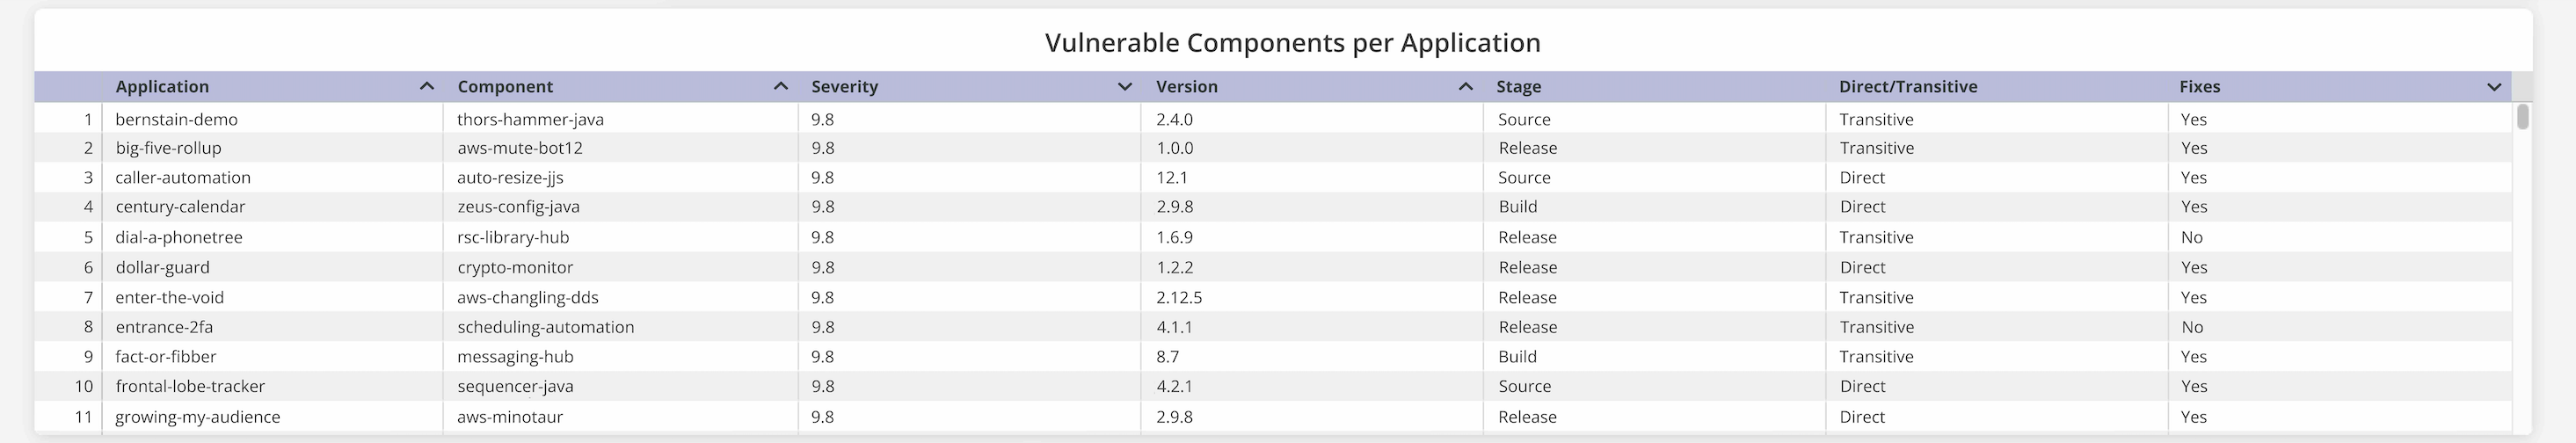
Table column | Description |
|---|---|
Application | The name of the applications in the current instance of Sonatype IQ Server. |
Component | The name of the implicated component in the Sonatype IQ instance that contains the shaded vulnerability |
Severity | Indicates the severity level assigned to the implicated component |
Version | Indicates the version number of the implicated component |
Stage | The development stage (develop, source, build, stage-release, release or operate) at which policy evaluation is configured for the application. |
Direct/Transitive | Indicates whether the implicated component is called as a direct or transitive dependency |
Fixes | Indicates if a fix for the implicated component is available |
Fixes Available for Highest Risk and Total Vulnerabilities
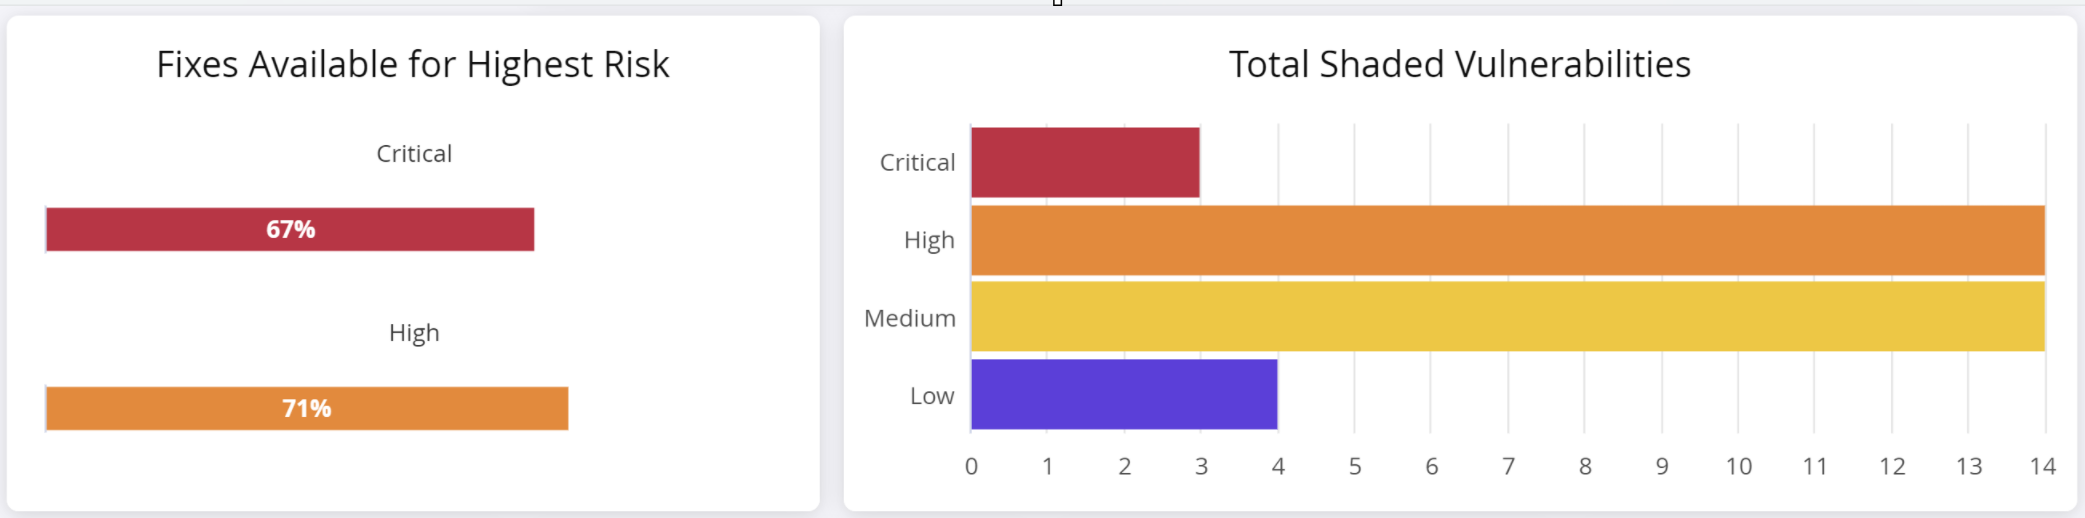
The Fixes Available for Highest Risk section shows the number of fixes (non-vulnerable versions of the implicated component) for critical and high severity vulnerabilities.
NOTE: The Fixes Available shown in this metric are not based on policy. You may see different results, depending on how your policy is structured.
The total shaded vulnerabilities chart shows the number of shaded vulnerabilities detected for each category of severity.
Breakdown of Fixes Available
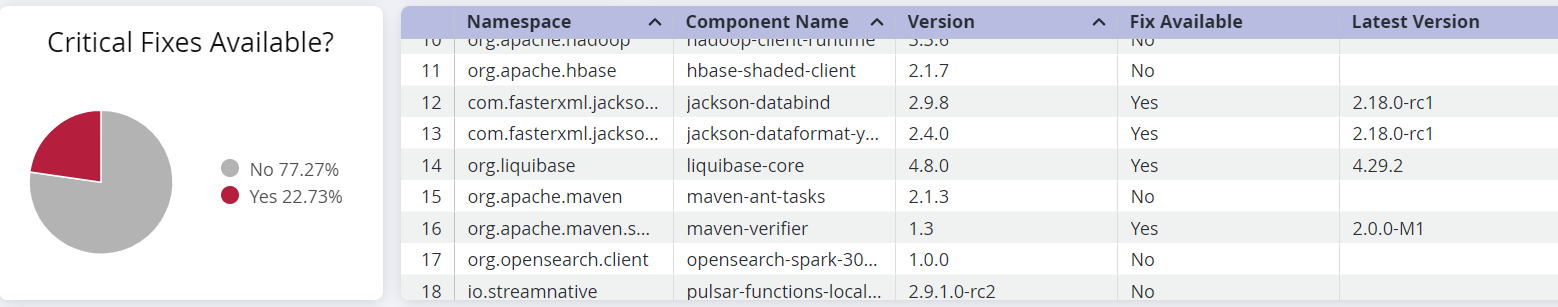
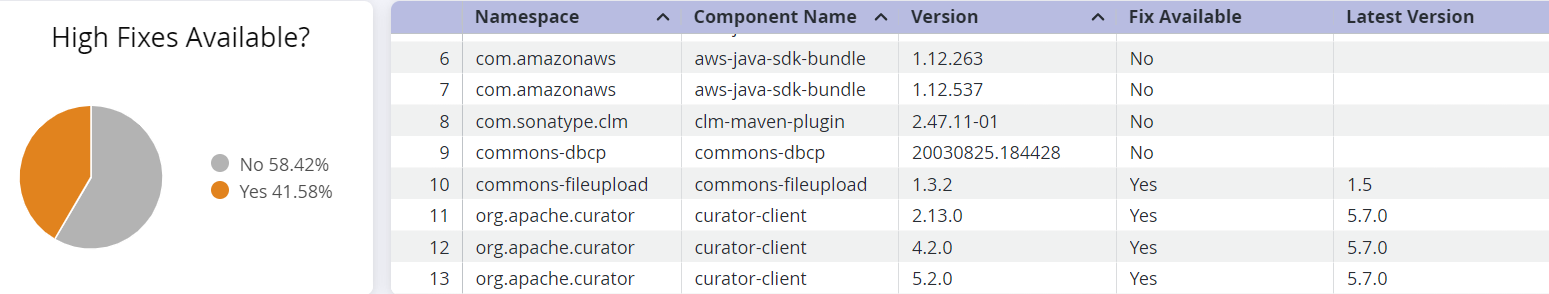
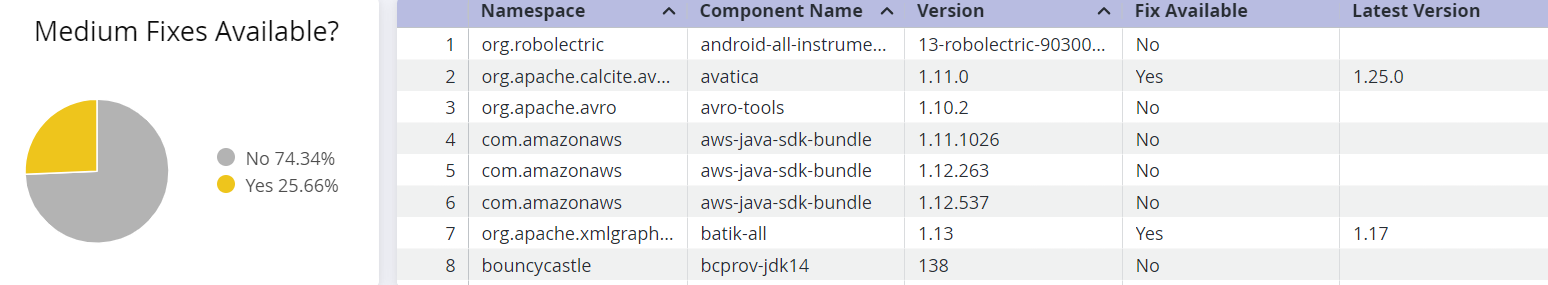
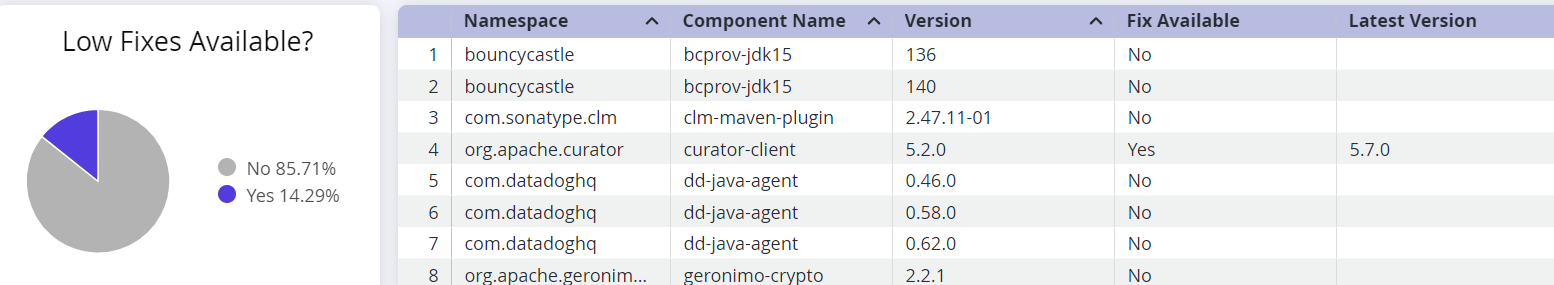
This section shows a breakdown of fixes available for each severity level of the of implicated components.
Use the corresponding table to determine if a fix is available for the component to prioritize remediation.
Table column | Description |
|---|---|
Namespace | The namespace to which the implicated component belongs, to prevent naming conflicts with components from another namespace. A blank namespace could indicate a component from an unnamed namespace. |
Component Name | The name of the implicated component in the Sonatype IQ instance that contains the shaded vulnerability |
Version | Indicates the version number of the implicated component |
Fix Available | "Yes" if a fix for the component is available |
Latest Version | The latest version of the component that does not have a shaded vulnerability. However, we recommend checking for breaking changes and other vulnerabilities, before remediation. |
Highest Risk by Components
This table shows a list of components that are "critical" or "high" risks. You can sort the table on the relevant columns to get different perspectives on the risk. For e.g. sorting on the column 'Stage' gives you a list of components implicated with shaded vulnerabilities in a specific stage of development. You can prioritize the remediation at the stage that is most relevant for your situation.
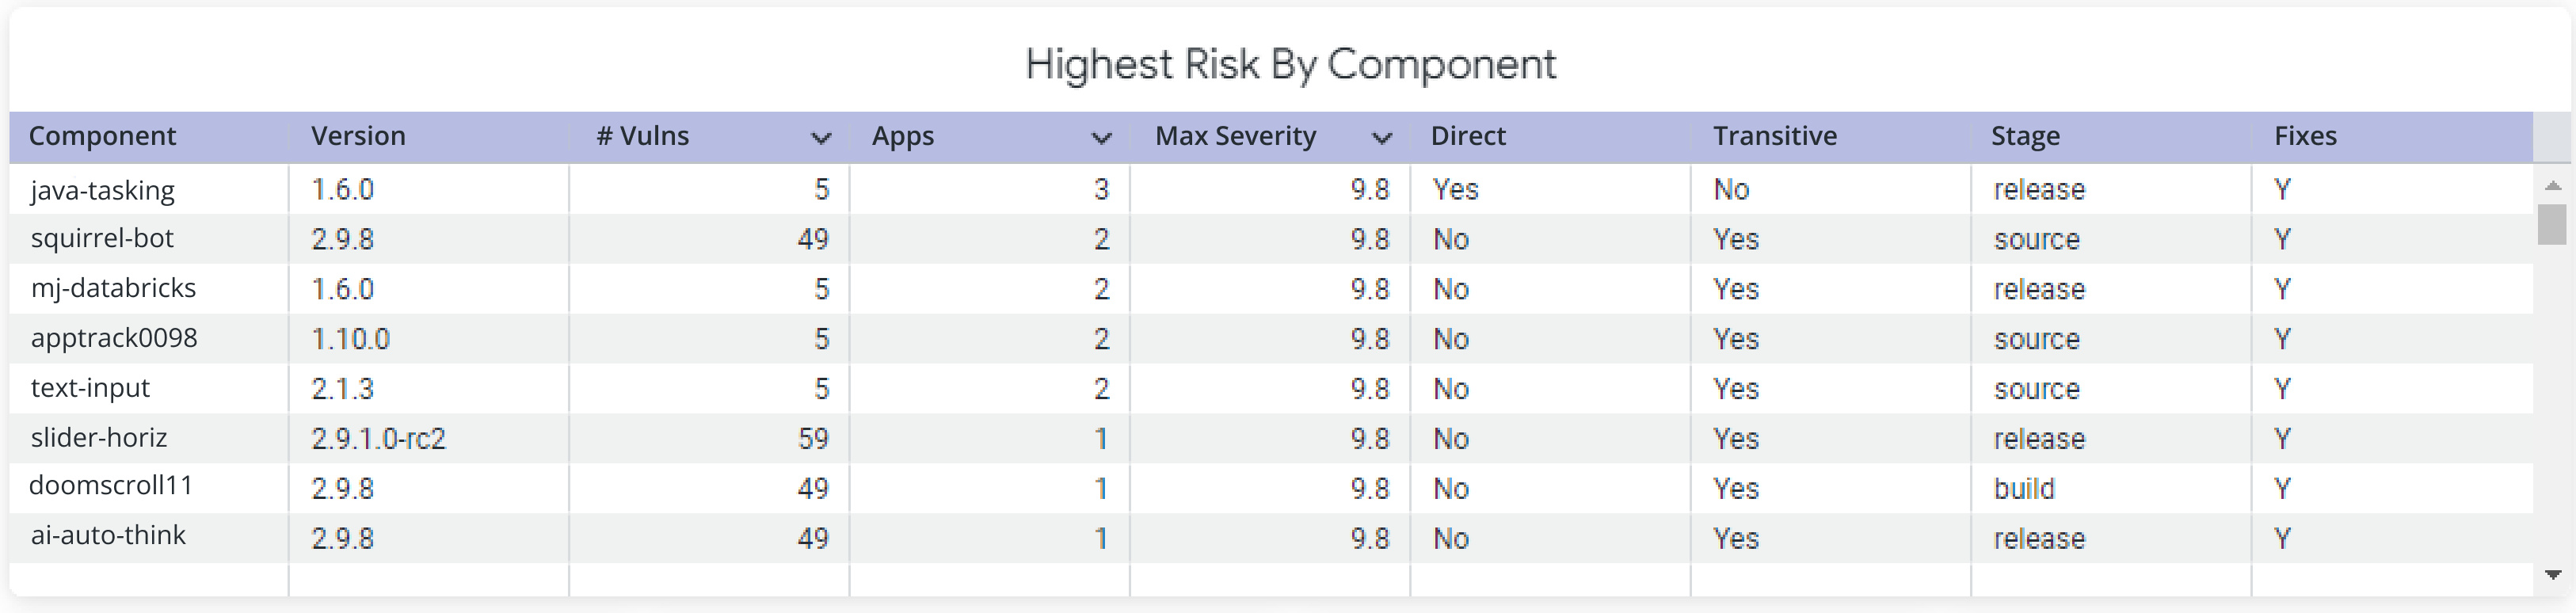
Table column | Description |
|---|---|
Component | The name of the implicated component in the Sonatype IQ instance that contains the shaded vulnerability |
Version | Indicates the version number of the implicated component |
# Vulns | Indicates the number of published security advisories that implicate the component |
Apps | Indicates the number of applications containing the implicated component |
Max Severity | Indicates the maximum severity level assigned to the implicated component |
Direct | "Yes" indicates that the implicated component is called as a direct dependency |
Transitive | "Yes" indicates that the implicated component is called as a transitive dependency |
Stage | The development stage (develop, source, build, stage-release, release or operate) at which policy evaluation is configured |
Fixes | 'Fix' implies a non-vulnerable version of the component. "Y" or "N" indicates a fix is available or not |
Risk by Stage for Direct/Transitive Dependencies
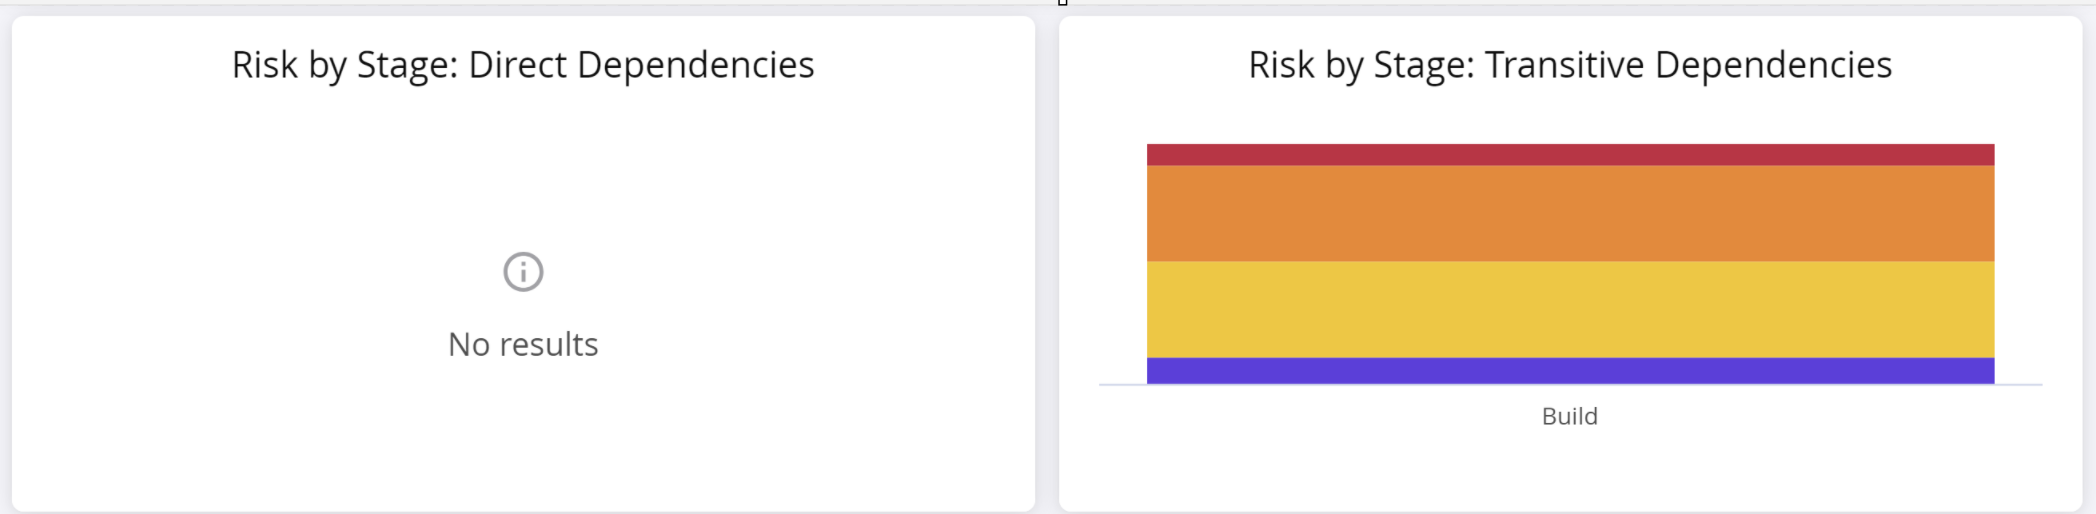
This section shows the magnitude of shaded vulnerabilities, found in direct and transitive dependencies at each stage. The colors in the chart represent each severity level, i.e. critical, high, medium and low.
All Shaded Vulnerabilities
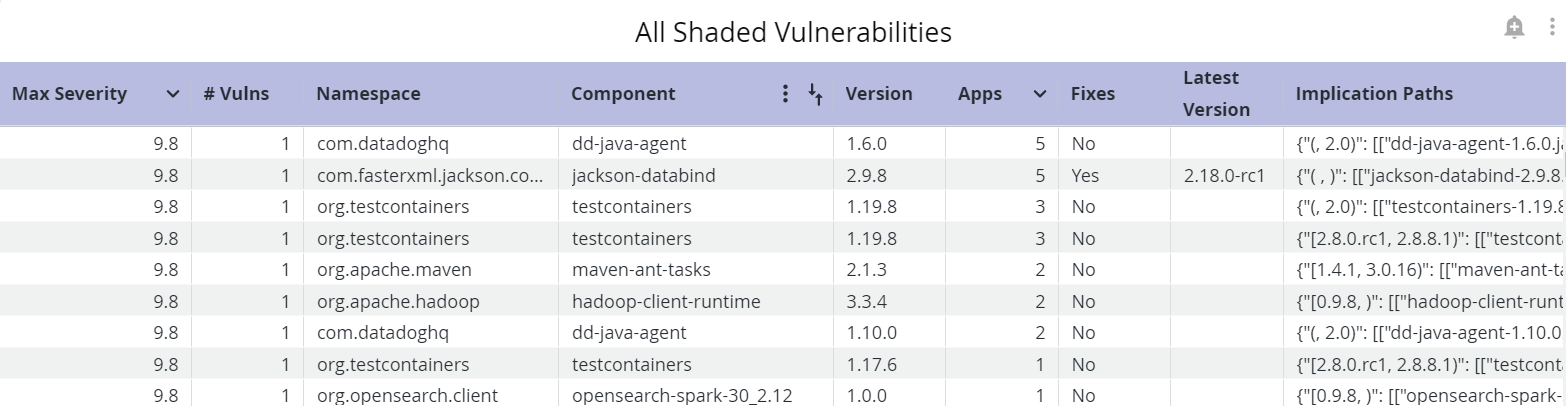
This table shows a list of all vulnerabilities discovered by the Shaded Vulnerability Algorithm on your IQ instance.
Table column | Description |
|---|---|
Max Severity | Indicates the maximum severity level assigned to the implicated component |
# Vulns | Indicates the number of published security advisories that implicate the component |
Component | Indicates the name of the implicated component |
Version | Indicates the version number of the implicated component |
Apps | Indicates the number of of shaded vulnerabilities of severity High in that stage |
Fixes | Indicates if a fix is available for the implicated component. 'Fix' implies a non-vulnerable version of the component. |
Latest Version | The latest version of the component that does not have a shaded vulnerability. However, we recommend checking for breaking changes and other vulnerabilities, before remediation. |
Implication Paths | The exact paths of the vulnerable classes |
Using the Vulnerability Details REST API
The field detectionType in the response of the GET method of the Vulnerability Details REST API will have the value UNSHADER if the vulnerability is discovered by the Shaded Vulnerability Algorithm.
Troubleshooting
Refreshing the browser may give you the following error.
An error occurred loading data. Dashboard is null or empty.
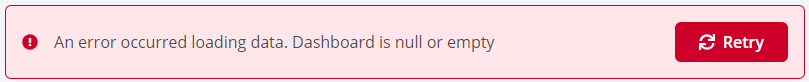
From the page with this error, select back on your browser to the landing page: Data Insights
Select the dashboard you want to view, to reload the visualizations
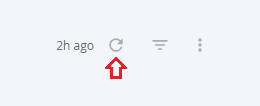
To refresh the page, instead of using the browser, select the refresh icon on the top right.